Just 6 days ago (on Wednesday 15th December 2021), we released our* long-awaited GenInsights21 report – our update to, and extension of, the 180-page analytical component of the popularly received GRC2018*.
* When I say ‘our’ I am speaking more broadly about the collaborative arrangement between joint authors:
(a) us at Global-Roam Pty Ltd (providers of this WattClarity service, and a range of other software products)
(b) and our partners in GenInsights21, Greenview Strategic Consulting.
There were a number of other Analysts and Others outside of these two organisations whose assistance we greatly appreciated as well.
With the release on Wednesday last week, we were mostly focused on:
Priority #1 = ensuring that all those who had pre-ordered their access to the GenInsights21 release were able to download the >600-page PDF copy; and
Priority #2 = delivering all of the components of the report to the printers, to get started on the printing and binding process so that these clients can receive delivery of their hard copies as soon as possible (notwithstanding the Christmas delays).
As such, we were not really focused on providing information more broadly, other than this simple note.
(A) Overall structure of the report
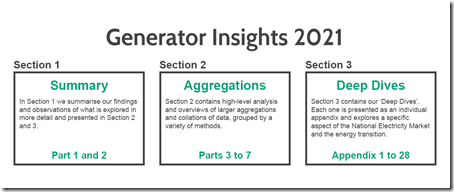
Last Wednesday we highlighted this general structure of the report, conceptually represented in three sections:
In binding the report, we’ve found it easiest to provide this in two discrete bundles as follows:
| 1st Section Summaries |
2nd Section Aggregations |
3rd Section 28 x ‘Deep Dive’ Appendices |
| Through 22 Key Observations we’ve tried to distil what’s in the other 540 pages of the report into a number of ‘so what’s it really mean?’ answers … or deeper level questions in some cases. | Across Parts 3, 4, 5, 6 and 7 we aggregate data in various ways. | Last week (on Monday 6th December) I began to list some of the 28 individual appendices through which we delve into a wide range of different explorations of data, and NEM history. |
|
Book #1 |
Book #2 |
|
|
In a later article, we’ll expand further on some of what has been covered in both:
… which are being bundled together in the first book |
Below, we expand on this tabulated list to provide more context to each of the 28 individual ‘Deep Dive’ Appendices included with GenInsights21. |
|
(B) Listing the 28 individual ‘Deep Dive’ Appendices
Back on 6th December in this article, we provided an initial look at some of the 28 individual Appendices included with the report (to be delivered together in the second printed bundle). Today we thought it might be useful to provide the fuller listing, as follows:
|
# |
Grouping |
Appendix Title |
Brief synopsis. |
|
1 |
High-Level Perspectives |
A history of Renewables Development in the NEM (15 pages) |
When we started mapping out GenInsights21, it became apparent that it would benefit from the inclusion of a focused description of the 20-year history of renewables development for the NEM. With the assistance of Tristan Edis and others at Green Energy Markets, we are able to include this as the first Appendix in GenInsights21. |
|
2 |
High-Level Perspectives |
Return on Invested Capital (14 pages) |
Back in Q2 2021 we all experienced incredible price volatility … which we explored at the times and was the result of a number of different factors. Back at that time, valued guest author Allan O’Neil started ‘eating the elephant’ to explore some aspects of what happened over Q2. Posted at the time were: (a) An appetiser, on 20th June 2021. (b) A second serving, on 22nd June 2021. With Allan’s assistance we are able to include in GenInsights21 ‘the Main Course’ in the form of a review of what Q2 volatility would say about Return on Invested Capital (another metric added to the expanded Glossary included with GenInsights21). |
|
3 |
High-Level Perspectives |
The Decline of Coal (6 pages) |
In Observation 11 within Part we we explored several aspects (and risks) that might be entailed in what could be a ‘Messy Collapse of Coal?’ – and include the following diagram to illustrate what looks to be coming down the pipe: Inside this Appendix, we expand on the chart above. |
|
4 |
High-Level Perspectives |
20-year trend of Marginal Loss Factors (12 pages) |
There’s been a lot of questions asked about Marginal Loss Factors in recent years (it was named as Headwind #1 by Allan in his article ‘How good is solar farming?’ in January 2020). We thought it would be a useful point of context to include this 12-page and very graphical 20-year review of Marginal Loss Factors across the NEM so readers of GenInsights21 can ‘see the woods for the trees’! There’s also a ‘guess the mystery DUID’ quiz out there, for those so inclined! |
|
5 |
High-Level Perspectives |
Trended Implied Losses (8 pages) |
Immediately following from Appendix 4 , we take the MLFs as they have been calculated through the history of the NEM and answer the question ‘What would the MLFs have indicated, in terms of energy lost in transmission over time (and by region) in the dispatch process?’. |
|
6 |
High-Level Perspectives |
A review of self-forecasting (18 pages) |
One area of technology that has seen rapid growth in recent years (off the back of ARENA support) has been the use of Self-Forecasting by operators of Semi-Scheduled Wind and Solar plant in the NEM. The number of installed Wind Farms and Solar Farms continues to grow every year in the NEM – and many expect this to continue (and accelerate) into the future. The end of 2021 provides a timely juncture to look back and include this review of self-forecasting systems – with a particular eye to: (a) review of the uptake and consistency of usage of the self-forecasts, and (b) a review of the purpose of the self-forecasting process. Some interesting observations there! |
|
7 |
High-Level Perspectives |
Recent Performance of Renewables (21 pages) |
On 18th May 2021, Marcelle Gannon posted the article ‘Ranking wind farm performance and FCAS costs in the NEM in 2020’ on WattClarity – utilising data for CAL 2020 that had been incorporated into the GSD2020. This article followed an earlier series of articles (17th March, 26 March and 1st April 2021) exploring solar farm performance – again with reference to CAL 2020. In this Appendix within GenInsights21, we expanded on this methodology and updated to include more recent performance in CAL 2021 YTD. |
|
8 |
Actual Market Outcomes |
Frequency Performance (14 pages) |
Another recent development for the NEM has been the change in frequency distribution now experienced across the NEM, off the back of the re-implementation of Primary Frequency Control (PFC – or PFR) . Following a review by the AEMC the draft proposal published October 2021 is for PFR to remain mandatory. A great time, therefore, for us to include a detailed review of frequency performance as part of this compendium of insights. |
|
9 |
Actual Market Outcomes |
FCAS exploration (6 pages, |
Given that Jonathon Dyson wrote ‘Let’s talk about FCAS!’ way back in 2017, and followed that up with ‘FCAS Matters – more than ever’ in February 2020, it should be no surprise to anyone that we’ve focused one particular Deep Dive Appendix on a review of each of the 8 individual FCAS markets. |
|
10 |
Actual Market Outcomes |
Storage (8 pages) |
On 10th September 2019 we posted ‘Some observations about Storage’ utilising what had been published earlier in the GRC2018. In this Appendix of GenInsights21 we provide some updated/extended discussion. |
|
11 |
Actual Market Outcomes |
Inertia (5 pages) |
In the GRC2018 we included a trend of the calculated level of inertia in each region – highlighting how measures put in place in the aftermath of the SA System Black were having an effect on the level of inertia in the SA region. In this Appendix in GenInsights21 we have expanded on, and updated, this analysis. |
|
12 |
Actual Market Outcomes |
Constraints (14 pages) |
Following the publication of the GSD2020, we posted the article ‘Which units were most impacted by constraints in 2020?‘. Whilst that article (and the GSD2020 in general terms) are deliberately focused on a bottom-up perspective – with results for individual units, in this Appendix we reverted to an alternate Top-Down perspective to understand: 1) How have the the incidence, and severity, of constrained market outcomes been changing over time? 2) What’s the relative impact of ‘System Normal’ and ‘Outage’ constraints … with some findings here making their way back into the headline observations in Part 2. |
|
13 |
Actual Market Outcomes |
Rooftop PV (8 pages) |
Rooftop PV is clearly one of the standout success stories of the energy transition, to-date, but it does not come without challenges. These are explored in this appendix. |
|
14 |
Actual Market Outcomes |
Minimum Demand (6 pages) |
On WattClarity we’re posting increasingly frequently about the dynamic of reducing minimum demand in the NEM – both from the perspective of individual regions and also on a NEM-wide basis. On 31st October 2021 was the last time we had time to post this updated table of record low points, but it is already out of date in some regions. What better time then to step back and think through some of the implications of this change, via Appendix 14. |
|
15 |
Actual Generation Outcomes |
Aggregate Scheduled Target (26 pages) |
As time permits, we might explain more of what we explored here, and why. |
|
16 |
Actual Generation Outcomes |
Forecast Convergence (29 pages) |
Through our ez2view software, we have provided the capability of ‘Forecast Convergence’ to an expanding number of our client base. Back on 21st June 2021, Linton used a similar ‘Forecast Convergence’ function to ask the question ‘Is the predictability of day-ahead demand improving?’ . That’s the tip of the iceberg, though, in terms of really drilling into some of the core challenges that we’re increasingly being presented with in this energy transition. For instance, what does it mean in terms of ‘firmness of forecast availability’ of these different types of Mystery DUIDs? |
|
17 |
Actual Generation Outcomes |
Aggregate Raw Off-Target (19 pages) |
Via WattClarity through 2019 and part of 2020 we explored the evidence of increasing ‘Aggregate Raw Off-Target’ across all Semi-Scheduled units (i.e. Wind and Large Solar): 1) On WattClarity this was discussed on 5th May 2020 then 24th July 2020 and 27th July 2020. (a) This analysis only extended to 31st December 2019 (b) A key question remained was how this would be affected by improvements such as self-forecasting, for instance. 2) Following from our analysis, which was referenced in other places, AEMO also had a look as we noted in the ‘2020 Wrap’. In this Appendix, we have updated and extended this analysis – with particular focus on the increasing incidence of extreme outcomes. For comparison, we show how performance of the same metric has been changing across the 48 x operational coal units over the 20+ year history of the NEM. A very useful comparison to compare and contrast … and to pose questions about the outcomes we’re likely to be seeing increasingly as the installed capacity of Wind and Solar grows if the Semi-Scheduled category continues to operate like it does now. |
|
18 |
Actual Generation Outcomes |
Coal unit Unavailability (12 pages) |
In amongst Part 4 of the GRC2018 we provided a 17-year trended review of coal unit unavailability – leading the readers with questions about a possible trend we highlighted as emerging in the 12 month period to 31st December 2018. In Appendix 18 within GenInsights21 we provide answers to the questions that we had at that time! [there are a couple other Appendices, as well, that delve into the different challenges of coal, as it declines] |
|
19 |
Actual Generation Outcomes |
Coal Unit ‘Sudden Failure’ (12 pages) |
Also inside of Part 4 of the GRC2018 we explored a number of different aspects of how coal unit ‘dependability’ was … and was not … changing in the period to 31st December 2018. Amongst the measures were three different metrics tracking coal unit ‘Sudden Failure’. In GenInsights21 we update and extend this analysis across the same three metrics and reveal some interesting developments. |
|
20 |
Actual Generation Outcomes |
(Coal Unit) Forced Outage Rates (12 pages) |
This exercise was quite difficult to do – but we sense readers will be grateful for the clarity provided about: 1) Which coal units are seeing increased Forced Outage Rates in recent years; and 2) Which coal units are not exhibiting increased EFOR |
|
21 |
Actual Generation Outcomes |
Generator Capacity Factors (15 pages) |
In a later update we will outline more than just the title of this Appendix. |
|
22 |
Actual Generation Outcomes |
A review of bidding ‘busyness’ (49 pages) |
The end of 2021 is also a very topical time to review what’s been happening with bidding behaviours with Generators (and Scheduled Loads) given a number of recent changes underway in the market – including: 1) the transition to Five Minute Settlement , 2) the Rise of the Auto-bidder , and 3) recent improvements that the AEMO has made to the dispatch process. There’s much that jumped out at us in performing this review recently … including what is framed as a Question in Observation 12 within Part 2! |
|
23 |
Actual Generation Outcomes |
Review of Bidding (Price) Changes (14 pages) |
Following immediately from Appendix 22 above, this Appendix takes a different look at bidding behaviour and answers the question – ‘how often do generators adjust the price bands in their Daily Bids?’ … and in particular: 1) On which days of the year do these typically change; and 2) Which units (in which portfolios) are the ‘busiest’ in terms of changing their price bands. There’s some units in this list that really surprised us! |
|
24 |
Actual Generation Outcomes |
Generator Curtailment (5 pages) |
On 5th June 2020, Marcelle Gannon posted the article ‘Not as simple as it appears – estimating curtailment of renewable generation’ to explain the complexities (and opacities!) of getting this number right. In this appendix we present some number for renewable plant to highlight how much they are being constrained and the relative causes (e.g. transmission congestion, or economic pricing).
|
|
25 |
Actual Generation Outcomes |
VWA/Spot Revenue Insights (7 pages) |
At some point in future, we might describe more what’s in this appendix. |
|
26 |
Actual Generation Outcomes |
100% Renewables (21 pages) |
On 14th July 2021 during a CEDA address the new AEMO CEO, Daniel Westerman, pronounced his Big Hairy Audacious Goal (BHAG) about readying AEMO – and helping to ready the broader energy sector – to be able to deal with instantaneous NEM-wide renewable penetration that might occur as soon as 2025. This goal prompted us to include an appendix in GenInsights21 exploring the same thing. |
|
27 |
The Future |
Exploring Wind Diversity (28 pages) |
I’ve previously noted that this one has been developed for a number of months, ready for inclusion in the GenInsights21 release – thanks to the assistance of Stephen Wilson and others. This takes what we completed for the GRC2018 some years ago and extends it significantly – to answer some of the questions we asked in the GRC2018, but which we’d not seen anyone else answer in the intervening period. |
|
28 |
The Future |
Early insights from 5MS (49 pages) |
The audience who was present in Brisbane on Thursday 2nd December at the event organised by the Australian Institute of Energy about ‘Early insights on – Early insights about Five Minute Settlement’, you will have some idea about what’s in this Appendix. |
.
As you can see in the above, GenInsights21 does cover a lot of territory – in terms of what the 23-year history of the NEM (and in particular the recent history) can help us understand about the energy transition challenges we’re likely to face in the years (the decades!) ahead…
(C) More information to come
As time permits in the coming weeks and months, we’ll look to freely share small snippets of information about GenInsights21 here on WattClarity … but note that this can never be anywhere near all of the insights shared
For today, we thought sharing just the full list of Appendices was probably enough…
(D) How can I access GenInsights21 today?
The answer to this question is different, depending on whether you submitted your pre-order already (you should have already received an email from us to explain what to do!), or whether you’d like to order today:
| The Product | This is how you can Download GenInsights21
… to gain the benefits now |
This is how to Order the GenInsights21 Report
… to benefit from the insights we have uncovered |
| GenInsights21 Electronic PDF
(released on Wednesday 15th December 2021 as noted here) |
Clients who have already ordered will be able to download the electronic PDF of the GenInsights21 here, from today:
You’ll need to set up your own unique log-in, using your organisational email address in order to access:
One bound hard-copy is also being supplied as well:
|
Please complete this Order Form and send back to us:
After we receive your order, we will: (1) Set you up with electronic access at the site above (hence be sure to specify your corporate email address); and (2) Deliver your bound-hard copy (hence be sure to let us know where to deliver this); and (3) Process your payment and provide a tax invoice. |
We look forward to hearing back from you.





Leave a comment