Last week I published a comparison of spot energy revenues per MW of maximum capacity, as earned by large-scale solar farms across the NEM in 2020, based on calculations in the Generator Statistical Digest 2020, a recent publication by Global-Roam and Greenview Strategic Consulting. This followed my presentation at the Clean Energy Council’s Large-Scale Solar Forum on the topic “Exploring the market performance of large-scale solar farms across the NEM in 2020” on 11th March 2021.
My first article considered only spot energy revenue – the money earned by the generator from its participation in the spot market run by AEMO. I haven’t tried to estimate the owner’s actual return, as the owner will likely have hedging arrangements in place.
In this article I add in an estimate of LGC revenue. There’s an equivalent graph for wind here.
There are many reasons that explain the differences in spot and LGC revenue outcomes between the sites. Here are a few – thanks to the commenters on LinkedIn on my previous article who provided suggestions:
- average regional prices (such as NSW higher than QLD)
- coincidence of generation timing with prices (particularly when extremely high or negative)
- curtailment due to market constraints (could be short-term outages or longer-term congestion or system strength issues)
- marginal loss factors
- quality of the solar resource
- technical plant performance (including tracking)
- obligations and incentives in the PPA or other hedging arrangements – which may not align exactly with maximising spot energy revenue
- optimisation of production against FCAS costs
- effectiveness of bidding strategy and implementation
A renewable generator has other important income streams and costs, including:
- LGCs (Large-Scale Generation Certificates, part of the federal Renewable Energy Target scheme);
- FCAS costs (which I’ll look at in my next article);
- Operating costs, which may include a variable fee based on MWh generated.
My previous article looked only at spot energy revenues. Of the three points above, the LGC value is of a similar order of magnitude to the spot energy revenue, and will depend on the production of the generator. We might expect that sunnier regions (QLD?) could claw back some of the lower spot energy revenues compared to NSW by having higher production.
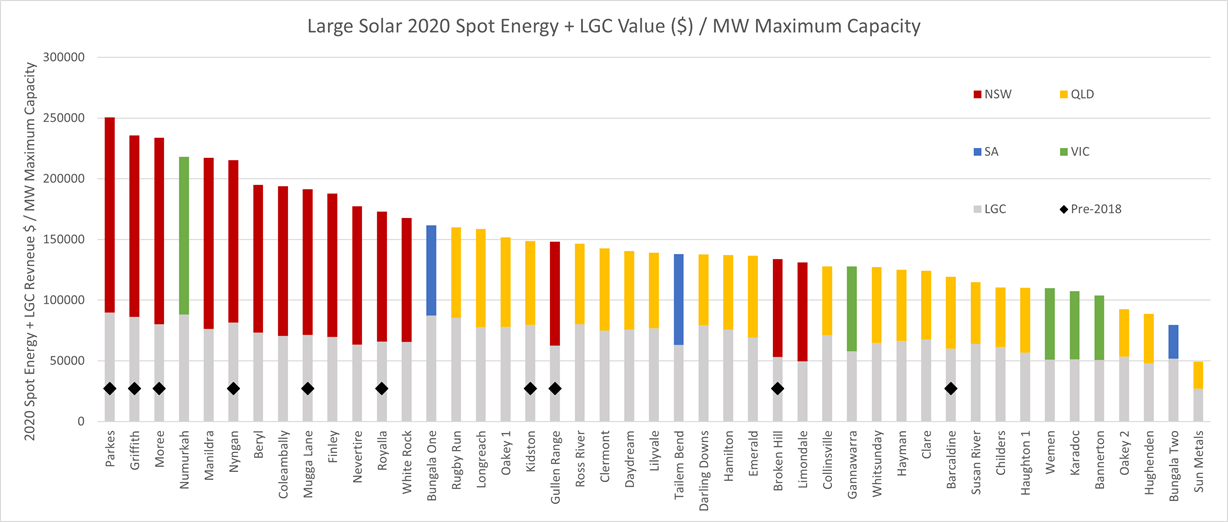
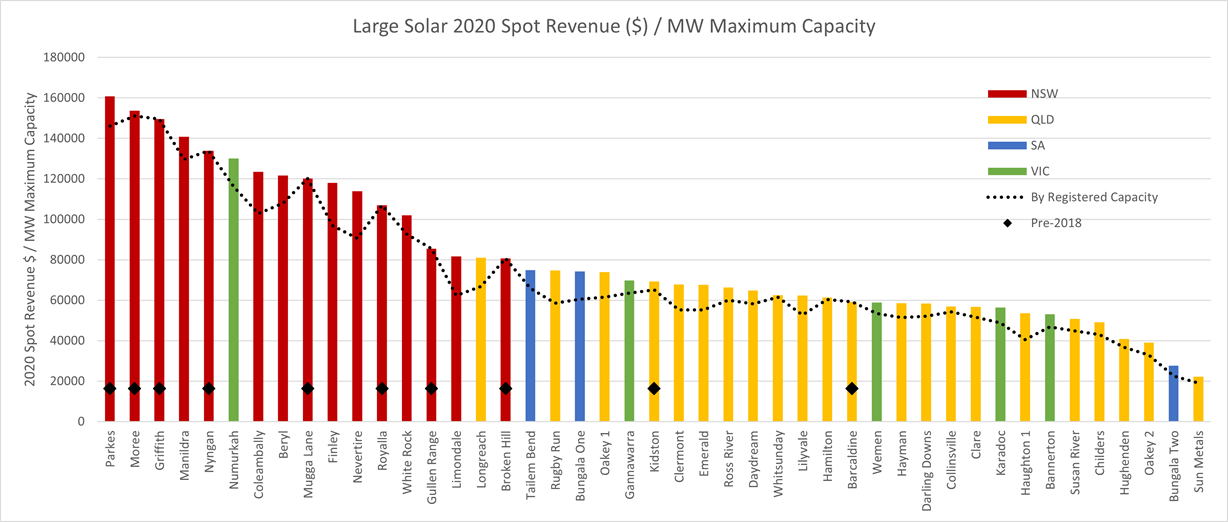
In the top graph below I’ve shown an estimate of spot energy plus LGC revenues, and for comparison the spot-revenue-only graph from the previous article, each sorted. The LGC value is a rougher estimate than the spot energy revenue as there isn’t a half-hourly price for LGCs. LGCs are registered each month with the Clean Energy Regulator and typically sold to retailers (or other “liable entities”) who have an annual obligation to surrender LGCs under the federal Renewable Energy Target scheme. LGCs are differentiated by their “vintage” – the calendar year they were created. One LGC is earned for each MWh of net generation adjusted for a loss-factor, typically the MLF for transmission-connected generators. There are three main ways a generator would sell its LGCs:
- Included in (often termed “bundled”) a power purchase agreement, or a long-term LGC-only agreement with a liable entity;
- Sold forward (often using a broking service), where a fixed quantity, price and transfer date are agreed by contract, often for a time several years in advance;
- Sold at spot (typically through a broker) at the going rate for LGCs for the current vintage.
As I don’t have access to the confidential LGC trading arrangements of generators, I’ve taken an average spot LGC price for the 2020 vintage between February 2020 and January 2021 of $38.
Comparing the two graphs here (with and without LGCs), some observations:
- Most of the NSW solar farms (including the top 3 pre-2018 farms) remain at the top – with the top site (Parkes) at around $250K/MW in 2020, compared to the top QLD (Rugby Run) at around $160K/MW.
- There’s a bit of shuffling in the mid-range sites, with some VIC and NSW sites moving lower down, due to lower production than some QLD sites.
- Tailem Bend in SA, which I noted in the previous article ended up with similar spot energy revenue per MW to Bungala 1 (also in SA), despite a very different bidding strategy and capacity factor, attracts less estimated revenue when LGCs are considered, as its production was lower.
In my next article I’ll have a look at estimated FCAS costs across 2020. For most solar farms these were a much smaller magnitude than the energy revenues, with some exceptions.


Excellent article. Would like more info and wondering how to contact author