On Friday 14th October, Tasmania experienced a significant system event with the loss of 530MW of electrical load following downed transmission lines that caused cascading issues. With the benefit of ‘Next Day Public’ data and our ez2view software (plus other tools), we take a quick initial look at the sequence of events
(A) System Frequency Trend
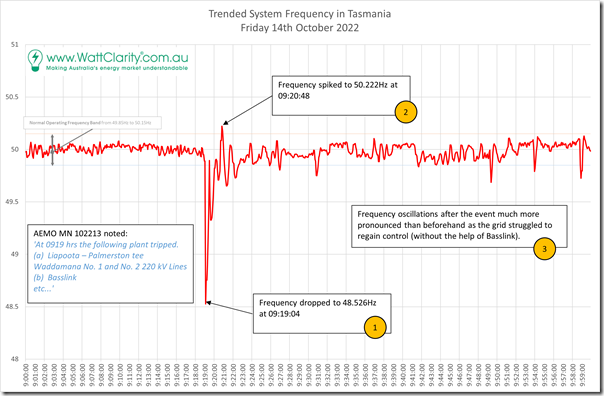
I thought it was worth starting with this trace of Tasmanian system frequency on the morning:
The key points to note are that:
1) At 09:19:04, using the timestamps in the reading, the TAS island frequency had dropped really low:
(a) which was 48.526Hz;
(b) well below the Normal Operating Frequency Band;
2) At 09:20:48 it had spiked:
(a) Back out the other side of the NOFB;
(b) To 50.222Hz.
… clearly this was a significant event!
3) In the minutes that passed since that time (40 minutes shown on the chart) the oscillations in frequency after the event continued to be much more pronounced than beforehand.
This aligns with what AEMO noted in Market Notice 102213, which (as noted on Friday) says:
At 0919 hrs the following plant tripped:
(a) Liapoota – Palmerston tee Waddamana No. 1 and No. 2 220 kV Lines
(b) Basslink
AEMO did not instruct load shedding.
Approximately 530 MW of electrical load lost.
The cause of this non credible contingency event is not known at this stage.
(B) DI to DI sequencing
The system frequency trace above comes from the AEMO’s 4-second SCADA data, and we might look more into that in some future article.
For now we’ll constrain ourselves to looking more into the event using our ez2view software and the ‘Time Travel’ function, which enables the user to reset the clock back to some point in the past (back a decade or more is possible)
09:15 dispatch interval
The 09:15 dispatch interval covers the time period 09:10 to 09:15 (NEM time) and so fully pre-dates any of the disruption as far as we are aware at this point in time.
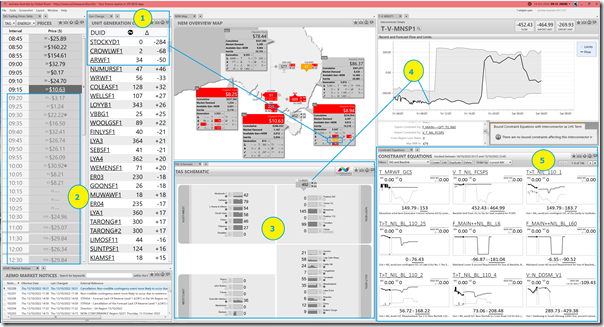
Here’s a snapshot from ez2view, focused specifically on the TAS region and Time-Travelled back* to the 09:15 dispatch interval:
* Readers should remember that ez2view shows End-of-Interval ‘FinalMW’ values in several widgets (including the GenChange, NEM Map and the Schematic widgets, shown here) when in Time Travel.
With respect to the annotations on the image:
1) We see a large drop in output from three wind farms in Victoria (Stockyard Hill, Crowlands and Ararat) for reasons I have not explored, which has contributed to the coloured alert for large change in the VIC Wind aggregate on the ‘NEM Map’ widget;
2) We see the expectation is that prices will be quite low in TAS for the next hour, and then negative in the P30 forecasts that are visible in this window.
3) In the TAS Schematic we can see which units are running (including Musselroe Wind Farm running close to flat out) and which units are not.
4) We can see Basslink importing a target of 452MW from Victoria, and the forecast that this would continue through until the evening.
5) In the ‘Constraint Equations’ widget, we’ve filtered it just to look at constraints covering Tasmania or Basslink.
09:20 dispatch interval
In contrast with the above, the 09:20 dispatch interval straddles the event – meaning:
(a) some data points (like InitialMW, Spot Price, Targets and measures like ‘Total Demand’ (which we refer to as Market Demand)) are all produced at the start of the Dispatch Interval … i.e. at or around 09:15.
(b) whereas some data (like FinalMW) will show the actual conditions at the end of the period, so after the major drop in frequency noted above.
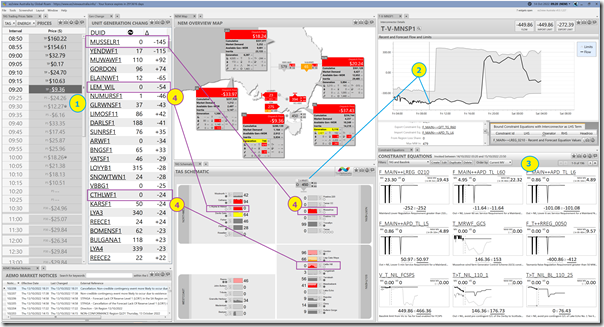
So if we step forward five minutes in the same ez2view window, we see a number of developments:
With respect to the annotations:
1) Price in TAS, and expectations into predispatch, are much the same as five minutes beforehand.
2) The same for the dispatch target flow on Basslink
3) Also the same for constraint equations relevant to the Tasmanian region (though we do note now that there are four FCAS-related constraints that are bound).
4) In contrast, we see that there’s been some big changes in FinalMW metered for TAS generators at ~09:20, so about a minute after the frequency drop:
(a) We see several units appear to have tripped”:
i. Musselroe Wind Farm has dropped 145MW to 0MW, and seems clearly a trip;
ii. Lemonthymne-Wilmot has dropped 54MW to 0MW, and also seems clearly a trip;
iii. It’s not as clear with Cattle Hill Wind Farm, which is down 24MW to 0MW, because it was on low output in any case and trending down the past hour or so.
iv. Interesting if they are trips at both Musselroe and Cattle Hill that Granville Harbour and Woolnorth appear to have continued operating.
(b) Remembering that AEMO noted that there was a sizeable (i.e. 530MW) drop in consumption in the TAS region triggered by the transmission lines being down, we do see that some hydro generators have ramped up to help make up some of the lost energy from some generators being tripped (as shown) and Basslink also tripped (not yet visible in the above):
i. Gordon is up +74MW to 96MW
ii. Reece is up +46MW to 46MW across 2 units
iii. Meadowbank is up 7MW to 41MW
iv. and so on…
So we reach the end of this dispatch interval, knowing the event has already occurred and that the next NEMDE run (i.e. for 09:25) should more fully take into account its effect….
09:25 dispatch interval
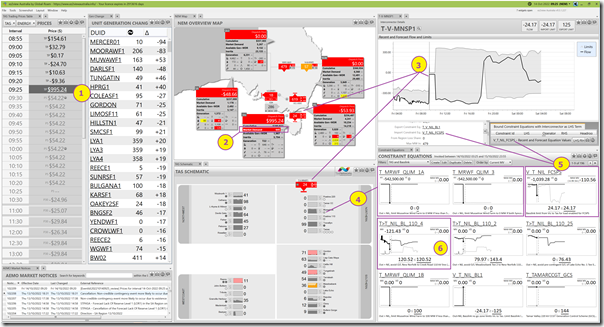
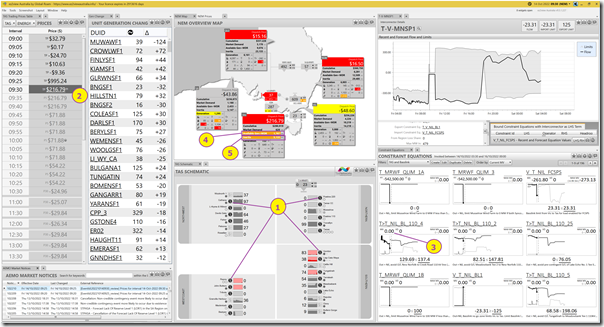
…. as such, the 09:25 dispatch interval looks quite different:
With respect to the annotations:
1) The TAS dispatch price has spiked to $995.24/MWh … and the P5 predispatch forecasts have shifted upwards somewhat:
(a) though not yet the P30 predispatch;
(b) keep in mind that it’s too early for anyone to have rebid on the basis of the system disturbance, so we need to wait another 5 minutes to see;
(c) incidentally, because the price is below my $1,000/MWh set point, it was not the one that alerted me to the event.
2) We see that the Market Demand has dropped down to 645MW:
(a) A drop of 519 MW
(b) From the level of 1,164 MW at the 09:20 dispatch interval above.
3) We also see that imports from VIC have dropped severely but not entirely disappeared:
(a) Noting that this is reading the target flow;
(b) Which is down to -24MW.
PS1 ~21:00 on Sunday 16th October
An early reader has pointed out that, whilst the Target Flow on T-V-MNSP1 (Basslink) suggests that there is still some small import to TAS being considered within NEMDE, the Metered Flow is down at 0MW in the 09:25 dispatch interval (reinforcing that the interconnector has tripped).
4) We also see two different constraint equations now limiting the output of Musselroe to 0MW;
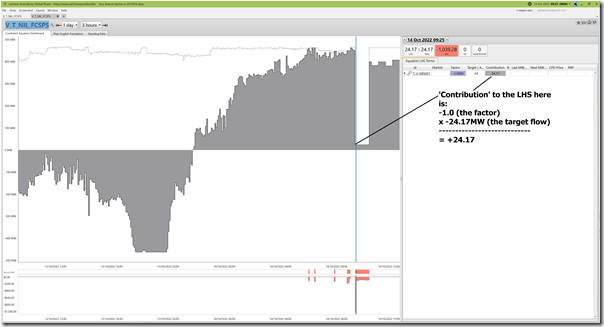
5) We see that the ‘V_T_NIL_FCSPS’ constraint equation:
(a) has bound with a significant Marginal Value; and
(b) is also setting the import limit on Basslink;
(c) It has the following description:
‘Basslink limit from Vic to Tas for load enabled for FCSPS’
… noting that FCSPS refers to a Frequency Control System Protection Scheme.
————————
With the new ‘Constraint Dashboard’ widget newly released in ez2view v9.5, I thought I would have more of a look at this one:
————————
6) Finally, we also flag that the ‘T>T_NIL_BL_110_4’ is bound:
(a) This constraint has the following description:
‘Out = Nil, avoid O/L New Norfolk to Creek Road 110 kV line (flow to South) on trip of New Norfolk to Chapel St 110 kV line, feedback’
(b) It has more than a single term on the LHS:
————————
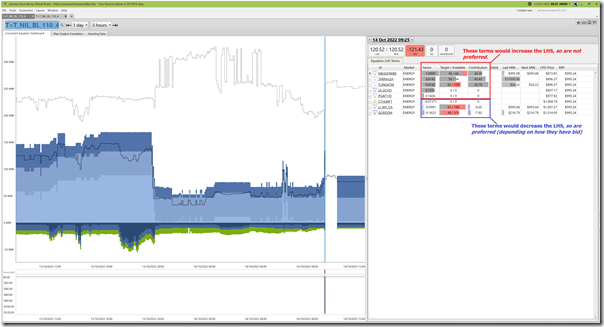
The equation above was not too complicated (at least in terms of the LHS) so we’ll take the ‘Constraint Dashboard’ widget for a test drive again on this constraint:
This is quite a detailed widget that shows many different dimensions of data (contact us if you want to learn more), so I won’t explain everything but will point out:
1) There’s been a significant drop in the RHS and increase in the LHS in the 09:25 dispatch interval.
2) Because it’s bound, it is trying:
(a) to ‘constrain down’ those terms that would increase the LHS; and/or
(b) to ‘constrain up’ those terms that would decrease the LHS.
…. with the individual effect per DUID seen in the ‘CPD Price’ for each unit.
3) We can also see how they actually bid, in terms of:
(a) ‘Last MW dispatched at…’; and
(b) ‘Next MW dispatched at…’
4) Incidentally, with respect to my question about Cattle Hill Wind Farm above, we can see that this particular constraint equation would like to see more output from it … but its target is still 0MW, suggesting some other reason why it’s offline.
————————
So the 09:25 dispatch interval is where we see the effects of the system disturbance start to play out in NEMDE outcomes …
09:30 dispatch interval
… let’s step into the 09:30 dispatch interval to see what else we can see:
With respect to the annotations:
1) Plenty of ‘$’ symbols for Tassie units:
(a) Denoting changes in bid for this dispatch interval
(b) Which is not really a surprise …
(i) as we’d noted that Hydro Tasmania had deployed something like an auto-bidder* in Appendix 22 within GenInsights21
* one of more than a dozen different forms of technology assisted bidding we identified in the GenInsights21 report.
(ii) and have just been taking a look at the nature of bidding one year on from 5MS as part of GenInsights Quarterly Update for Q3 2022
2) As a result of these, the price has dropped from the 09:25 dispatch interval price, but the P5 forecasts are up.
3) The ‘T>T_NIL_BL_110_4’ constraint equation is no longer bound.s
4) We see that the Available Generation in the TAS region has dropped (in part because of the units noted as tripped above).
5) Related to this, the level of instantaneous inertia* in the TAS region has also dropped.
* another enhancement with the ez2view v9.5 upgrade.
09:35 dispatch interval
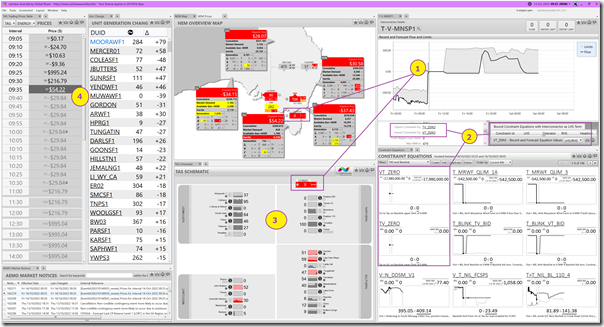
We’ll step forward another five minutes (to 09:35), but this is as far as we will go in this initial review of the sequence of events:
With respect to the annotations:
1) This is the first dispatch interval where target flow on Basslink is down at 0MW
2) Coincidentally, both the import and export limits on Basslink have been now set to 0MW by the two constraint equations shown, which are members of the ‘I-BL_ZERO’ Constraint Set.
PS2 ~21:00 on Sunday 16th October
Worth noting that the ‘I-BL_ZERO’ Constraint Set was only invoked from 09:35 … so perhaps manually invoked (with a short delay) following the trip of the Basslink interconnector.
3) Plenty of new bids from Hydro Tasmania for the units around the state.
4) The dispatch price is $54.22/MWh but the P5 predispatch forecasts are now for negative prices again…
(C) More to come later…
We’ll leave it here for now, but will look to come back to this at some point in the future (and will also look out for more official documentation from AEMO or TasNetworks on the incident).
1) Keep in mind with the above to 09:35:
(a) is still before the 09:42 publication of Market Notice 102213 about ‘Non-credible contingency event – Tas region – 14/10/2022’; and
(b) is also several dispatch intervals before the price spikes above $1,000/MWh began in the TAS region …. i.e. from the 10:10 dispatch interval to $1,835.31/MWh.
2) So there is plenty more to look at later…
That’s all for now.


This will indeed be a very interesting incident report to read when it eventually appears more for the things that went right. It would appear Tassie had a very real “near death” experience. The simultaneous loss of what really is the backbone of its North / South bulk transmission system must have come very close to causing separation of the island into two parts. The line faults themselves (let me guess, a double circuit tower line) will have cause a voltage depression and hence loss of some load instantly, but clearly a major automatic underfrequency load shed has occurred probably as a result of the loss of the significant Basslink input to Tassie. It appears that the Hydro machines rode through and responded under governor action as intended (primary response). Hydro units by their physics will immediately reduce export power (accelerating the water mass in the runner) for an increase governor response hence perhaps the small decrease in frequency after the UFLS recovery but then got on with it. Nice job! Must have been a bit hairy for the operators I suspect.
Andrew, I agree that the system did well to survive what was reported to be a tower failure (due to landslip?) on the main N-S 220kV double circuit line. The large scale load shedding may have been primarily operation of the FCSPS which trips specific large loads on trip of Basslink when importing (rather than frequency-driven), but may have involved some UFLS as well. Allan.