In the last two weeks I’ve written about solar farm revenues in the NEM in 2020, first considering AEMO spot market revenue, then adding in an estimate of LGC revenues. Today I’m sharing another graph from my presentation at the Clean Energy Council’s Large-Scale Solar Forum on the topic “Exploring the market performance of large-scale solar farms across the NEM in 2020” on 11th March 2021. This graph looks at the variation in Frequency Control Ancillary Services (FCAS) costs across solar farms in the NEM in 2020. There’s an equivalent graph for wind here.
FCAS services are sourced in the market in real-time by AEMO to ensure power system security, as explained in Jonathon Dyson’s widely read WattClarity article “Let’s talk about FCAS”. Jonathon took a detailed look at FCAS costs in 2019 across the NEM early last year, following the release of the Generator Statistical Digest 2019. Global-Roam and Greenview Strategic Consulting recently released the Generator Statistical Digest 2020 and the accompanying GSD2020 Data Extract which include monthly cost estimates for contingency and regulation FCAS for each DUID (dispatchable unit) in the NEM in 2020. The figures presented here are based on data in the GSD.
AEMO makes payments to providers of FCAS services (who may be generators, loads or ancillary service providers such as virtual power plants) based on the service quantity enabled in MW and the spot price of the service. In normal operation these services are sourced from any region in the NEM, but this can change if regions are isolated or the interconnections are at limit. The pool of costs is then recovered by AEMO from market participants through a complex process that is very different between the two types of services – Regulation and Contingency. The different cost-recovery mechanisms result in different approaches a participant can take to reduce their FCAS costs.
Eagle-eyed readers may have noted today’s date. AEMO’s document explaining how the FCAS cost recovery process works is almost an April Fool’s Day joke in itself – “surely you’re joking that it’s this complicated!” … “no, actually this is just the overview …”
Regulation FCAS is recovered by AEMO from generators and loads using a causer-pays methodology, applied across portfolios. Causer-pays factors by portfolio are calculated every 4 weeks based on the deviation of each member DUID’s output from its dispatch target and a measure related to system frequency. This factor (published here) defines the share of the cost pool for that portfolio. We’ve taken into account a few complexities in our calculations of a regulation FCAS cost estimate per DUID:
- In most dispatch intervals the cost pool (calculated from the FCAS constraints binding in that interval) is spread across the NEM, but there are some FCAS constraints that apply only to specific regions, as we’ll see in the numbers for SA.
- AEMO made settlement adjustments during the year to rectify an error in a small number of intervals (some very high price) that saw costs allocated to regulation FCAS that should have been to 5-minute contingency FCAS. AEMO also made settlement adjustments to claw back payment for FCAS services not provided, which we haven’t accounted for in the GSD.
- Causer-pays factors are defined by portfolio, not DUID. We’ve defined a methodology based on AEMO’s reported individual FCAS Settlement Factors to allocate a portfolio’s costs across its DUIDs, which is our estimation only and may not match the methodology used by the portfolio’s members.
As the causer-pays factor is applied many weeks in arrears, there’s nothing a participant can do at the time of high regulation FCAS prices to change the costs incurred. In the longer term, a participant may reduce its FCAS costs by improving the accuracy with which it follows its dispatch target (for example, using self-forecasting), or by forming a portfolio with participants such as thermal plants or batteries to try to cancel out some of the causer-pays factor.
Contingency FCAS is recovered from generators and loads in proportion to their share of generation or consumption in each trading interval. Generators pay for the Raise services and loads for the Lower services. Again, there are a few complexities we considered:
- Like Regulation FCAS, in most intervals the FCAS constraints apply across the NEM, and so the allocation is as a proportion of NEM generation. There are some periods (such as in SA in February 2020) where there were contingency FCAS constraints invoked specifically in SA, so the allocation to SA generators was as a proportion of SA generation only.
- AEMO’s settlement adjustments described above moved additional costs into the 5-minute contingency FCAS pool.
- AEMO’s split of costs by generation is done using revenue metering data, which is confidential. We’ve used the publicly available SCADA snapshot (DISPATCH_UNIT_SCADA table in the MMS) to estimate the generation.
As the contingency FCAS costs are allocated based on generation within a trading interval, a generator may reduce its exposure to very high FCAS prices by reducing its generation at the time. It’s possible to estimate an FCAS cost for each MW of generation that a generator can use to calculate a break-even bid price, which if high enough will see it dispatched down or off by AEMO.
We calculated an estimate of both regulation and contingency costs by DUID by month for 2020 in the Generator Statistical Digest 2020, which I’ve summed here into a total annual figure.
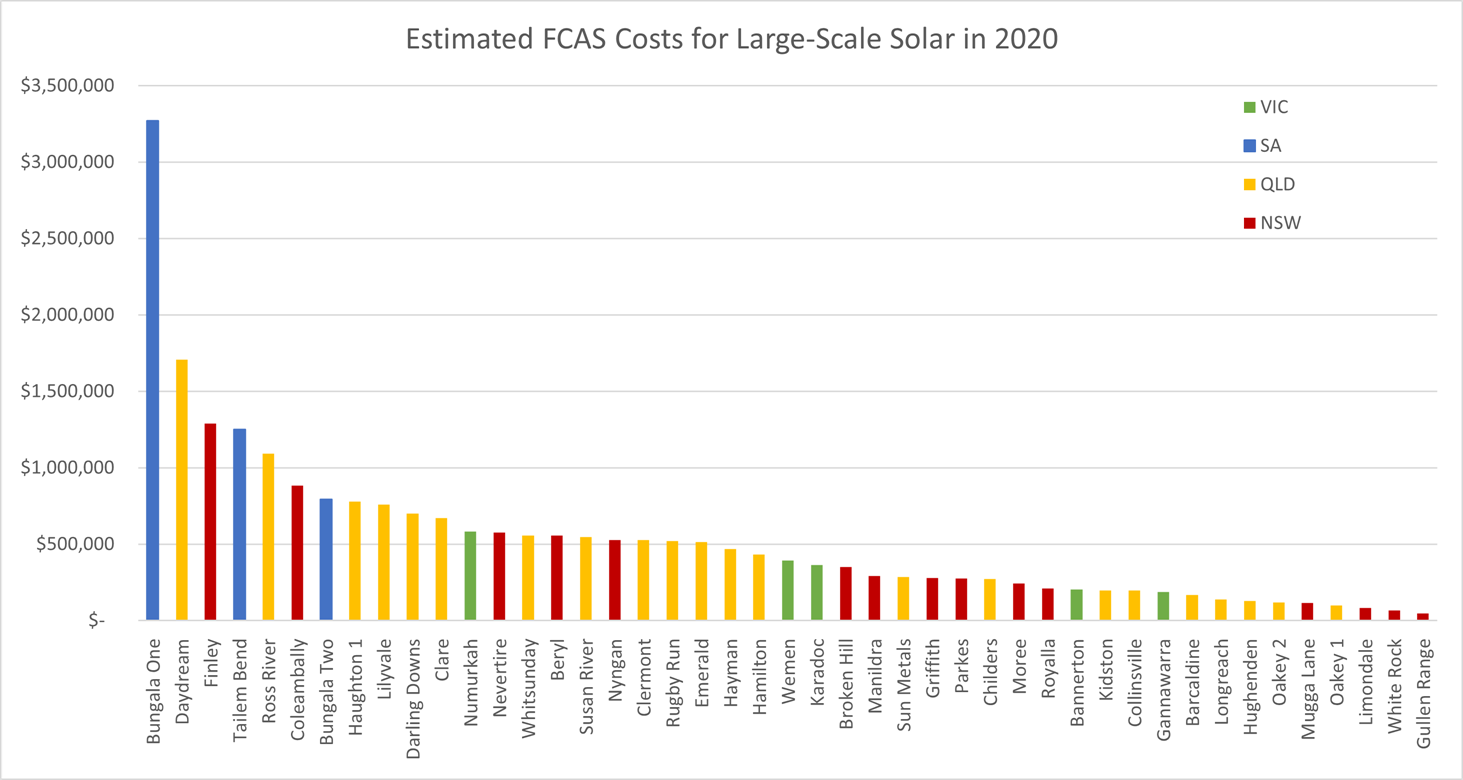
First, a look at the raw numbers:
This is not a typo – yes, we estimated that Bungala 1 solar farm in SA incurred in total $3.3M of FCAS charges in 2020. Much of this was contingency raise costs (and some regulation costs) incurred during the extended separation of SA and VIC in February and March. The similarly-sized Tailem Bend incurred smaller costs as it (along with many wind farms) was not running during extreme FCAS contingency prices. Allan O’Neil took a detailed look at this period of extreme FCAS costs here.
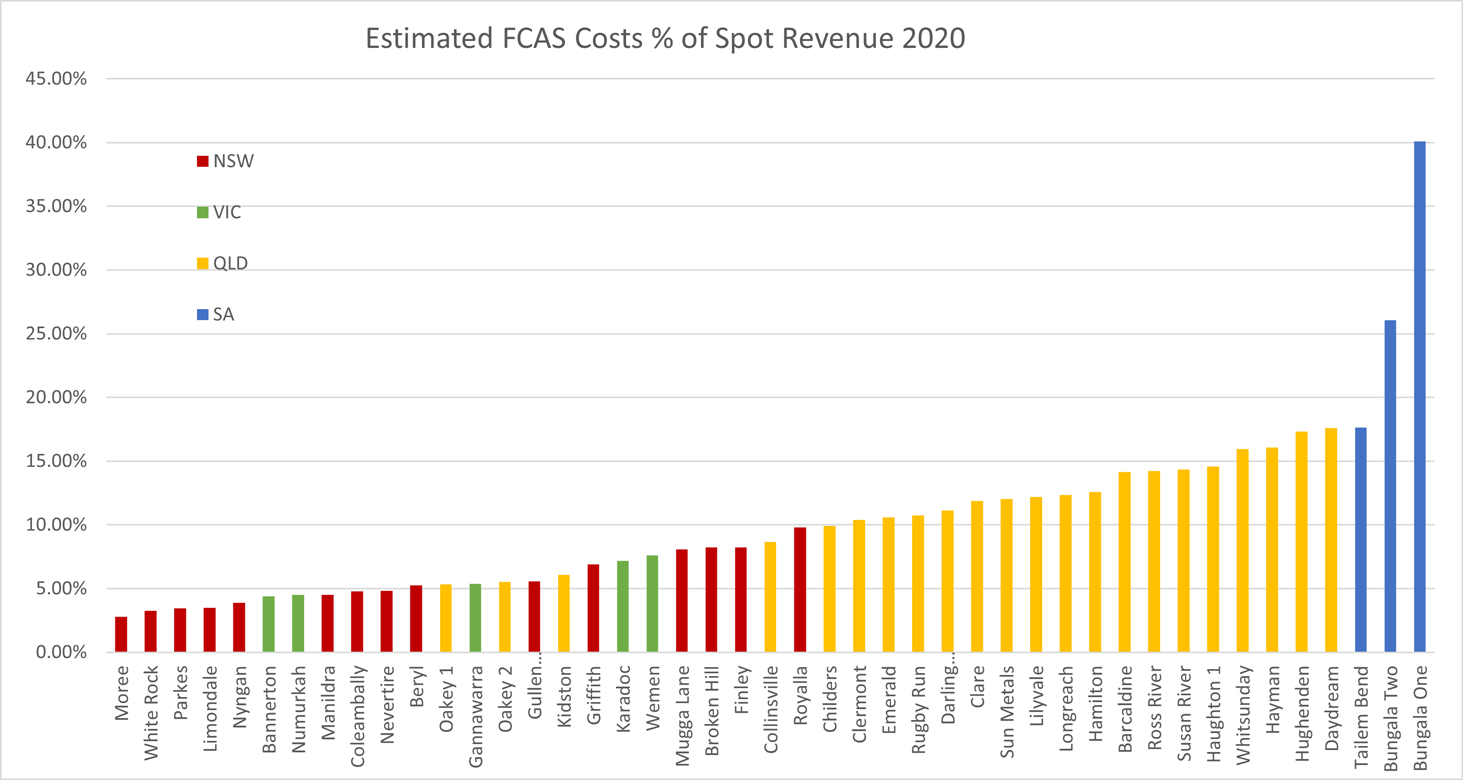
A more interesting plot is to compare the proportion of FCAS costs to AEMO spot revenue. This shows how much of the participant’s spot energy revenue they handed straight back to AEMO. Have a look at this article for a comparison of spot revenue at solar farms in 2020.
It’s not a surprise that the SA farms did the worst here, given the extreme regulation and contingency FCAS prices faced in the region during the extended separation early in the year. For Bungala 1 that’s 40% of the year’s spot revenue spent on FCAS costs! Overall, we can see the NSW solar farms doing better than the QLD farms, which makes sense given the denominator (revenue) is larger for the NSW farms. The range is from about 3% of spot revenue up to 17% across the NSW, VIC and QLD farms. There’s still a lot of variation in the QLD farms, with Daydream, Whitsunday and Hayman standing out as having relatively good spot revenue, but still having more than 15% of this spent on FCAS. These three have each enabled self-forecasting at some point in 2020, so they might show better regulation FCAS performance next year.


Leave a comment