We noted yesterday about ‘Low wind production on Monday morning 15th April 2024’, and I’ve seen others talking about it in various channels on social media as well.
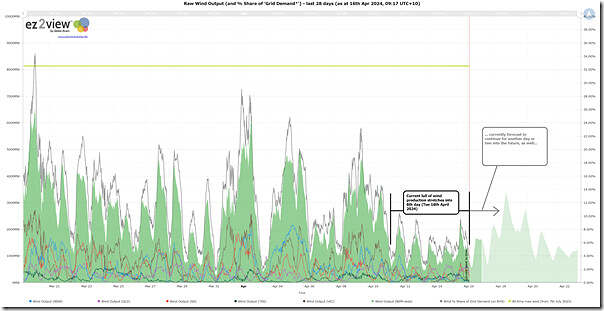
It’s worth a follow-on article a day later with a snapshot of this live updating 28-day trend of aggregate wind production across the NEM to highlight the duration of this current lull in aggregate wind harvest:
Those with their own licence to the ez2view software can open their own copy of these live updating trend here.
Almost 7 days under 10% of Grid Demand
Readers will understand that (except for the absolute extremes) it’s a bit arbitrary to declare what’s a period of ‘low wind’ (or a period of ‘high wind’, as well) … but in this case we can see a stretch where aggregate wind production has been under 10.5% of Grid Demand for a prolonged stretch that has now well into its 6th day.
… surely that qualifies!
To see some long-range trends of wind production statistics, see this growing collection of articles.
Still some days to run, also …
On the right of the chart is the AEMO’s forecast UIGF for Wind Production, which shows that this wind lull has a few days left to run, as well.
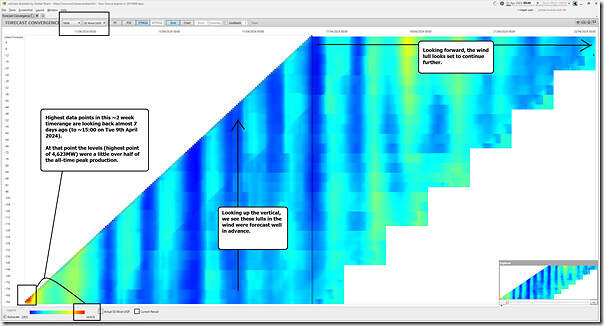
To see more detail about this stretch of low wind, I’ve opened up the ‘Forecast Convergence’ widget within our installed ez2view software and filtered down to UIGF Wind on a NEM-wide basis:
Frequent readers here (and those with their own licence to the ez2view software so they can use this widget) will remember this allows one to ‘look up a vertical’ in order to see ‘that other dimension of time’ .
The colour scaling here is set on a dynamic basis, with the highest point in the grid being back almost a full week ago (i.e. ~15:00 on Tuesday 9th April 2024):
1) In the (almost) 7 days that have followed, to date, we see that:
(a) The diagonal shows a prolonged period of blue colours (signifying low wind);
(b) But thankfully we also see that these low points were forecast well in advance…
… so in the hypothetical future grid that’s heavy on wind and storage, such as we analysed in Appendix 27 within GenInsights21, you’d at least have had some forewarning to stock away what energy reserves you had available to be drawn down through this period.
2) Unfortunately, we’re also seeing some pretty muted colours (i.e. low wind harvest) stretching out for another week into the future.
We’ll keep an eye on this…


“so in the hypothetical future grid that’s heavy on wind and storage, such as we analysed in Appendix 27 within GenInsights21, you’d at least have had some forewarning to stock away what energy reserves you had available to be drawn down through this period”
Sadly the amount of storage you would need to cover even a whole day of low wind is astronomical in cost, and if you can’t recharge it because of low wind then each successive day it gets harder and harder to keep the lights on.
Nothing to see here I suggest. Well described by David Leitch “Seasonality and deep storage in a highly decarbonized NEM” published on your web site Sept 10 2020, and seasonally highly predictable. Have a look at some of the modelling work done by Geoff Bongers et al from Gamma Energy on the NEM. Basically says the same thing. You cannot sensibly afford enough storage to get through these doldrum periods. Perhaps you could get Messer’s Bowen, Albanese and Bandt to start reading some of this material. They might learn something!
Thanks heaps Paul
April to June is a common time for slow moving highs to sit over SE Aus bringing very stable (and rather pleasant) weather. And it is astonishing how widespread such conditions are: from the Eyre Peninsula to north NSW and down to Tas. Also affects offshore wind around the 4 SE states. Geographic diversity of assets within this huge area doesn’t help.
You will however find solar was somewhat increased during this period compared to the week before, which is to be expected in this weather pattern. A silver lining to the non existant cloud, at least in daylight hours.
Thanks Ben
Here’s one dispatch interval in that time range that also had low solar:
https://wattclarity.com.au/articles/2024/04/13april-casestudy-low-vre/
(of course, close to sunset).
Paul