
In this article we will build on two prior articles:
1) On 5th May 2020 we posted “Balancing Supply and Demand … in the fast approaching ‘NEM 2.0’ world” in which we compared aggregate Raw Off-Target for an ‘all Wind’ grouping and compared it to results for ‘all Coal’ for all Dispatch Intervals in 2019.
2) Last week on Friday 24th July 2020 we posted “Striving to understand the underlying challenges with Semi-Scheduled generators (re AER Issues Paper)” in which we included some headline results for analysis we’d extended to:
(a) be aggregated across all Semi-Scheduled DUIDs (i.e. all Large Solar and most Wind units); and
(b) looked at how results trended over >10 years that the Semi-Scheduled category.
In this article I will expand on the results presented only in summary in that article.
(A) Approach used in the Number Crunching
Given that it is central to understanding what we’ve done, it seems useful to recap on the approach we used for the analysis:
(A1) Reminder about aggregate Raw Off-Target
In this article in May I presented this diagram to help explain how ‘Raw Off-Target’ is a metric that is derived by AEMO (we just gave it that name) en-route to operating their Conformance Status processes.

Please be clear that an extreme result for Raw Off-Target in one dispatch interval is not synonymous with being declared as ‘Non-Conforming’ by the AEMO (this is especially the case for Semi-Scheduled plant because of the general ‘Adjustments’ for all units – and some additional ones made for Semi-Scheduled units).
Also note that ‘Non-Conforming’ according to the AEMO is not exactly the same as ‘Non-Compliant‘ at the AER.
I also used this diagram to illustrate how to create a time-series of ‘aggregate Raw Off-Target’ for a particular group of DUIDs.

In May, we created an aggregation for ‘all Wind’ and a separate aggregation of ‘all Coal’ and compared/contrasted what we saw – but just for CAL 2019 with data already produced in ‘BEAST’ for the Generator Statistical Digest 2019.
(A2) The question about scalability
In that article I pondered what would happen in the years ahead to the distribution of outcomes in the following correlation view of aggregate Raw Off-Target against aggregate Dispatch Target – the question sketched into the following diagram:

The key question in terms of scalability is not so much about the x-axis spread (which is just a ‘simple’ function of installed capacity, ultimately) but moreso what would happen to the y-axis spread. The broader the spread of the y-axis:
1) The larger the ranges of ‘unexpected outcome’ the AEMO would have to manage with ‘keeping the lights on’ Services in those years ahead; and
2) The more difficult this would be – potentially involving more risk than the NEM currently sees; and
3) The higher the cost in management. If the shape of ‘unexpected outcome’ the AEMO might see were to be substantially larger, as a minimum the AEMO would need to procure a larger volume of Regulation FCAS – and perhaps Contingency FCAS as well.
(A3) Taking the question forward
Naturally, no-one can ‘know’ what the future has in store for us, but it seemed certain to me that we would be making the future a little easier to see if we took two key steps:
Step 1 = if we prepared a different aggregation – this time of ‘Raw Off-Target for all Semi-Scheduled Plant’ (i.e. all Wind and also all Solar); and also
Step 2 = analysed of the entire time range over which that the Semi-Scheduled plant have been active:
2a) This stretched as far back to 2009 – so providing over 10 years of sequential data, during which the installed capacity of Semi-Scheduled assets grew considerably
2b) We reasoned that, whilst we can’t see the future, at least we could gain some hints to what might be in store by looking at patterns that have emerged over the past 10 years
… assuming nothing significant changes with the Semi-Scheduled category (which is, of course, what the COAG Energy Council has asked the AER to consider, and which we’re all being consulted on as a result).
(A4) Other data sets
In parallel with doing the above we have also produced a range of other derived data sets, both with respect to ‘Raw Off-Target’ and also with respect to the derived ‘Conformance Status’. However time constraints have prohibited our analysis of all of them – and this article is probably long enough anyway – so we’ll have to leave them to a subsequent article or three.
(A5) A reminder of our focus, in this particular question
Worth also reminding readers what I noted in Friday’s article in that our focus in this particular line of analysis is the ‘bucket’ of challenge relating just to Semi-Scheduled units, and just to the current Dispatch Interval timeframe:
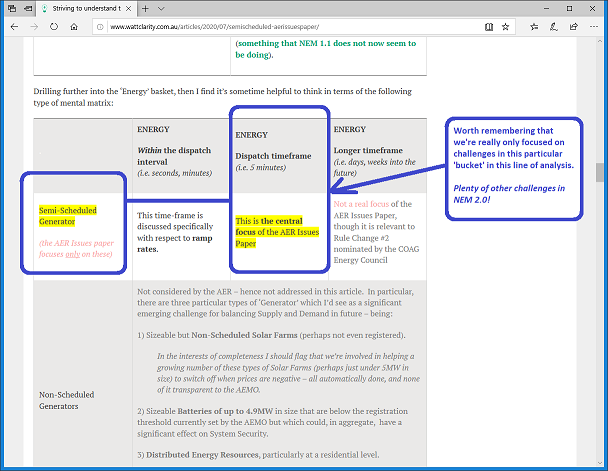
Plenty of other challenges that also need to be tackled to make NEM 2.0 work properly!
(B) Headline results
In the article last week we presented the following distribution of incidence in ‘buckets’ of increasing severity out to the sides of the chart. To create this trended distribution, what I did was as follows:
Step 1 = I mapped the aggregate Raw Off-Target figure in every dispatch interval to the aggregate Maximum Capacity (i.e. MaxCap) in that same dispatch interval;
Step 2 = then rounded up the aggregate Maximum Capacity to the nearest 1000MW in order to produce 9 groups of outcomes:
… note that this created 9 groups each with a different number of entries. Because the growth in capacity has accelerated more recently, the 8000MW ‘bucket’ has far fewer entries than the 2000MW bucket (for instance).
Step 3 = with each of these 9 groups, I individually distributed the outcomes in the buckets shown in the x-axis of the chart above. It is the deviations shown furthest from the middle of the chart that are the largest (in MW) but also the least frequent (in count of Dispatch Intervals).
Step 4 = to normalise these 9 groups, I then divided the incidence in a sub-bucket (i.e. # DIs) by the total number of DIs in that MaxCap Range and showed that as a percentage.
Step 5 = I plotted as this chart with a log scale on the y-axis to make the small percentage numbers (low absolute number, but still quite significant) still visible.
(click on the chart to open in larger view)

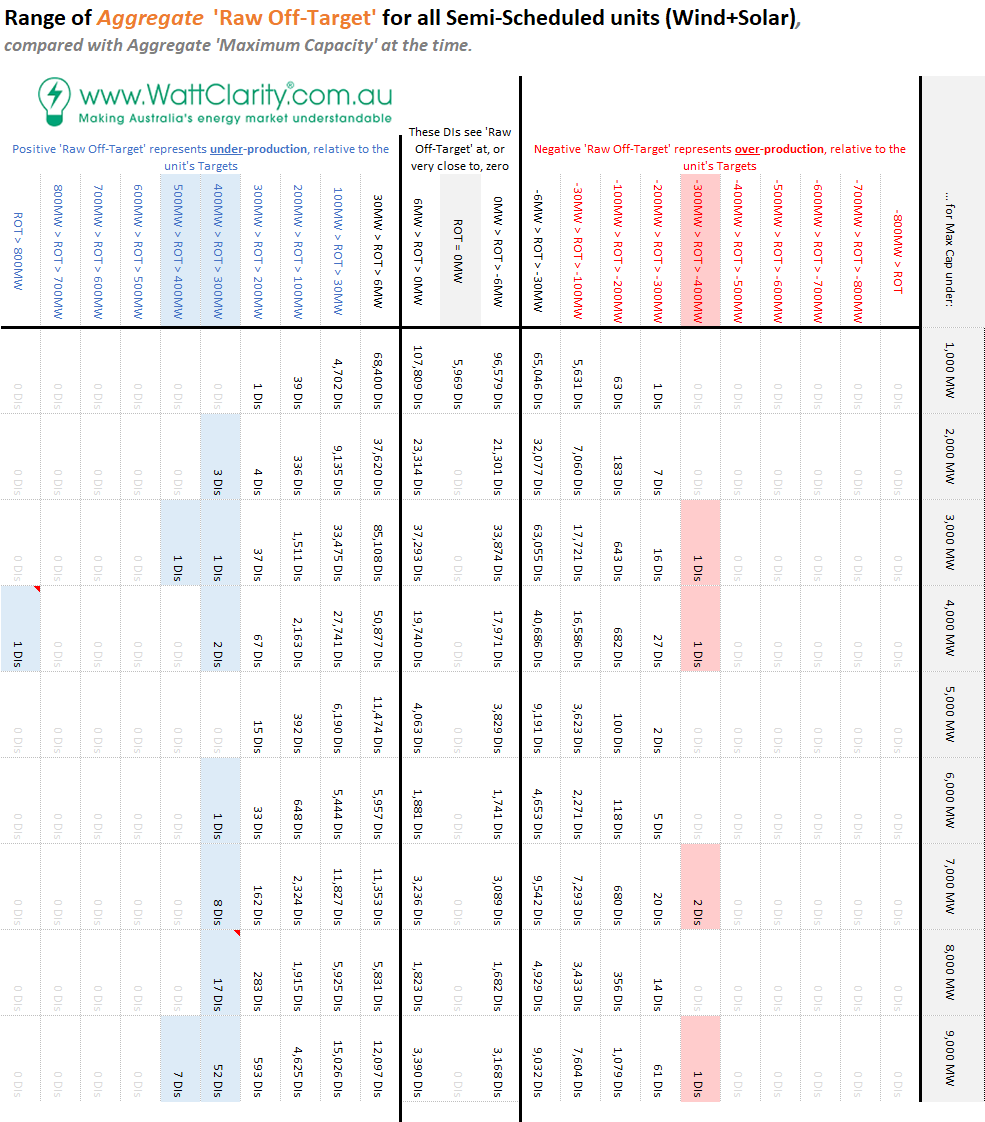
Step 6 = A tabular view of the same data is presented below
… note that I’ve not normalised the table in order that you can see how many individual Dispatch Intervals were featured in each of the ‘buckets’.
Step 7 = I’ve highlighted the buckets featuring incidences where there were either:
7a) Only 5 dispatch intervals in total, over >10 years, where the aggregate level of over-generation was more than 300MW above the aggregate Target across all the DUIDs; and
7b) A total of 93 dispatch intervals in total where the aggregate level of under-generation was more than 300MW above the aggregate Target across all the DUIDs; and
(Click on the image for a larger view)
Step 8 = Each of these 98 instances are individually listed in a table at the bottom of this article
Step 9 = As time permits, we’ll be seeking to individually investigate each of the 98 instances, publishing what we find in specific Case Studies in the weeks or months ahead (you might understand that this will take some time in between our other commitments).
Restating the main observations that can be made from the chart and table above:
Observation #1) We see higher incidence on the left-hand side of the chart (i.e. under-generation) than on the right (i.e. over-generation).
#1a) In other words, under-generation is more common than over-generation, in aggregate across all Semi-Scheduled units;
#1b) This pattern is the same in every MaxCap Range.
Observation #2) We see that the distribution of outcomes is diverging as the installed capacity is growing.
#2a) To be clear, this happened through 2019 even though we now have 80 separate wind and solar DUIDs collectively feeding into the grid.
#2b) Hence there will be an increasing number of ‘extreme’ outcomes as the installed capacity grows.
#2c) This is a key finding, which hints at my questions earlier about the scalability of the Semi-Scheduled category, the way it currently .
(B1) Diving in, to look at the Extremes
Looking further at the extremes, I’ve created the following set of trends to make it very clear what’s been happening:
(B1a) Where Aggregate Raw Off-Target was greater than 300MW
Looking just at the instances where the aggregate ‘Raw Off-Target’ was more than 300MW away from 0MW (i.e. where actual supply was under, or over, expected supply by that amount), we see the following trend:

Observation #3) There’s clearly been a significant escalation in these large deviations that is coincident with the installed capacity being above 7,000MW (though it is wise to remember that correlation does not necessarily mean causation).
The chart below shows the timing of all the dispatch intervals where the aggregate ‘Raw Off-Target’ metric was greater than 300MW in either direction – but mostly on the under-producing side (i.e. positive aggregate Raw Off-Target):

Observation #4) There’s been a significant jump of cases of extreme aggregate under-generation, since late in 2018. These extreme cases are explored further in section (C) below.
4a) There are 98 Dispatch Intervals plotted on this chart, of which 59 were >+300MW in CAL 2019 (i.e. when the installed capacity was greater).
4b) For the avoidance of doubt, data has not been crunched, yet, for CAL 2020. We’ll wait for the full year results to do this and avoid any seasonal skew, in conjunction with the GSD2020.
(B1b) Where Aggregate Raw Off-Target was greater than 200MW
Stepping the criteria down a notch, to look at deviations of more than 200MW, we see a chart that is of a similar pattern – with the main difference noticeable to me being that the percentages are 10x larger):

(B1c) Where Aggregate Raw Off-Target was greater than 100MW
Stepping the criteria down further, to look at deviations of more than 100MW, we again see a very similar pattern – and this time with another 10x change in percentage incidence:

It’s worth noting that a 10% incidence represents a significant number of occasions. The ‘9000MW group’ represents much less than a year in terms of dispatch intervals, because of the rapid growth in capacity, but it does reinforce questions we have been pondering about the emerging challenge as capacity grows.
Observation #5) The clear escalation in incidence of large deviation (no matter whether using a 100MW, 200MW or 300MW criteria for ‘extreme’) does reinforce the questions I have been pondering myself about the scalability of the Semi-Scheduled category, as a way of operating an ever-growing fleet of Solar and Wind farms into the future:
5a) In each case there are significantly more deviations of under-production than there are of over-production (i.e. it’s not just in the largest outliers);
5b) In each direction, we see uniformly that there is a trend to greater incidence of these large aggregate deviations
(B2) Extrapolating Forwards
With a significant amount of trepidation (because of my concerns about forecasts) I have drawn a crude extrapolation on the measured data to date to show what might emerge as the Semi-Scheduled category continues to scale (unless something significant changes):
![2020-07-22-RawOffTarget-AllSemiSched[2]](https://wattclarity.com.au/wp-content/uploads/2020/07/2020-07-22-RawOffTarget-AllSemiSched2.png "2020-07-22-RawOffTarget-AllSemiSched[2]")
Peak Operational Demand in the NEM varies each year, but is somewhere in the range 30,000MW to 35,000MW – hence I chose to scale the x-axis the way that it is. However we should remember:
Scenario 1) We will need to significantly over-build the capacity if we are going to be relying on a grid that is primarily Wind + Solar + Storage (i.e. at times production would be greater than what would otherwise be Underlying Consumption in order to provide headroom for injections into storage).
Scenario 2) The first scenario would need to be scaled up further (hence the catchy ‘700% Renewables’ branding) to provide capacity to pump into oversized energy storage to facilitate export.
Under both Scenario 1 and Scenario 2 it seems likely that the incidence of large deviations will increase (in absolute MW terms), and need to be managed somehow.
(C) Specific Dispatch Intervals where Agg ROT > 300MW
I’ve noted above the caution about ‘correlation not necessarily equating to causation’ – in other words, it might be there are some other reasons why the much greater incidence in large aggregate Raw Off-Target results is correlated with larger installed capacity of Semi-Scheduled units. Hence I am flagging here, but won’t have time to deliver in this article, the need to look into the detail of some specific events (via other Case Studies with the powerful ‘Time-Travel’ functionality in our ez2view software).
This table here showing all of the (98) dispatch intervals that saw aggregate Raw Off-Target results greater than 300MW, in either direction:
|
Year |
Specific Dispatch Intervals |
||||||||||||||||||||||||||||||||||||||||||||||||||||||||||||||||||||||||||||||||||||||||||||||
|
2013 |
There were only three dispatch intervals which saw aggregate Raw Off-Target above 300MW in that year:
|
||||||||||||||||||||||||||||||||||||||||||||||||||||||||||||||||||||||||||||||||||||||||||||||
|
2014 |
There was only a single dispatch interval above 300MW – in this instance it was +443MW on 15th October 2014 at 16:35 —– On Monday 3rd Aug 2020 I also explored the incident on 15th Oct 2014, concluding that there seemed to be some broader system event that led to all wind farms across VIC and SA under-performing (many significantly). Can you help us out by remembering what happened then? |
||||||||||||||||||||||||||||||||||||||||||||||||||||||||||||||||||||||||||||||||||||||||||||||
|
2015 |
There was only a single dispatch interval below -300MW. In this instance it was -314MW on 8th January 2015 at 04:30 (this was only 5 instances, in total, of over-production larger than 300MW). —– This ‘first of five’ (rare) instances of over-performance was explored in this article published Wednesday 5th August 2020. Can you help us understand more? |
||||||||||||||||||||||||||||||||||||||||||||||||||||||||||||||||||||||||||||||||||||||||||||||
|
2016 |
There were only three dispatch intervals which saw aggregate Raw Off-Target above 300MW in the 2016 calendar year:
|
||||||||||||||||||||||||||||||||||||||||||||||||||||||||||||||||||||||||||||||||||||||||||||||
|
2017 |
There were only two dispatch intervals which saw aggregate Raw Off-Target above 300MW in the 2017 calendar year:
|
||||||||||||||||||||||||||||||||||||||||||||||||||||||||||||||||||||||||||||||||||||||||||||||
|
2018 |
There were only five days in which there were aggregate Raw Off-Target above 300MW in the 2018 calendar year (9 dispatch intervals in total, with 5 being on one day):
|
||||||||||||||||||||||||||||||||||||||||||||||||||||||||||||||||||||||||||||||||||||||||||||||
|
2019 |
For reasons yet to be confirmed (but which I suspect are related, at least in part, to the growth in installed capacity) there was a large increase in number of dispatch intervals in this calendar year – up to 79 dispatch intervals (across 45 days, with some days flagged in particular):
I will be very interested to get to the bottom of understanding why such a large increase in extreme cases in calendar 2019… and if you would like to help us with that, please let us know! |
||||||||||||||||||||||||||||||||||||||||||||||||||||||||||||||||||||||||||||||||||||||||||||||
|
2020 |
Data was not crunched for 2020 (we only used what had been done leading into the preparation of the GSD2019). |
The table above gives us something to particularly focus on, in terms of ongoing analysis….
(D) Key questions to answer
…. there are 98 discrete dispatch intervals identified above (or 99 if you could 31st Oct 2019 where ‘all Wind’ was ‘worst’). It seems important to re-iterate what I noted in (E) last Friday – that we need to delve more into the detail to understand these key questions:
Q1) What the underlying causes of this increased divergence?
As Marcelle already noted in her article, it seems unlikely that most of these instances of under-production are related to responses during periods of negative prices.
Q2) Will this increasing divergence continue growing into the future?
As noted above, this seems quite likely – though the rate of growth seems much less certain.
Q3) What are the implications of this divergence continuing to increase in the years ahead?
3a) It would probably mean the need for procurement of greater volumes of Regulation FCAS, hence presumably higher aggregate cost.
3b) What other implications?
Q4) How do we improve this performance collectively?
We’re anticipating that, through the Case Studies we’re going to be conducting, we’ll see a clearer answer to Q1 and what follows from that – including what might be answers to Q4 (including an answer to my ongoing questions about the how far the Semi-Scheduled category can scale…)
Note that I have expanded the two questions from last week to be four questions today, to make Q2 more explicit – and to make it clear that we’re after Q4.
This is what we’ll be seeking to explore in the weeks and months that follow – probably involving:
Step 1 = some detailed Case Studies making particular use of the powerful Time-Travel functionality in ez2view to perform forensic analysis of particular Dispatch Intervals we’ve identified.
Step 2 = where we remember, we’ll update the table above with in-context links to the relevant Case Studies; and then
Step 3 = when we have done enough, we’ll loop back around and sum up what we’ve concluded (at least about the causes) in a summary article.
(E) Do you know of others who can help us?
Seems a timely point to ask this question again.
There are a number of reasons (including these two here) why we invest so much time in this analysis. We’re interested to hear from you if you know of other people who can help us in our efforts?
Leave a comment