On Sunday 14th May 2023 we posted some thoughts about how ‘We’re not building enough replacement dispatchable capacity’, utilising analysis prepared for GenInsights Quarterly Update for Q1 2023.
1) Since that time, we’ve received a fair number of compliments – and some constructive criticisms as well.
(a) Thanks for all of that!
(b) Amongst the compliments, there have been those people expressing gratitude for helping the reader to understand the required amount of dispatchable plant that will need to be built to replace the retirement of coal.
2) Independent of what we’ve been doing, I could not help but notice that organisations like the Australian Aluminium Council are raising their concerns about how there’s a growing shortage of firming capacity, such as here on LinkedIn:
Prompted in part by this feedback, but driven also by incessant curiosity, we took an opportunity in conjunction with the finalisation of GenInsights Quarterly Update for Q1 2023 (released today) to delve further into the numbers … now down to a daily basis over every year from January 2009 onwards. In this article we summarise this analysis.
(A) Reminders about this analysis
Let’s start by recapping what we’re analysing.
1) In the Generator Report Card 2018, we coined two terms to summarise the challenges we saw emerging in parallel an emerging schism between the two points of focus that were becoming increasingly polarised at the time we wrote the GRC2018, and have not really come together since that time:
(a) we used the term the term we termed as ‘Anytime/Anywhere Energy’ (Supply Service #1) whereby the incentives for their supply (e.g. via the RET and via most Renewable PPAs – in ) provided a uniform incentive on top of the spot market, regardless of the time or place of that energy’s production. Hence this covers the variable renewable energy components of Wind, Large Solar (Solar Farms registered with AEMO) and Small Solar (i.e. rooftop PV).
(b) a bunch of other services traditionally provided by electricity generators we collectively labelled ‘Keeping the Lights on’ Services (Supply Service #2) to differentiate these services (which, at times, seemed neglected or overlooked)
2) In our analysis here we’re focused on one particular aspect of these ‘Keeping the Lights on’ Services … being dispatchability. It’s worth remembering that (on the supply side of the electricity system) there are essentially four broad types of supply-side assets, both small and large:
| Scheduled | Semi-Scheduled | Non-Scheduled | Invisible |
|---|---|---|---|
|
The ‘Scheduled’ category of generator has existed since the start of the NEM. All DUIDs that are Scheduled are fully dispatchable, in that they have to meet their Targets at the end of each dispatch interval. Note that they can have energy limitations, as discussed in ‘the rise of ‘Just in Time’’. |
The ‘Semi-Scheduled’ category has been in existence in the NEM since 31st March 2009 in conjunction with the rise of the number of Wind Farms operating in the NEM. As the name suggests, these units are only partially dispatchable, in that: 1) If the Semi-Dispatch Cap is not set, they do not have to adhere to Targets at all; but 2) If the Semi-Dispatch Cap is set, the Target then acts more like a cap than a specific Target to be met. |
Non-Scheduled generators are large enough to register with the AEMO, some details of them are known, but they don’t participate in the dispatch process at all. They don’t receive, or have to follow, Targets. |
There are another group of generators that are invisible in real time, which is throwing up its own set of challenges. Since the start of the NEM there has always been some invisible generators (e.g. embedded generation on industrial sites) – however the size of this grouping is now growing rapidly: 1) Firstly as a result of the deployment of rooftop PV. 2) More recently there’s a growing amount of distributed storage (stationary and in EVs) that is also playing a role as an invisible source/sink of energy. |
3) In order to measure the amount of dispatchable plant required in the NEM, through GenInsights21 and now into GenInsights Quarterly Updates we’re tracking the metric ‘Aggregate Scheduled Target’ (which we abbreviate as ‘AggSchedTarget’):
(a) Each Scheduled, and Semi-Scheduled unit receives a Target from AEMO for each dispatch interval;
(b) Though as noted above the Target for Scheduled units receives special significance as it’s the one that actually indicates a requirement to deliver at that specified level;
(c) Hence aggregating these Targets together for all Scheduled plant provides one clear representation of the scale of requirement for fully dispatchable plant.
(d) Given that the energy transition is now over 20 years old, it should be the case that trending this requirement for AggSchedTarget should give us a good sense of how capacity is required for scheduled plant:
i. What’s changing over time, as we load in more ‘Anytime/Anywhere Energy’ ;
ii. But also what’s remaining the same (despite the gigawatts of wind and solar capacity that’s been added to the NEM in the last decade and more).
(e) It’s important to remember that this metric is technology neutral, because it can be supplied by any fully dispatchable plant – such as:
i. Old technologies (traditional thermal plant, and hydro)
ii. But also newer technologies (large-scale BESS discharge, Negawatts, fully scheduled hybrids in future and potentially VPPs (though none supply in the energy market yet)).
(f) Being a NEMwide metric, it’s also simpler as a high-level metric in that it defers any need to consider transmission congestion or losses (though obviously they will need to be considered before a transition plan could be considered feasible).
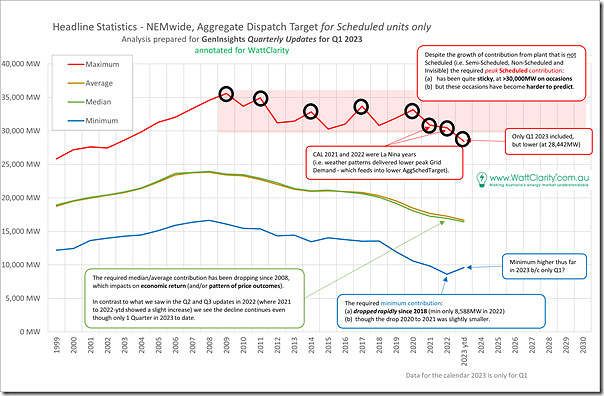
4) In GenInsights Quarterly Update for Q1 2023 we present the following trend of headline annual* statistics
* i.e. just for Q1 in 2023 given that’s all that had elapsed for the year.
You’ll note that the text in the image is slightly different than posted here on 14th May, as the wording has been tightened following this challenge from Allan O’Neil.
5) With respect to these trended annual statistics, we noted on 14th May that there were some key take-aways:
Trend 1 = the blue line at the bottom is the annual minimum level of AggShedTarget … and this has been dropping rapidly since 2018.
(a) readers should note that this is not quite the same as declining ‘minimum demand’, but shares a similar cause.
(b) this is low, and rapidly getting lower…. which points to challenges for other ‘keeping the lights on services’.
Trend 2 = in the middle we see that the average and median levels have been falling since around 2008
(a) which speaks to the steadily lower volume of energy being required of the Scheduled Plant that needs to remain in the system.
(b) … and hence the increased difficulty of making a commercial return for these plant especially if ‘high capex and low opex’ (like coal units and CCGT).
Trend 3 = at the top of the chart, however, is the red line, which is the annual maximum level of AggSchedTarget, which:
(a) remains stubbornly high; but
(b) is becoming increasingly difficult to predict due to the increased weather dependency of the grid at various levels.
6) It’s the red line that sets the required amount of dispatchable capacity, but it’s the yellow and green lines that point to the challenges of incentivising these to participate in the market:
(a) To remain in the market, for existing assets (albeit that there are other reasons why we want coal units to close); but also
(b) To enter the market, as new dispatchable plant considers entering the market to replace the exiting coal units.
The above trend was produced from a single time series of data (i.e. NEM-wide AggSchedTarget) for ~110,000 dispatch intervals in every year since the start of the NEM. But it’s what’s happened since 2009 that is of particular interest with respect to the energy transition. That’s already over 14 years of sequential time history.
(B) Daily Headline stats for all years from 2009 to 2022
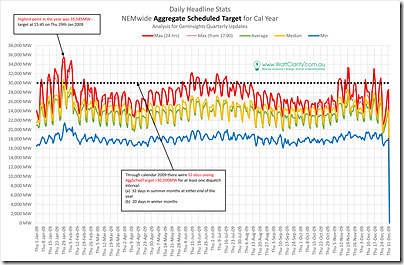
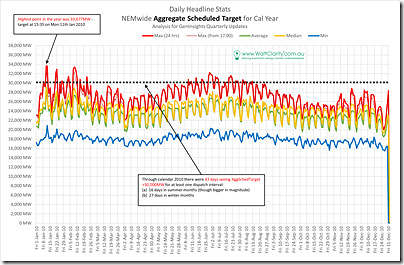
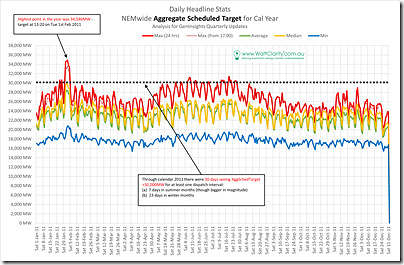
Using the same series of data, we broke it into days and years and present the same 4 headline statistics (i.e. i.e. Max, Median, Ave and Min) but on a daily basis for AggSchedTarget for all days in the year, with the highest point in the year highlighted:
1) Note that this is most often in summer;
2) But occasionally summer has been mild and the peak has been in winter.
Here’s the series of data…
| Year and Notes |
Illustration |
|---|---|
|
In this table, the images for each year (in the right column) will be smaller scale on your browser window. It is intended that you can gain a quick overview of overall patterns on a daily basis through all 14 years by quickly scrolling downwards. Clicking on any image will open a larger-resolution image in a new browser tab so you can read the annotations (which are, in some cases, additional to the Notes in the left column). |
|
|
2009 Remembering that this chart shows AggSchedTarget (and not Operational Demand or Market Demand), it’s important to remember that 2009 was the year when Operational Demand in the NEM peaked. From this point it began declining – for a range of reasons: 1) In October 2011 we wrote about ‘Some possible reasons why demand is declining’ – notably not rooftop PV; 2) Though obviously the accelerating rise of rooftop PV has become the primary reason in more recent years. It’s logical that a peak in Operational Demand was linked to a peak in AggSchedTarget. In 2009 we see that: 1) the required AggSchedTarget for the summer months (both at the start and end of the year) was higher than the winter months, 2) Peak AggSchedTarget in summer was: (a) At 15:45 in the afternoon (compare this with later times in years below); and (b) On Thursday 29th Jan 2009, which was the day after 28th January (when the NEM-wide peak demand record was set). 3) Also note that the trend of average/median lies closer to the MAX line than the MIN line (and see how this shifts as you scroll through the years below as we move from ‘baseload’ to ‘peaking’ operations). |
|
|
2010 In 2010 we see that: 1) the required AggSchedTarget for the summer months (at the start of the year, not the end) was higher than the winter months, 2) Peak AggSchedTarget was: (a) At 15:35 in the afternoon (compare this with later times in years below); and (b) On Monday 11th Jan 2010 (a day recorded here at the time). |
|
|
2011 Even as early as 2011 (more than a decade ago): 1) In Summer, we start to see a phenomenon of a small cluster of extreme days with a requirement thousands of megawatts higher than any other summer day. … on this chart the ‘max (from 17:00)’ line shows how the demand after 17:00 NEM time (i.e. when summer solar is still contributing, but at a much lower capacity factor) 2) In contrast in winter we see winter requirements continue to be much more uniform. |
|
|
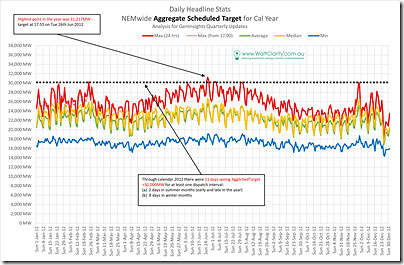
2012 In contrast to the years before, the summer periods were quite mild: 1) Only 2 summer days seeing AggSchedTarget >30,000MW. 2) But 8 days days in winter. |
|
|
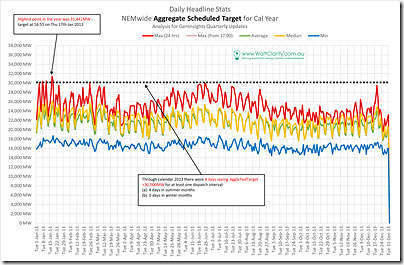
2013 A similar pattern to the year before: 1) Summer requirement for AggSchedTarget a little higher (so 4 days in summer months). 2) Winter requirement a little lower (so 0 days seeing >30GW, but a number of days quite close). |
|
|
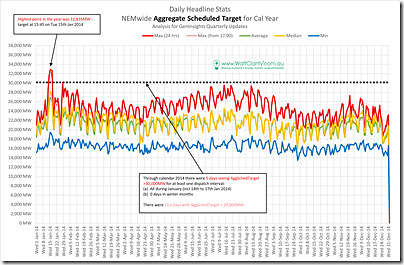
2014 Across the year: 1) There was a standout period in summer of several days duration that was ~3,000MW higher than any other period (see below that other years also show this characteristic). 2) Winter was much more consistent, with required dispatchable plant being just below 30GW on a number of occasions. |
|
|
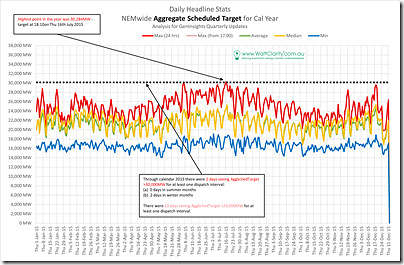
2015 Across the calendar 2015 year: 1) There were no days during summer with AggSchedTarget above 30,000MW: (a) and only 4 bursts above 28,000MW (b) highest day was 29,463MW on Friday 18th December 2015 (see below that this occurred at 17:00, but AggSchedTarget was above 28,000MW for more than 5 hours) (c) the second highest day was Thursday 17th December 2015 … we can see in this range of 14 years that it does not often happen that the high points in summer are before Christmas. 2) In winter there were two days seeing AggSchedTarget above 30,000MW – and another 9 days seeing AggSchedTarget above 29,000MW. |
|
|
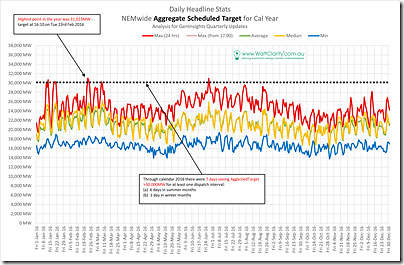
2016 Across the year, 7 days seeing AggSchedTarget > 30,000MW: 1) 6 days in summer months … with the highest day being Tue 23rd Feb 2016 (we posted this article on that day). 2) 1 day in winter … but several other days not far below. |
|
|
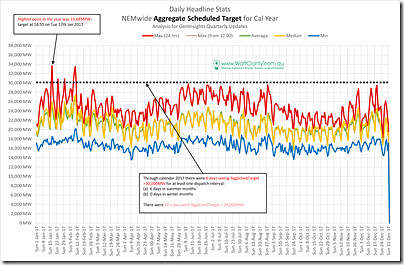
2017 Through calendar 2017 only 6 days seeing >30GW: 1) All 6 days in summer … including two spikes of considerable height: (a) Highest being on 17th Jan 2017 (33,685MW – on a day when NEMwide ‘Market Demand’ exceeded 34,000MW) (b) The other high point being Thu 9th Feb (32,421MW) and Fri 10th Feb 2017 (33,553MW – a day seeing a few articles, like this one). 2) No winter days … but 10 x winter days >29,000MW (+ 1 more in late May), shown below. |
|
|
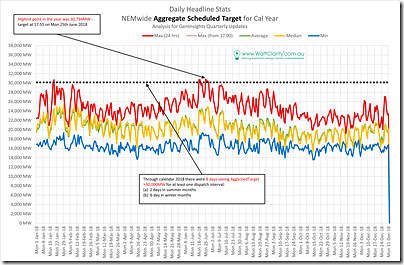
2018 With the 2018 calendar year: 1) Summer was milder than the prior year. … only 2 days >30GW (and even then only just) 2) 6 x winter days >30GW … including highest point on 25th June 2018. |
|
|
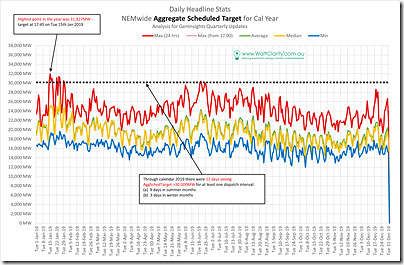
2019 Around 2019 we begin to see the Average and Median lines move closer to the Minimum Line than the Maximum Line. … this speaks to the growing challenge for financially supporting dispatchable plant – especially high capex plant that requires a higher capacity factor to be commercially viable. |
|
|
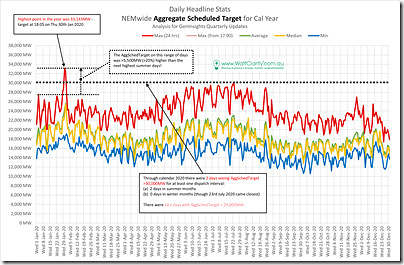
2020 There are two different stories in this year, by season: 1) In summer we see the cluster of extreme days around Thu 30th and Fri 31st Jan 2020: (a) That saw an extreme level of AggSchedTarget in absolute terms; (b) But which seems even more extreme when noting the peak level was over 5,500MW (i.e. more than 20%) higher than that required on any other summer day in the year 2) During winter there were no days exceeding 30,000MW – but there were a significant number of days not far below that level (which speaks to the greater level of consistency of requirement for AggSchedTarget during winter). |
|
|
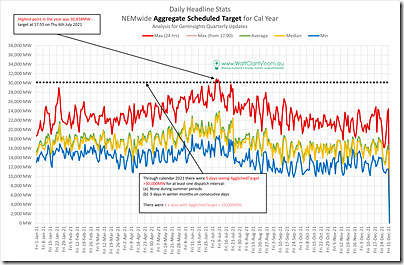
2021 This year was driven by La Nina (and also by COVID) effects. 1) There was only a single summer day spike that approached anywhere near 30,000MW. 2) But there were 5 consecutive winter days above 30,000MW – and a number of other days not far below. |
|
|
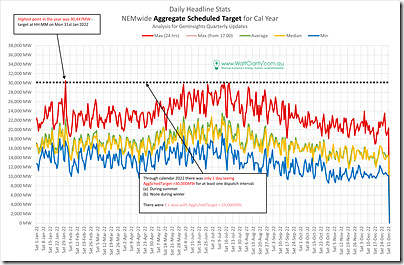
2022 The pattern for 2022 was quite similar to 2021 (and it also shared the same La Nina and COVID effects): 1) Only a single summer period anywhere near 30GW AggSchedTarget. 2) But many winter days with a high level. |
|
|
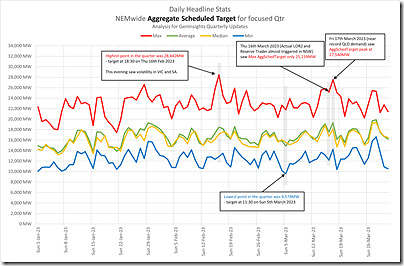
2023 For this analysis (linked to GenInsights Quarterly Update for Q1 2023), we’ve only analysed data to the end of Q1 2023. As such, we’ve not included a full-year view of capacity here (instead, we’ve just included here the report for Q1 directly out of the GenInsights report). There was not a day in the quarter that saw AggSchedTarget above 30,000MW … but this is not the first time in the past 15 years the same has happened (and we know Q1 2023 was affected by La Nina). So it’s not a surprise – and certainly should not be taken to imply that the requirement for >30,000MW of installed scheduled capacity has disappeared. |
|
We’ve invested the time in extracting and presenting daily date over 14 years in order to help readers better understand emerging patterns in relation to the market’s emerging requirement for aggregate dispatchable capacity. We’ll highlight some take-away observations at the bottom…
(C) Time-of-Day stats for all years from 2009 to 2022
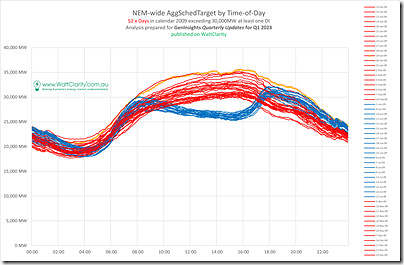
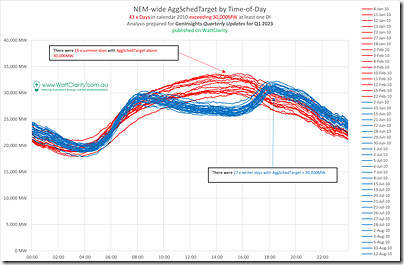
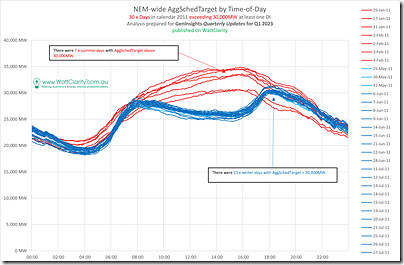
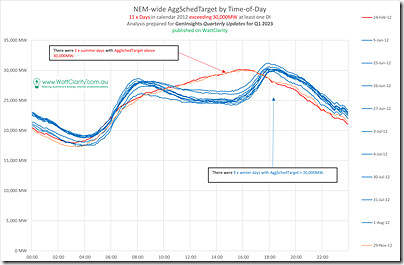
… but first we’ll use this second run of charts to explore the time-of-day profile for AggSchedTarget for all days in the year that saw AggSchedTarget rise above 30,000MW* at any point during that day in the relevant year.
* (re 30,000MW threshold) sometimes there were not too many days, so we have extended the threshold down to 29,000MW
| Year and Summary |
Illustration |
|---|---|
|
Likewise in this second table of statistics, the same approach is taken: 1) Scroll down through the years to quickly gain a sense of what changes (and what does not change) in terms of time-of-day profile for AggSchedTarget for peak days in the year; and 2) Click on any image for a larger view to read the annotations. |
|
|
2009 There were 52 days seeing AggSchedTarget above 30,000MW for at least one dispatch interval. This is easily the most number of days seen above that mark in the 14 year history surveyed. 1) But that’s ultimately not a surprise, given that demand has been declining for more than 10 years. 2) It’s ultimately not all that significant, either, as some form of dispatchable capacity needs to be installed, and available, even just to meet a single instance. Through calendar 2009 the peak instances were skewed towards summer: 1) 32 days during summer months (at both ends of the year); and 2) 20 days during winter months. Note: 1) the very different loading profile for these Scheduled Units through each of these days between seasons, but 2) the great similarity of loading profile within a given season. As you scroll through the next 13 years, watch to see the extent to which these profiles change (and the extent to which they remain the same). |
|
|
2010 There were 43 days seeing AggSchedTarget above 30,000MW for at least one dispatch interval: 1) 16 days during summer months (just at the start of the year); and 2) 27 days during winter months. |
|
|
2011 There were 30 days seeing AggSchedTarget above 30,000MW for at least one dispatch interval: 1) 7 days during summer months (all between 25th January and 4th February, including 5 days in a row); and 2) 23 days during winter (and ‘almost winter’) months – including several runs of consecutive days. |
|
|
2012 Calendar 2012 was much leaner than the 3 years immediately preceding – not only were the peak levels of AggSchedTarget low, there were also fewer (only 11) days seeing AggSchedTarget above 30,000MW for at least one dispatch interval: 1) 2 days during summer months … highest point was 30,212MW at 15:45 on 24th Feb 2012: i. note how this shifts later in the day for subsequent years. ii. 24th Feb 2012 was a day we noted at the time where NEM-wide ‘Market Demand’ reached 30,218MW. 2) 9 days during winter months … highest point was 31,217MW at 17:55 on 26th June 2012. |
|
|
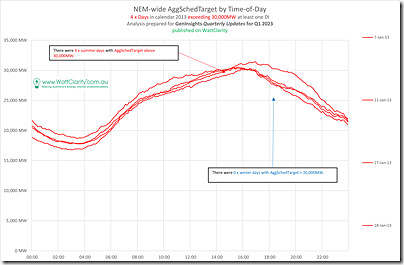
2013 Calendar 2013 followed the lean year that was calendar 2012 … and was even more lean. There were only 4 days seeing AggSchedTarget above 30,000MW for at least one dispatch interval: 1) 4 days during summer months … highest point was 31,442MW at 16:55 on Thu 17th Jan 2013 (when NEM-wide ‘Market Demand’ rose past 31,500MW). 2) 0 days during winter months … highest point was 29,942MW at 17:50 on 24th June 2013. But note that there were 23 days seeing AggSchedTarget above 29,000MW for at least one dispatch interval. |
|
|
2014 Similar to 2013: 1) There were only 5 days seeing AggSchedTarget above 30,000MW (one higher than 2013). 2) But there were only 11 days seeing AggSchedTarget above 29,000MW (much lower than 2013): (a) 5 in summer and ‘late summer’ (all above 30,000MW) (b) Six in winter (all below 30,000MW) In terms of timing of the highest days: 1) In summer it was at 15:45 on Tue 15th Jan 2014 : (a) up at 32,835MW – considerably higher than in 2013 and 2012 (b) a day where we recorded close to record ‘Market Demand’ in Victoria. 2) In winter the highest point was at 18:00 on Mon 14th July 2014 (at 29,536MW). |
|
|
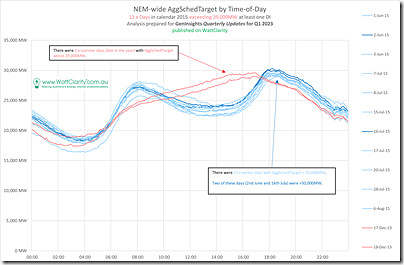
2015 For this year: 1) No summer days above 30,000MW – and not many even above 29,000MW. 2) Only 2 x winter days > 30,000MW, but another 9 (i.e. 11 in total) days seeing AggSchedTarget >29,000MW – which speaks to the consistency of the winter requirement for dispatchable capacity. |
|
|
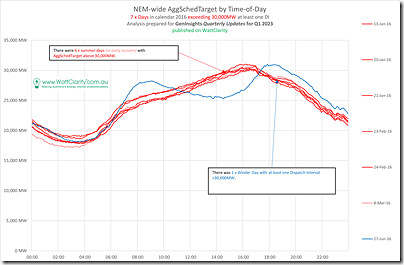
2016 Calendar 2016 showed a somewhat different pattern, with several spikes of AggSchedTarget above 30,000MW at different points in time: 1) In total there were 7 days – but these were in 4 clusters some time apart between each 2) There were 6 days (in January, February and March) during summer (a) highest point was 31,203MW at 16:10 on 23rd Feb 2016. (b) a day where VIC ‘Market Demand’ was reasonably high. 3) There was only a single winter day … highest point was 30,987MW at 17:50 on 27th June 2016.
|
|
|
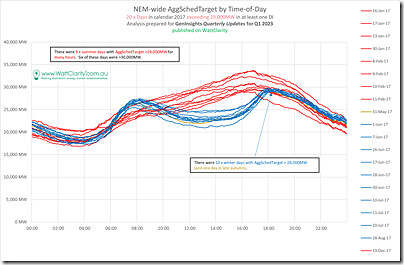
2017 Through calendar 2017 there were 6 days seeing AggSchedTarget >30,000MW, but another 14 days seeing AggSchedTarget >29,000MW. All 20 days are shown on the chart: 1) During summer months there are 9 days shown (including one day late in the year): (a) Three days in particular are standouts, with AggSchedTarget well above the others: i. 33,685MW at 16:55 on 17th Jan 2017 (a day where NEM-wide ‘Market Demand’ exceeded 34,000MW); ii. 32,421MW at 16:00 on 9th Feb 2017; iii. 33,553MW at 16:50 on 10th Feb 2017 (a stressful day in the NSW region with LOR3 called); (b) also notable is that these 9 days don’t display identical time-of-day profiles, even in terms of the time of highest AggShedTarget (some later in the day than others). 2) During winter months there are 11 days shown: (a) Highest point (29,787MW) occurred at 17:50 on 7th June 2017 (b) In contrast to summer, the time of peak AggSchedTarget is very consistent, as it has been for other years shown here. |
|
|
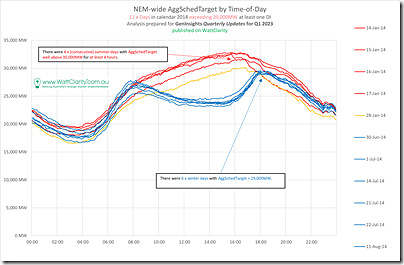
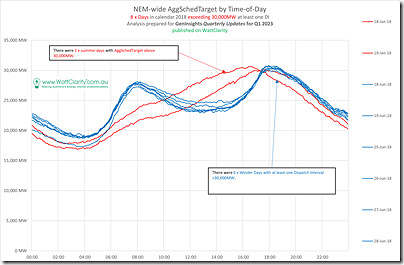
2018 Through calendar 2018: 1) There were only 2 x summer days seeing AggSchedTarget > 30,000MW … but both of these days demonstrate quite different timing patterns (even just one day apart). 2) There were 6 x winter days seeing AggSchedTarget > 30,000MW … with very consistent timing of the peak in this requirement. |
|
|
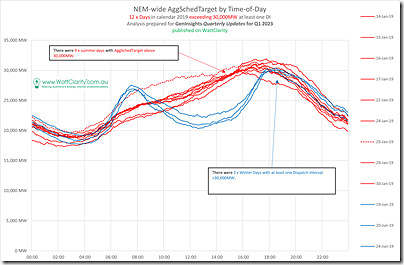
2019 Through calendar 2019 there were 12 x days seeing AggSchedTarget > 30,000MW: 1) 9 of these days occurred during summer: (a) With 15th Jan 2019 seeing the highest point (31,927MW at 17:45 – later in the day compared to the years above) (b) Note the very different (dotted line) profile of 25th Jan compared to the other 8 days (a day after these stresses on 24th Jan) 2) Only 3 days were during winter (a) Highest point being on 20th June 2019 (30,367MW at 18:25) (b) With the other 2 days looking quite similar at the peak (though different ‘belly of the duck’). |
|
|
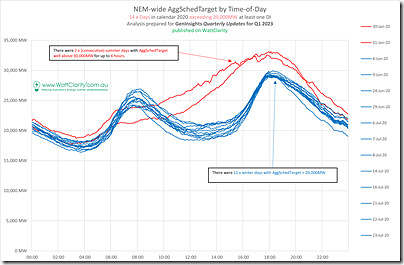
2020 This year is one of the most important ones to study, to gain a real sense of what the requirement is for installed capacity for scheduled plant and what type of plant might be required. That’s because: 1) It’s the most recent period not heavily affected by La Nina (hence depressing Underlying Demand), 2) The period prior to March was also prior to the electricity demand effects of COVID-19 (e.g. lockdown induced demand destruction). 3) Because it’s most recent it has in-built the largest effect of the roll-out of wind and solar to this point … so any shape shown for AggSchedTarget should be In that sense it’s important to note: 1) The 30th (reviewed here on the day) and 31st Jan (‘white knuckle ride’) 2020 were two extreme summer days what showed what is still possible in terms of the requirement for scheduled plant dispatch. 2) Also pay attention to the significant number of winter days seeing peak requirements.
|
|
|
2021 Calendar 2021 was affected by La Nina (and also COVID), so it’s understandable that the daily profile of AggSchedTarget was different. There were only 5 days seeing AggSchedTarget >30,000MW – only another 3 days >29,000MW, and another 6 days >28,000MW. All of these 14 x days are shown in the chart: 1) Only 1 of these days was in summer: (a) that day only peaked at 28,962MW (at 18:40 on 24th Jan 2021 – a stressful day in SA) (b) the profile for the day showing a distinct drop from 16:35 (from 28,232MW) before ramping up again that has not been investigated, but might have been due to the bushfires and line trips. 2) The other 13 x days were in winter: (a) Highest point being on 6th July 2021 (30,858MW at 17:55) (b) With the other 2 days looking quite similar at the peak (though different ‘belly of the duck’). |
|
|
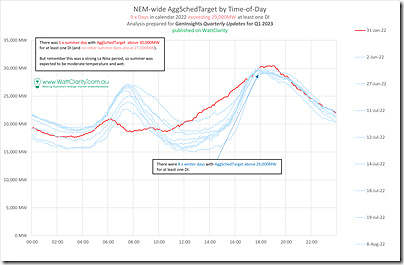
2022 Last year (cal 2022) was also affected by La Nina (but perhaps less so by COVID), so there are some similarities to 2021: 1) Only 1 x day >30,000MW, with another 8 x days >29,000MW. 2) Highest point was in summer (30,447MW at 19:00 on 31st Jan 2022) 3) Highest point in winter was 29,998MW at 17:55 on 19th July 2022 (in the follow-on from the ‘2022 Energy Crisis’) |
|
|
2023 Note (from the above) that Q1 2023 delivered quite mild results, in terms of AggSchedTarget – no instances above 30,000MW (or even above 29,000MW). |
Nothing to show here at this point.
|
A quick summary on the table above.
(D) Key take-aways
This article is probably long enough already, but it would be remiss of me not to highlight some of the take-aways that jump out to me in a review of 14 years of daily data for NEM-wide Aggregate Scheduled Target.
D1) Effects in Summer
The analysis presented suggests that there continues to be a requirement for 30GW to 35GW of dispatchable capacity. The operational cycle for this capacity suggests that it would be used for many hours through peak summer days coincident with low VRE output.
To convert this to capacity ‘on the ground’ we would need to consider an assumed rate of plant unavailability and any network limitations preventing capacity in one location from supplying requirement in another location.
However the evidence also suggest that this is becoming increasingly weather driven – we saw on a year-by-year comparison that some summer periods had required capacity much lower than other years. So the commercial regime that supports this installed dispatchable capacity needs to support them through some summer periods in which they may not need to operate at all.
Any requirement for pumping, charging or hydrogen production is additional to these numbers.
D2) Effects in Winter
In contrast to summer, the evidence suggests that requirement for dispatchable plant during winter is much more consistent:
(a) The magnitude required does not vary as much each year;
(b) It regularly peaks at 18:00 each day (when solar has set, and especially on days when wind is low);
(c) The peak spans ~2 hours.
D3) Other considerations
The analysis presented makes it clear that the requirement for dispatchable capacity has always been lower outside of ‘peak’ summer and winter periods – and the past 14 years do not suggest this pattern is changing.
However, we need to be conscious in not overlooking the risk of an out-of-peak-season ‘unusual’ event like:
(a) a prolonged wind drought (such as we studied in Appendix 27 within GenInsights21); or
(b) major network disruption that might limit the transfer of VRE.
D4) Reminders
Worth re-iterating the following:
1) The data presented here (Aggregate Scheduled Target) is not “demand” (whichever measure you choose to refer to) …
2) It’s what’s left in the market to be supplied by the ‘Keeping the Lights on Services’ after the growing amount of ‘Anytime/Anywhere Energy’ (i.e. supply from Wind or Solar PV) has had its fill
3) Where supplies of Wind and Solar (primarily Large Solar – but perhaps rooftop PV in some cases) have been low, there’s a couple different reasons why this might have been the case:
3a) There are reasons related to the site itself, such as:
i. Of course, it might be that at that time ‘the sun was not shining or wind was not blowing’;
ii. But it might also be because there were technical problems on the site leading to that potential yield being ‘spilled’;
3b) Or it might have been that the site was fine, but it could not get its power to market for a range of reasons, with the two big ones being:
i. It was commercially unpalatable to do so (which would commonly be because of spot prices below $0 … or below ‘negative LGC’ … but could also be because of high Contingency Raise FCAS prices, for instance)
ii. Alternatively, the market might have been fine but their might have
… there have been a number of articles here written about this (such as Allan’s on 9th May).
(E) Living up to the name?
We’ve previously written about how the AEMO’s ‘Electricity Statement of Opportunities’ appears to be an analytical exercise and report that is striving to straddle a few different purposes … and hence not really delivering the best result on any of these individual purposes.
1) When we published GenInsights21 on 15th December 2021 we included the question ‘What’s the purpose of ESOO?’ as Key Observation 8 of 22 within the Report.
2) Given the importance of this (admittedly provocative) question, we decided to publish this Observation in its entirety on 12th April 2022.
Following our article on 14th May 2021, some of the feedback we received was along the lines of …
‘wow, you helped us understand what the opportunity actually is for dispatchable plant in the NEM’!’
I’m hoping that this follow-on analysis and article will extend that understanding … but our sense is that analysis like this would help to fill out a ‘Statement of Opportunities’ that was fully focused on just that purpose.



Leave a comment