
Amidst all the detail presented in AEMO’s 2023 Electricity Statement of Opportunities, there were some interesting tables on what amounts and types of new capacity – over and above what’s included in AEMO’s central reliability forecast – would be sufficient to close the reliability gaps that start appearing in the middle of this decade (putting aside the very minor gaps in the shorter term, which have drawn disproportionate attention).
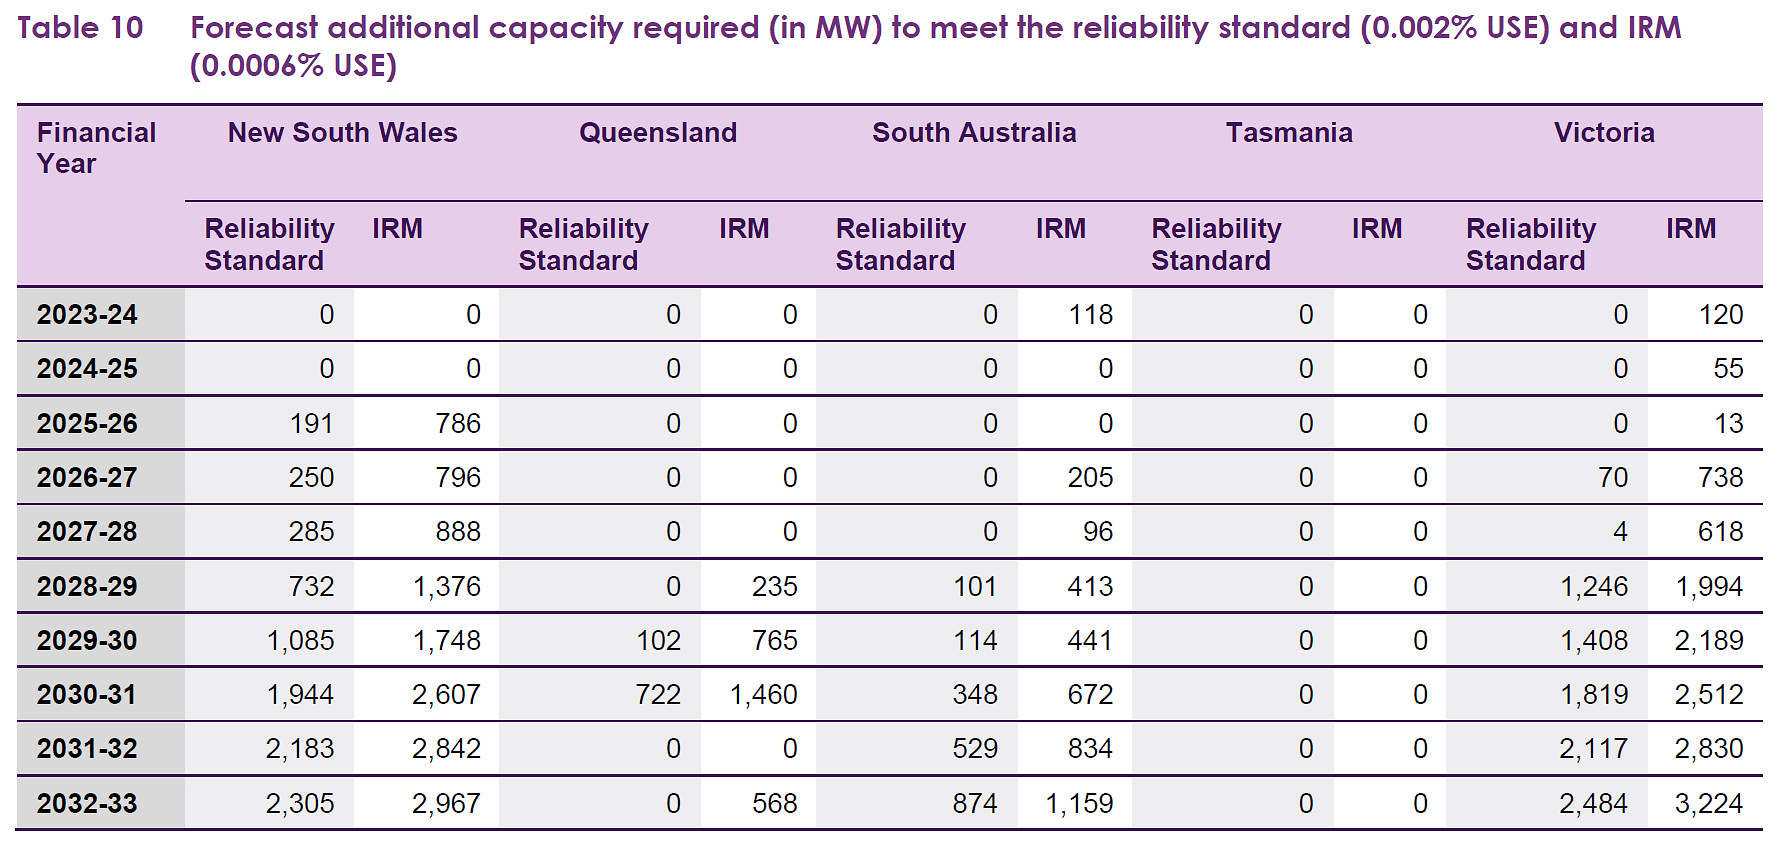
On p73 of the ESOO, AEMO tabulates the amounts of additional “fully-firm” capacity – always available, with no outages or energy limitations – that would be required to bring modelled reliability (annual Unserved Energy [USE], as a percentage of regional load) within either of the two thresholds currently being used for assessment. It’s the growing size of these gaps from mid-to-late in the decade, if ageing thermal stations were to retire without enough committed new capacity in the pipeline, that should be the focus for industry stakeholders.
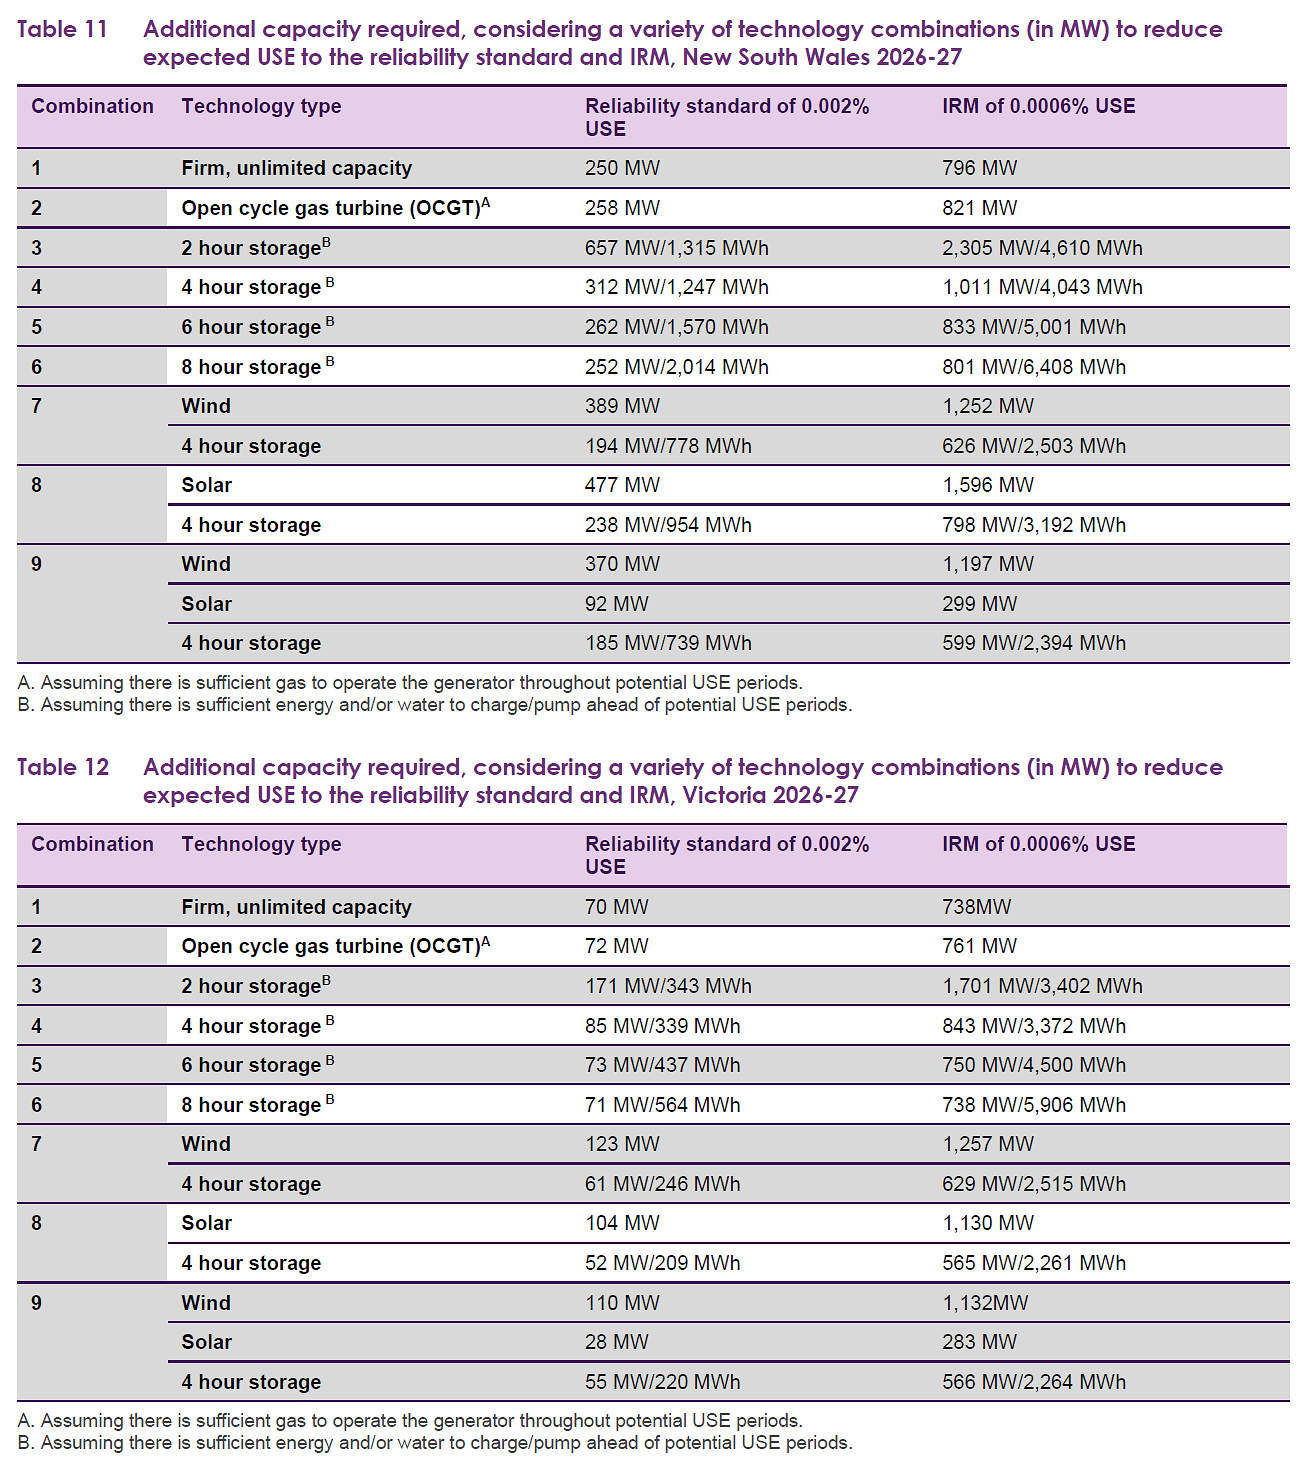
AEMO has been presenting tables like this for some time, but in this ESOO they have helpfully gone further and published two additional tables showing how much less-than-perfectly-firm capacity – that’s any real-world form of generation or storage – of various types would be necessary to close the modelled reliability gaps for New South Wales and Victoria in 2026-27. These results can give us a general idea of how effectively different types of dispatchable and non-dispatchable generation and storage contribute to reliability improvement, relative to the idealised fully-firm variety assumed above.
AEMO list out nine different types or combinations of capacity, showing the capacities of each needed to close the four reliability gaps selected for this analysis:
All those numbers and words are a bit hard to digest, so I’ve simplified and summarised the results into a chart showing the “relative capacity effectiveness” (a new piece of industry jargon I’ve just made up) for each technology type. You can very broadly think of this measure as the equivalent proportion of “firm megawatts” contributed by each technology, relative to one megawatt of the gold-standard fully firm variety – but read the fine print below for some important caveats on this.
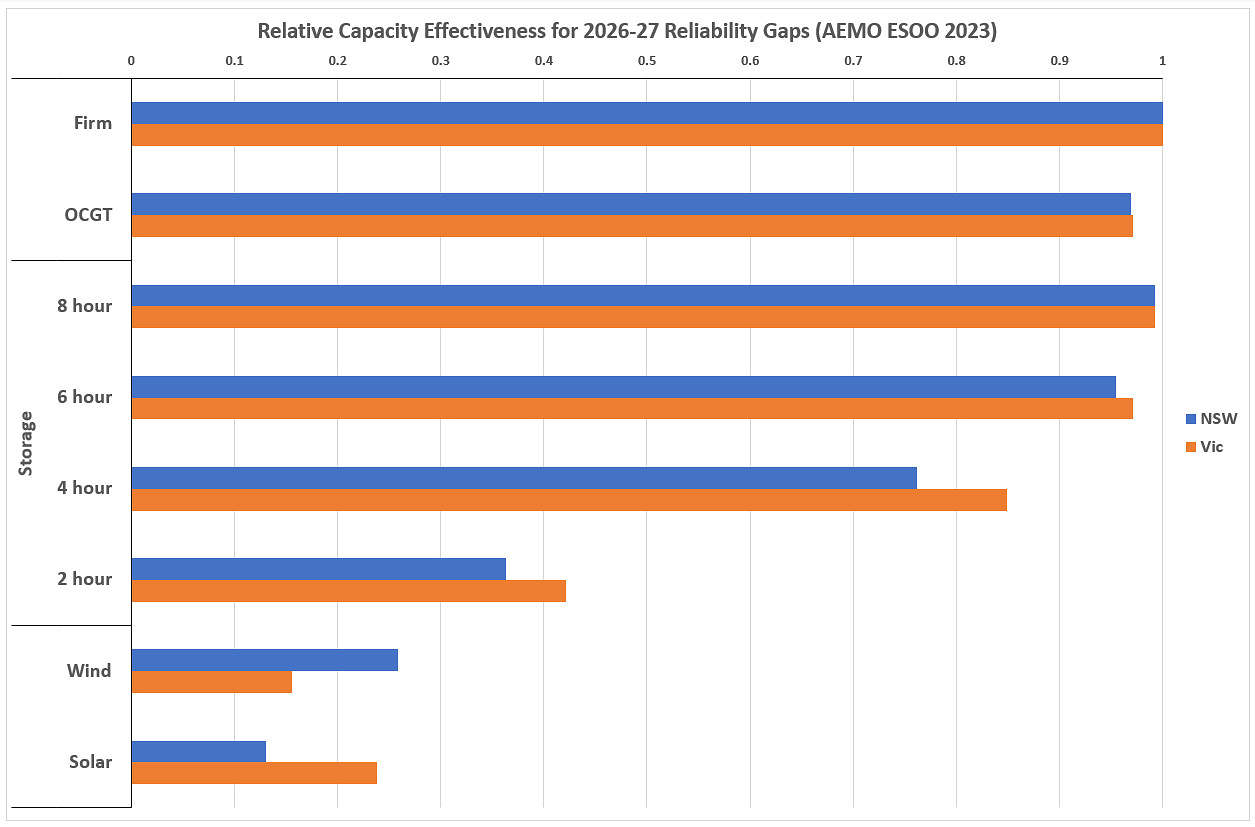
Relative to the fully firm variety, open-cycle gas turbines (OCGT) and storage with eight hours of energy in the bank are both very close substitutes, with effectivenesses well over 0.95 (meaning they effectively contribute to reliability at more than 95% of their nameplate capacity). Storage with six hours duration is almost as good as the eight hour variety – and almost certainly more economic*.
—————
Editor’s Note – with respect to Allan’s ‘almost certainly more economic*’ comment, see Dan Lee’s article that follows his presentation on Tuesday 5th September 2023 at ‘Smart Energy Queensland’.
—————
At four hours duration, storage is still quite effective at around 80%, but differences between New South Wales and Victoria start to emerge, with effectiveness falling off slightly more in the northern state. This implies something about differences in the modelled energy shortfall characteristics of the two regions, with New South Wales benefiting slightly more than Victoria as storage duration increases.
With only two hours duration, the effectiveness of storage falls off sharply, to about 40%. This means that against a reliability gap that could be filled by 1 MW of fully firm capacity, or slightly over 1 MW of OCGT or eight hour duration storage, around 2.5 MW of two hour storage would be required to yield the same reliability benefit. So it appears that – at least in the cases modelled – there’s probably a “sweet spot” for the impact of storage duration on reliability, in terms of costs versus effectiveness, somewhere between three and five hours.
Again – read the caveats below before (not) extrapolating this result to other regions or time periods!
Then for the non-dispatchable renewable sources we see much lower effectiveness values in the AEMO modelling – not surprising at all, because in a system with growing levels of these sources, reliability gaps gradually shift towards times when “the sun ain’t shining and the wind ain’t blowing”, to paraphrase a former prime minister. So adding non-dispatchable renewable capacity, although it increases overall energy supply to the system, provides smaller reliability benefits**.
—————
Editor’s Note – with respect to Allan’s ‘provides smaller reliability benefits**’ comment, this is the reason why a growing series of analysis has been completed for GenInsights Quarterly Updates on the ‘Aggregate Scheduled Target’ metric to highlight the historical pattern of requirement for the (non-VRE) firming capacity, with some articles shared on WattClarity such as:
(a) On 31st May 2023 with ‘Digging into ‘Aggregate Scheduled Target’, to understand what Dispatchable Capacity is actually required’; and
(b) On 30th August 2023 (day before the 2023 ESOO) with ‘Case Study of high AggSchedTarget on Thu 30th Jan 2020 and Fri 31st Jan 2020 (part 1!)’.
—————
What is interesting is the state-to-state differential here: in New South Wales, additional wind capacity would do more for reliability than in Victoria. For solar capacity the reverse is true, with the differences being quite significant. This almost certainly reflects the relative contribution of existing renewables in the two regions, with New South Wales currently having a lower share of wind capacity than the southern NEM states, and Victoria more wind but less solar. It may also reflect differences in the weather conditions under which each state experiences high net demands.
Important Caveats
In most cases these “relative capacity effectiveness” values will be highly dependent on the existing supply and demand characteristics for the region and time period being modelled – this is particularly so for the shorter duration storage and renewables options.
There is no single figure for the “relative capacity effectiveness” of most technologies that is independent of its geographic and temporal context. This should be obvious even from the limited range of cases modelled in the ESOO – with very different values for wind and solar depending on which state is being modelled. So don’t make the mistake of trying to extrapolate these results to other regions or time periods.
Nevertheless, I think they’re a useful addition, like a number of other pieces of analysis, to AEMO’s 2023 ESOO.
=================================================================================================
About our Guest Author
 |
Allan O’Neil has worked in Australia’s wholesale energy markets since their creation in the mid-1990’s, in trading, risk management, forecasting and analytical roles with major NEM electricity and gas retail and generation companies.
He is now an independent energy markets consultant, working with clients on projects across a spectrum of wholesale, retail, electricity and gas issues. You can view Allan’s LinkedIn profile here. Allan will be occasionally reviewing market events here on WattClarity Allan has also begun providing an on-site educational service covering how spot prices are set in the NEM, and other important aspects of the physical electricity market – further details here. |
Something I found surprising in these tables was the relative effectiveness of short storage in NSW, with 4610 MWh as 2h BESSs said to be equivalent to 4043 MWh as 4h BESS in improving reliability.
This doesn’t make any sense to me. All else being equal, 1 MWh of 2h BESS capacity should be able to do everything that the same storage in a 4h BESS can do and more. Is there something I’m missing that would explain how these numbers can be internally consistent?
Good pickup Tom, I agree that it doesn’t seem logical at all that more MWh of 2 hour storage would be required to match the contribution of 4 hour storage. I wonder if this is some artefact of the way AEMO’s modelling dispatches storage units.
Hi Tom, I noticed the same thing. The low relative effectiveness of the 2hr BESS must be driven by the derating factors applied, as described on p108. 2-hr batteries have the MWh capacity reduced by 25%, 4-hr batteries by 10%. As you notice above, the results above demonstrate that these deratings are much too harsh.