
Tristan Edis recently posted a great article here on WattClarity illuminating multiple aspects – good and bad – of renewable generators’ performance in the NEM.
One factor he highlighted was curtailment of solar and windfarm output. That is, renewable facilities generating less energy than was potentially available from incident sunshine or wind.
In a sense, most generators in the NEM, whatever their energy source, are nearly always being “curtailed”: coal-fired, hydro, and gas-fired generators rarely operate at their technical maximum output levels even when they have plenty of available fuel, and generators in the second two categories may spend long periods generating nothing at all.
But the close-to-zero marginal costs of turning sunshine or wind into additional electrical power mean that the economics of solar and wind generators reducing output below their real-time technical availability differ from thermal generators running on relatively expensive fuels, or from hydro plant with strictly limited stocks of water. Furthermore – rightly or wrongly – the business cases developed for renewable generation investments and the expectations of their owners tend to be that they will nearly always generate as much output as available wind or sun will allow.
So any suppression of the output of these generators seems to get more attention than do changes in utilisation or capacity factors for traditional generators – I guess this post is another contribution to that theme. But to extend the great insights in Tristan’s post I thought it would be worth further unpicking the two major drivers of renewable curtailment to look at some recent trends.
Curtailment ain’t curtailment
I’ll start by differentiating “forced curtailment” from “self-curtailment”. The former is imposed on renewable generators (and also non-renewable generators) when network constraints limit their output to the grid to levels lower than they would otherwise choose to produce.
“Self-curtailment” is a deliberate choice made by a generator to operate below available maximum output. In a market like the NEM this is typically an economic decision managed via a generator’s market offers in which it nominates the minimum spot prices it is willing to accept for various blocks or bands of power output. In each offer band, the generator is stating a preference not to sell this energy if the spot price falls below the band’s nominated price, and expects a dispatch instruction from AEMO to reduce output accordingly.
Editor’s Note: For the benefit of readers, it’s worth highlighting that this ‘self curtailment’ has been delivered by two different mechanisms over time:
1) Prior to Monday 12 April 2021, some Semi-Scheduled units took advantage of some leeway in the rules to do this ‘self-curtailment’ whenever they did not like the price outcome, regardless of what they had offered in their bids;
2) However that loophole was closed when the AEMC published its Rule Determination on Semi-Scheduled Generators on 11th March 2021, which followed from an AER Issues Paper on 24th June 2020.
To repeat, “self-curtailment” is just what most traditional generators in the NEM do almost all the time. The only substantive difference is that these traditional generators typically self-curtail, even completely, at much higher spot prices than those at which renewable generators would aim to be fully dispatched, with their zero marginal costs and additional revenue potential from production of renewable energy certificates.
To clearly distinguish this voluntary output reduction from constraint-driven curtailment, from here forward I’ll use the term “economic offloading”, or just “offloading” rather than “self-curtailment”. The main purpose of this article is to quantify the observed balance between forced curtailment and offloading, and recent trends in this balance, in analysing output from the NEM’s renewable generators.
Method
The conceptual basis I’ve used for differentiating offloading from curtailment is straightforward (although doing the actual number crunching is less so). By analysing each generator’s market offers and real-time availability for each dispatch interval, and knowing the spot market price for that interval, it’s simple to work out how much of their available power each generator offered in price bands below the spot price. This is the minimum they would have expected to generate given their availability, their offers, and the spot price outcome. If the dispatch target they received from AEMO was lower than this “inframarginal” volume, the difference must represent forced curtailment – it’s not an economic choice being made by the generator.
Because the overall gap between availability and dispatched output must be equal to curtailment plus any economic offloading:
Output suppression = Availability – Dispatch Target = Curtailment + Offloading
then once we’ve worked out curtailment as above, we can immediately quantify offloading since we know all the other terms in the equation. We can then add up or average these dispatch interval quantities over whatever time period we are interested in analysing. Here’s a diagram illustrating the basic methodology:
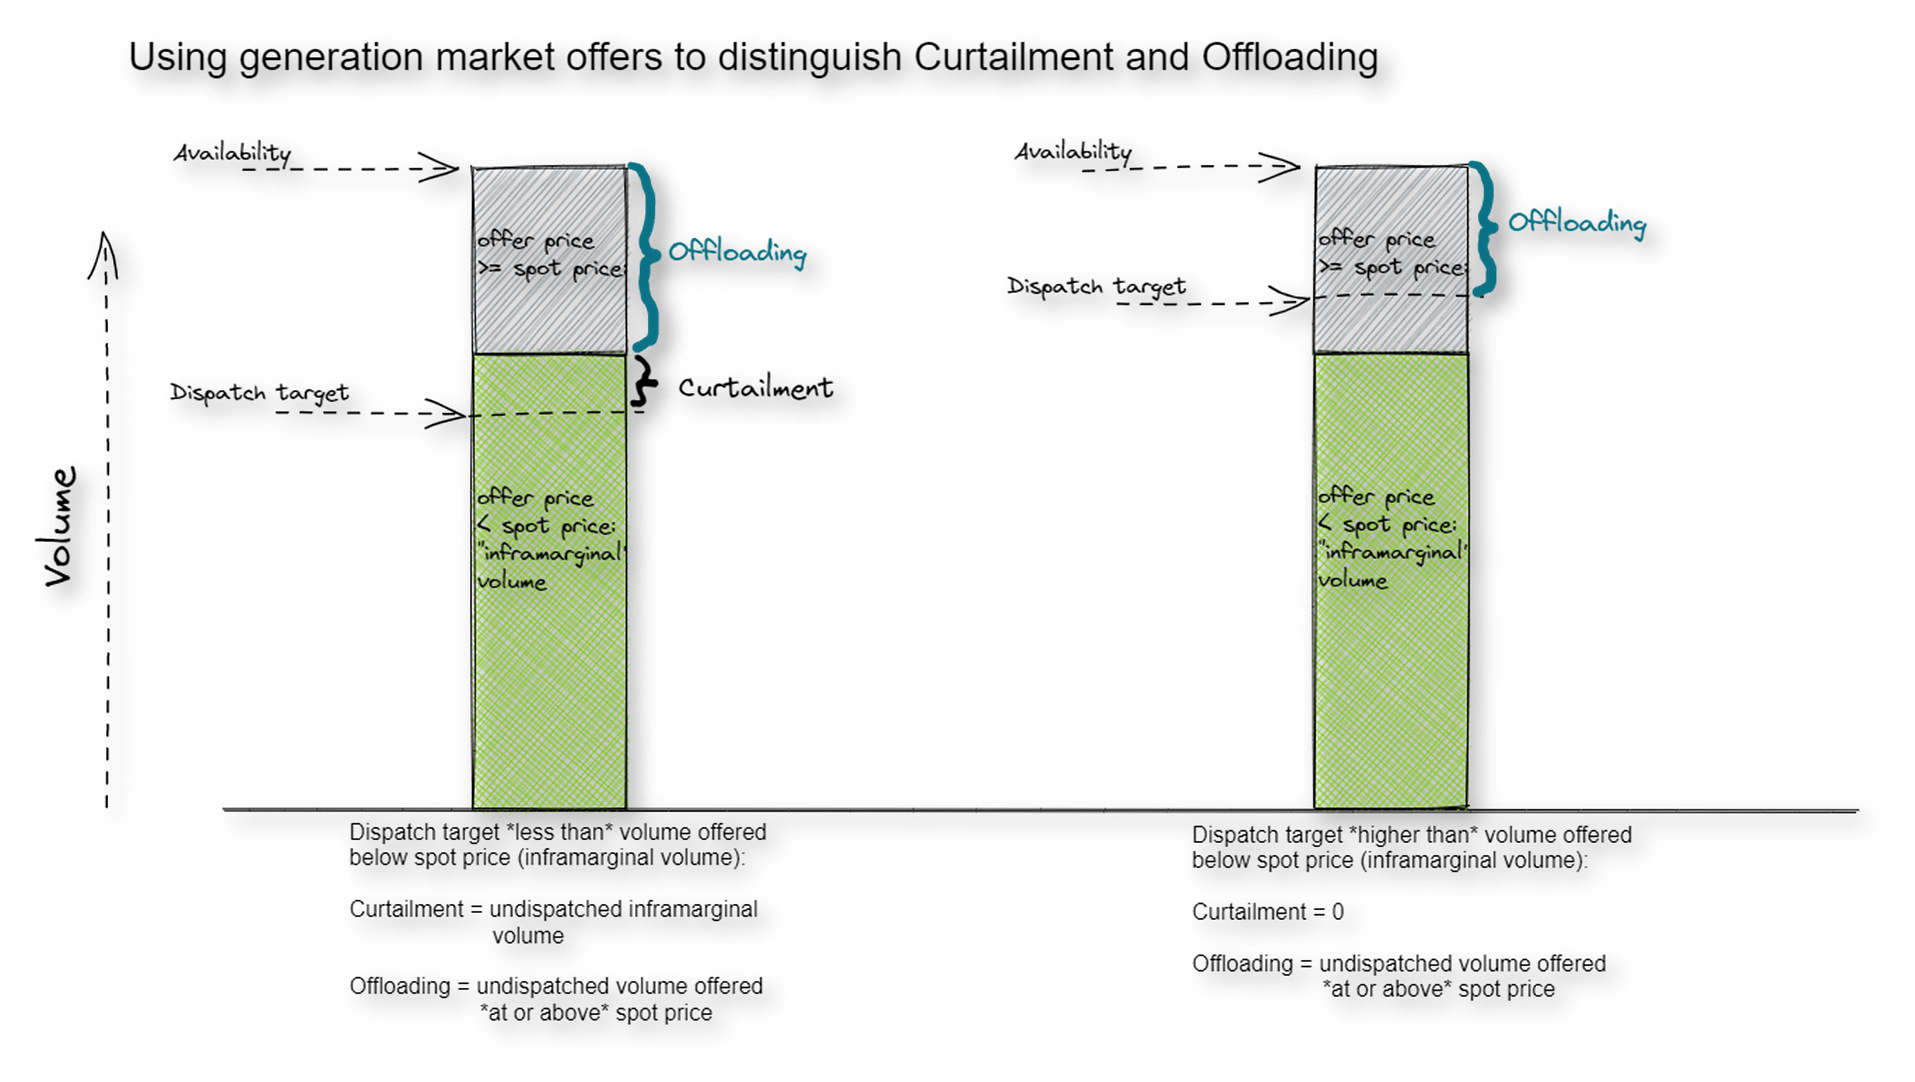
Keen-eyed readers will realise that dispatch targets are not quite the same as actual delivered output from generators, particularly renewables whose production over a five-minute dispatch interval fluctuates with second-to-second incoming energy, and may end up some way “off-target” at the end of that interval. But for characterising the curtailment and offloading that results from the market dispatch process, which neatly brings together the impact of constraints and price outcomes, I think it’s clearest to stick with the dispatch view of the world.
A separate limitation in the public data available is that we can only easily determine curtailment and offloading for semi-scheduled solar and wind generators whose output is dispatched via the spot market – we don’t have any visibility of output reductions made by the non-scheduled generators for either reason.
Some results
Definitions and methods dealt with, here are some results.
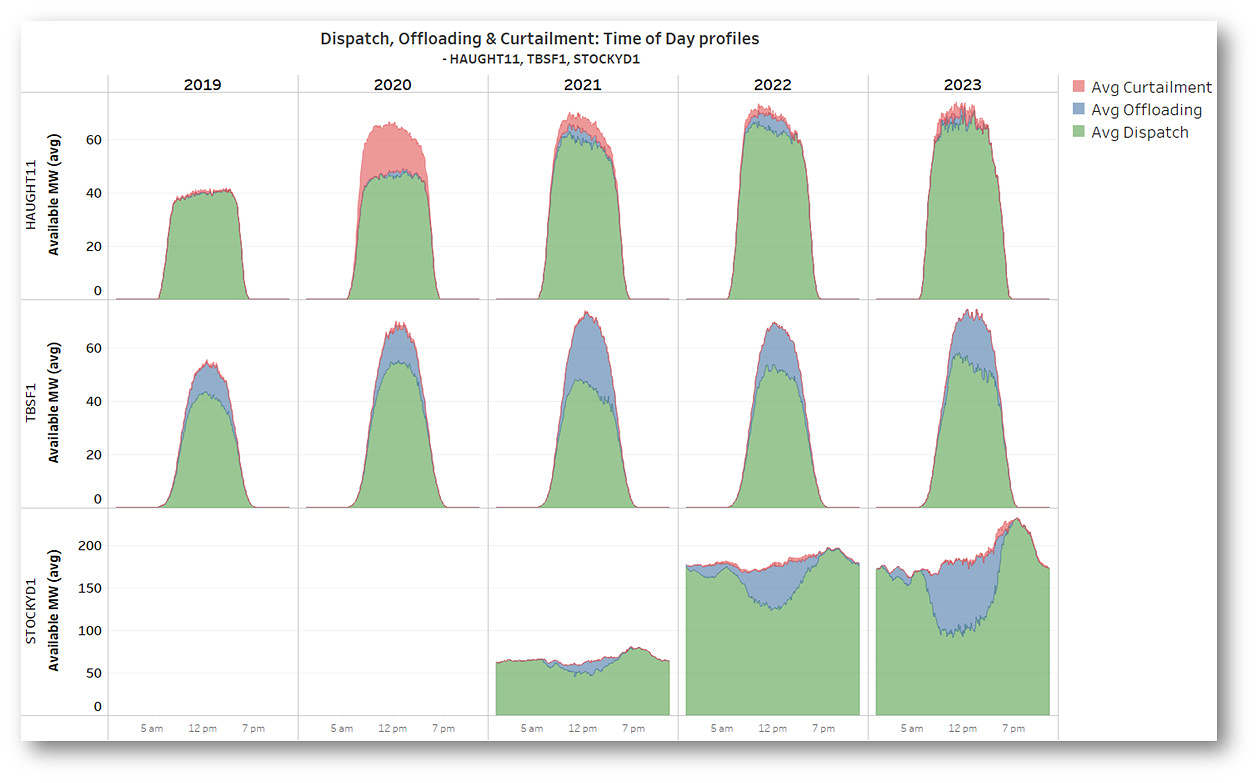
First, some examples of the extent and breakdown of the dispatch, curtailment and offloading of available energy from three individual solar and wind generators, showing average levels by time of day across recent years (noting that 2023 covers only Q1 so may not be strictly comparable). I’ve chosen two of the solar generators mentioned in Tristan’s post, Haughton Solar Farm in Queensland and Tailem Bend in South Australia, as well as one of Victoria’s large windfarms, Stockyard Hill.
Several points stand out:
- most of the suppressed output at Haughton is forced curtailment, the bulk of that occurring in 2020, with around 24% of available output in that year curtailed due to constraints – in this case the north Queensland system strength constraints discussed in Tristan’s post. In more recent years Haughton has seen sharply reduced curtailment but a little more economic offloading.
- In contrast Tailem Bend 1 in South Australia has seen very little forced curtailment, but substantial amounts of regular economic offloading – nearly 20% of available output across the five years shown – due to middle of day spot prices falling at or below its market offers (which tend to be at higher prices than many other solar and wind farms).
- The pattern at Stockyard Hill windfarm in Victoria is broadly similar to Tailem Bend’s and shows that its offloading is largely confined to daylight hours – again pointing to low middle of day prices being the driving factor behind average offloading of around 11% of available output across its three years of operation. This grew strongly to average around 17% in Q1 2023.
These results hint at a pattern of more of the lost output in the north of the NEM resulting from curtailment, while offloading may be playing a bigger role in the southern regions. We can check this by looking at profiles for all mainland solar and wind assets grouped into northern (Queensland and New South Wales) and southern (Victoria and South Australia) super-regions. I’ve left out Tasmania, whose windfarms (happily, I imagine) experience very little curtailment or offloading at all.
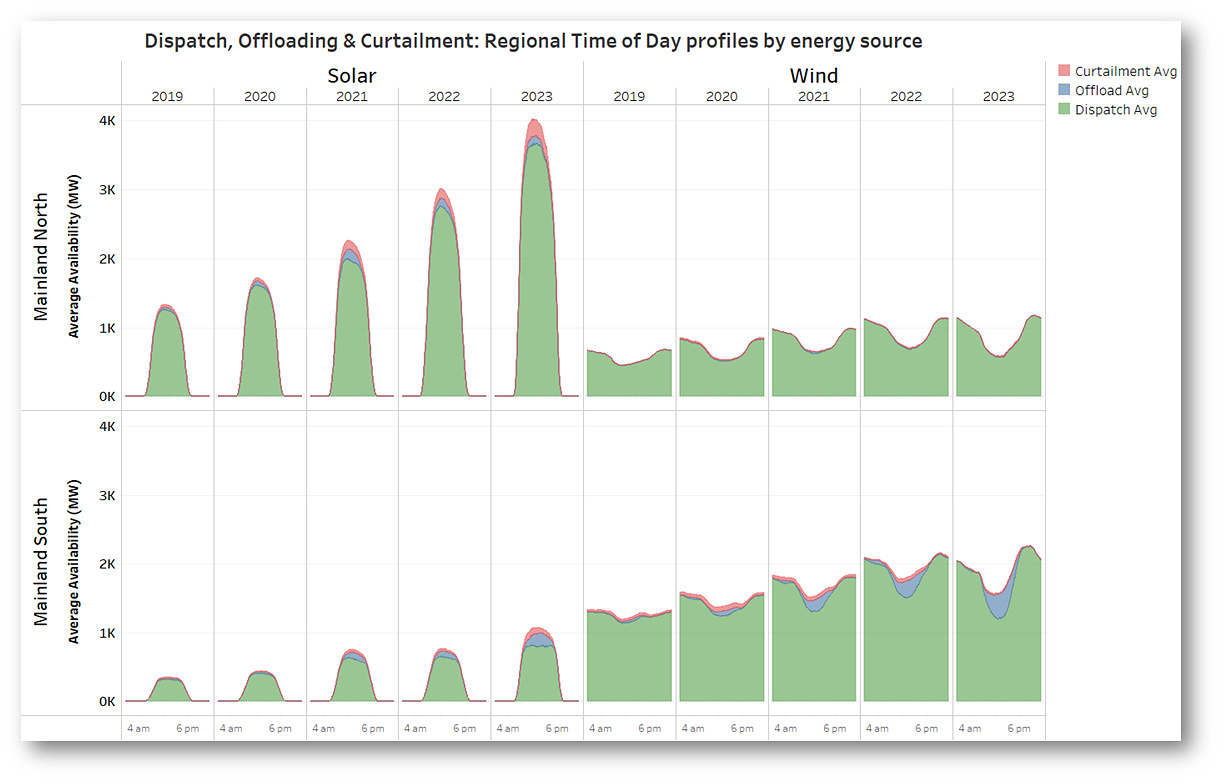
This shows that curtailment is indeed the principal cause of reduced output in the northern regions, but also that this is confined to the solar sector in Queensland and New South Wales, with very little curtailment or offloading observed at the regions’ wind facilities.
In the southern regions there is generally less curtailment – and this has actually fallen for windfarms, primarily due to removal of South Australia’s system strength constraints from late 2021 onwards. But in these regions economic offloading has clearly become more prominent in recent years at both solar and wind generators.
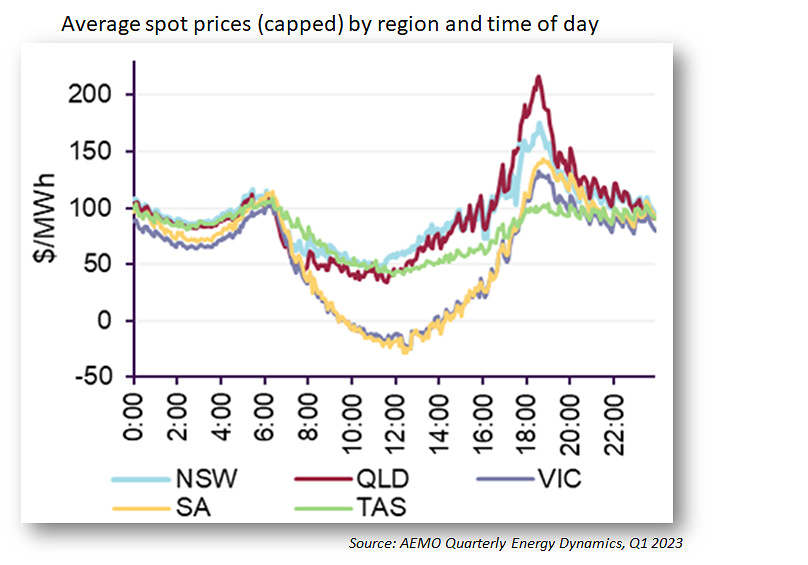
This is a reflection of the “north-south price divide” noted regularly in AEMO’s recent Quarterly Energy Dynamics reports, illustrated here via the very different time of day price profiles for South Australia and Victoria compared to the northern states in Q1 2023. More on this later.
Incremental impacts
Sticking to the super-regional level, it’s interesting to compare year-on-year changes in availability, curtailment, offloading, and dispatched energy for the northern and southern sections of the mainland NEM – here grouping together the solar and wind facilities in each. This view shows changes in Q1 2023 from the corresponding quarter a year ago:
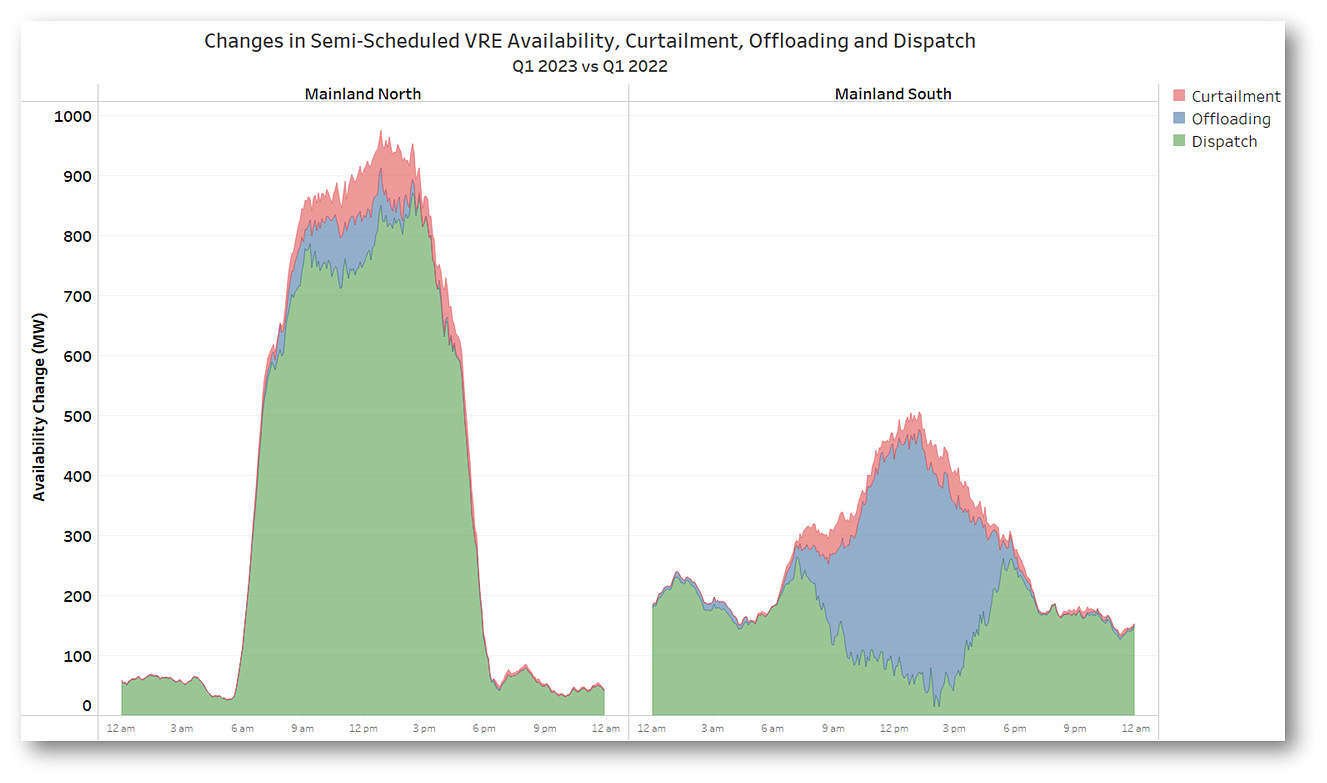 This shows the incremental effect of increased curtailment and offloading (in absolute, not necessarily percentage, terms) in determining how much of the growth in available renewable output (mostly resulting from connection and/or completion of commissioning at newer facilities) actually reaches the market as additional dispatch. This is graphically represented by the difference between the green dispatch series and the top of each area chart.
Clearly much more of the growth in available renewable energy in the northern NEM reached the market as additional dispatch in Q1 2023 (about 90%), while in the southern regions the recent rise in offloading meant that a substantially smaller proportion of availability growth was actually dispatched (only about 56%). Low daytime prices in the southern NEM regions in Q1 2023 meant that it was not economic for a significant proportion – 38% – of the increase in available renewable energy in these regions to actually be dispatched, with most of the offloading concentrated in the central daytime hours.
Which farms are most affected?
Curtailment driven by network constraints is almost always a localised phenomenon, driven by transmission or system strength limitations specific to relatively small areas of the grid. Conversely, price-based offloading is likely to reflect region-wide drivers, principally the behaviour of spot prices.
For further insight here I’ve plotted levels of curtailment and offloading as percentages of availability at individual farm (or “DUID”) level over the past three years in the following chart. For readability this excludes farms where aggregate curtailment and offloading over the three years was less than 7.5%. Farms are grouped by energy source and by region to assist in identifying regional and technology differences. Finally I’ve also excluded small solar and wind facilities with capacities of under 30 MW, again mainly for readability.
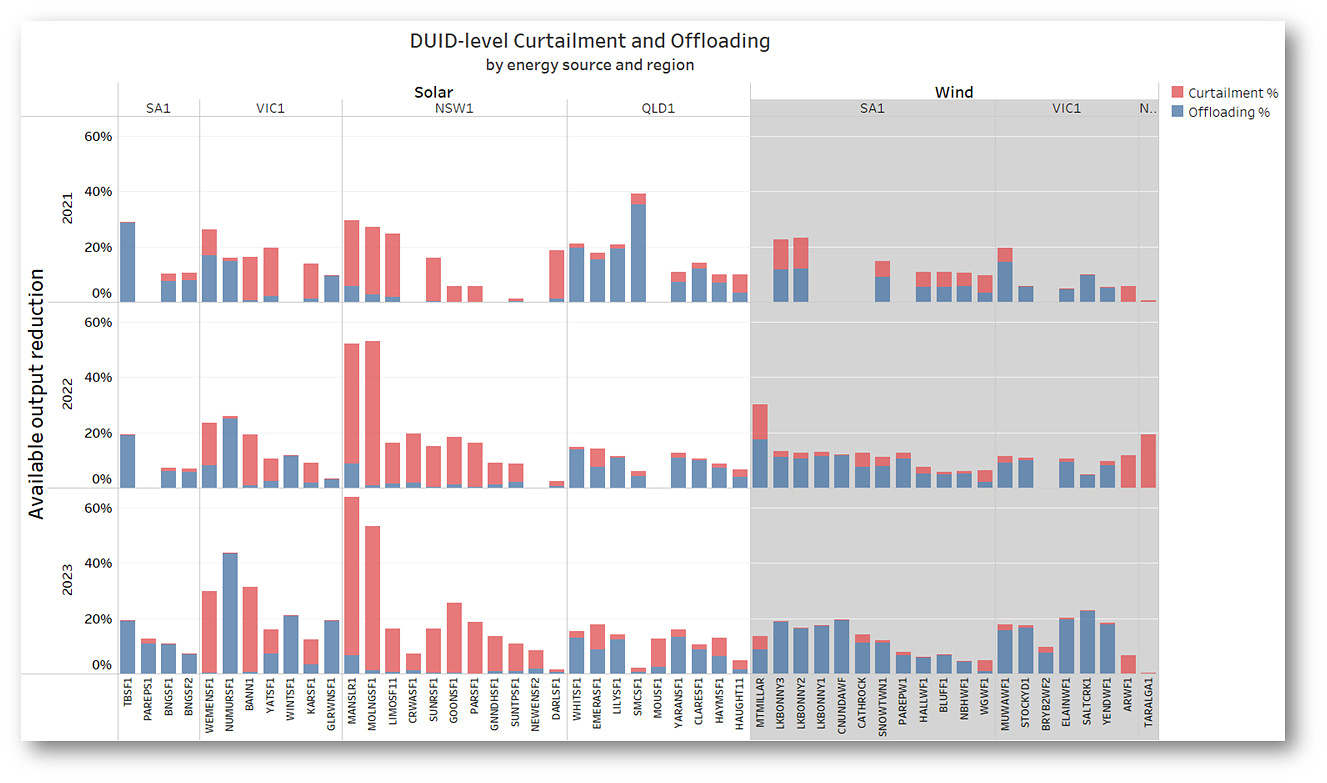 Some key differences that stand out in this chart are:
- Compared to other regions, the large number of New South Wales solar farms subject to significant curtailment, typically with higher curtailment levels (up to 57% in Q1 2023 for the Manildra Solar Farm, closely followed by Molong Solar Farm at 52%)
- In other regions there are a few farms with material curtailment levels between about 10% and 30%, but in most other cases offloading is the principal driver of output foregone.
- Comparing 2021 and 2023 for South Australian windfarms shows the reduced incidence of curtailment following resolution of the region’s system strength constraints.
- Conversely, offloading of windfarms in South Australia and Victoria was particularly extensive in 2023 (remembering that this represents the Q1 result only for this year).
The quick overall takeout from these results is that grid congestion is most acute for solar facilities in New South Wales, while the low daytime spot prices in South Australia and Victoria have led recently to relatively high offloading, particularly at certain windfarms.
Hang on – is a lot of this offloading really just curtailment in a different guise?
To finish up, I’m going to circle back to a point I made earlier: offloading appears to be qualitatively different from (forced) curtailment. Offloading is an economic choice made by generators and simply reflects normal market operation. Forced curtailment is something imposed by network limitations. Hence all that effort to separate out the two. But just how different are they for renewable (and other) generators in the current state of the NEM?
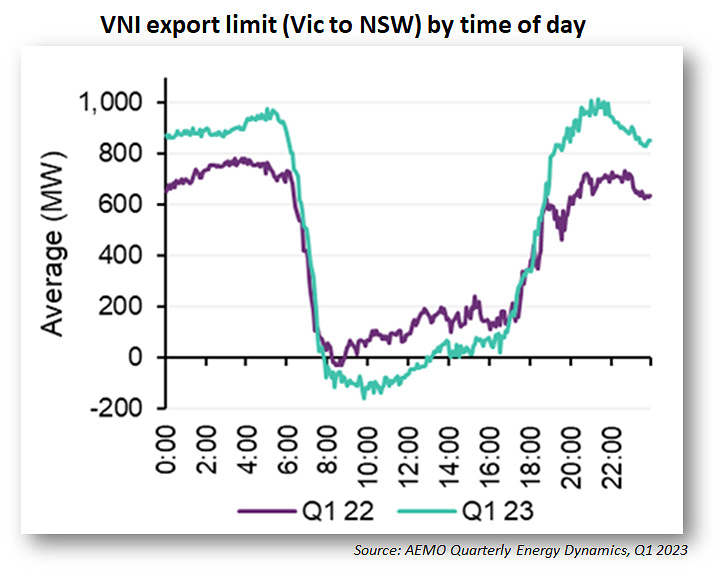
The higher absolute and incremental offloading levels in the southern NEM regions reflect much lower daytime spot prices in those regions – well illustrated by the AEMO price profile chart I included earlier. Here it is again.
But what drives these price profiles? In fact, network constraints are a major factor – just different constraints from the ones that typically impact specific parts of the network and relatively small numbers of solar or wind farms. Regional price separations this big only arise because of significant limitations on inter-regional energy flows across the NEM’s interconnections. And the interconnection which has been most subject to large and ongoing constraint impacts recently is VNI: the Victoria – New South Wales interconnection. Another chart from AEMO’s most recent QED illustrates this starkly:
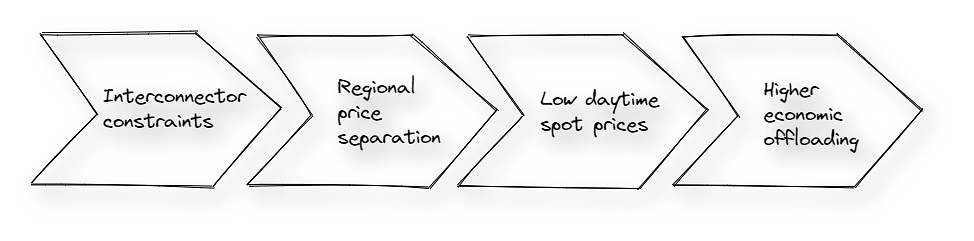
Reasons behind this have been pretty thoroughly traversed in recent and older articles both here on WattClarity, and elsewhere (see the Australian Energy Council’s excellent writeup). I won’t reheat the arguments here, but the point is that this all adds up to the following chain of impacts:
 In other words the economic offloading of wind and solar output in the southern NEM regions is not solely, perhaps not even principally, a function of things like greater economic competition or a looser supply-demand balance in those regions, but also a direct reflection of key network constraints that have region-wide, rather than localised, impacts on dispatch outcomes and spot price.
So perhaps a good part of all that “offloading” in the southern NEM regions could instead be seen as constraint-driven curtailment – just operating more indirectly? If that’s the case, then it adds further urgency to the task of resolving the underlying transmission issues as soon as possible.
=================================================================================================
About our Guest Author
 |
Allan O’Neil has worked in Australia’s wholesale energy markets since their creation in the mid-1990’s, in trading, risk management, forecasting and analytical roles with major NEM electricity and gas retail and generation companies.
He is now an independent energy markets consultant, working with clients on projects across a spectrum of wholesale, retail, electricity and gas issues. You can view Allan’s LinkedIn profile here. Allan will be occasionally reviewing market events here on WattClarity Allan has also begun providing an on-site educational service covering how spot prices are set in the NEM, and other important aspects of the physical electricity market – further details here. |
Leave a comment