Given the many factors that have influenced the trend of declining demand since around 2008 in the NEM (solar PV probably being the most talked about one, though the list is a lot longer than that), and head down in other aspects of what we are doing to make complexity understandable in other parts of the energy sector, I was very surprised to switch back to the overview provided by NEM-Watch and see the NEM-wide demand climbing past 34,000MW.
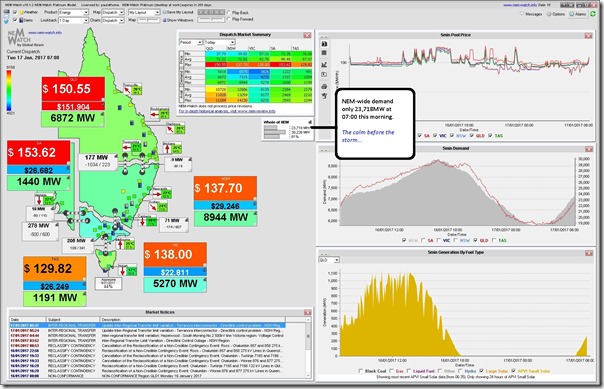
The earliest snapshot I’d grabbed earlier today was the following one from NEM-Watch at 07:00 this morning (as noted here, the calm before the storm):
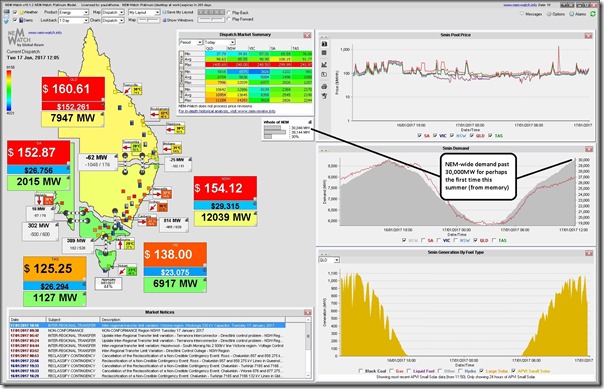
By 12:05, as I’d tweeted at the time, the NEM-Wide “Scheduled Demand” Dispatch Target had climbed past 30,000MW for what I think is the first time this summer. Note that both NSW and QLD had climbed out of the green zone (in terms of demand relative to historical extremes) at this point in time:
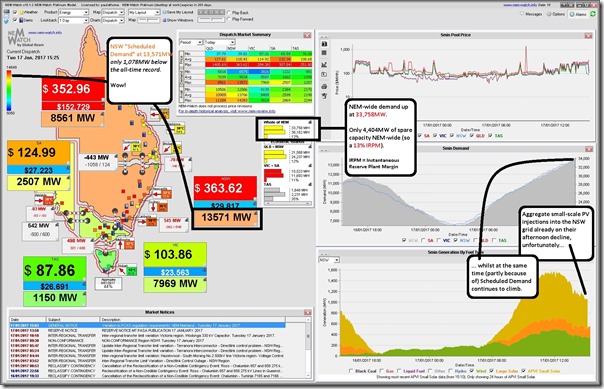
I was not paying too much attention to the dashboard today (busy down at the battery storage end of the supply chain) until I glanced up and saw this view of the 15:25 dispatch interval. In particular, I noted three things:
(a) I saw showing NEM-wide demand up at 33,783MW.
(b) As a result, as noted in the snapshot, I saw the NEM-Wide IRPM (Instantaneous Reserve Plant Margin) down at a low level of 13%.
(c) I saw the very rare event of demand peaks in NSW coinciding with demand peaks in QLD (the colour coding of both regions very Orange, as shown). In fact, off the top of my head I cannot remember seeing that happen on any specific occasion in the past.
At just a bit more than 4,000MW of spare capacity, it does show major challenge of the planned closure of large (>1,600MW) Hazelwood power station in Victoria come the end of March:
(a) An unequivocal win for emissions reduction;
(b) A more challenging outcome for security of supply (note comments here about some challenges);
(c) Much less certain, also, in terms of probable price outcomes – any politician, consultant, investor, or other that tells you otherwise is talking their book.
Note that an even more significant impact would be felt if industrial action at Loy Yang A were to take it offline for an extended period.
I posted the single image above at 15:36 (NEM time) and had to head out for a while (thankful that it was Brisbane temperatures, and not Sydney ones, I had to encounter).
Returning to this post now, here are a few extremes relevant for the day:
| Highest NEM-wide demand today | At the time this post was updated, Scheduled Demand had reached 34,396MW at 16:50 on a dispatch target basis – before beginning a slow decline.
By way of comparison, this was only 1,000MW off the all-time record experienced back on Thursday 29th January 2009 – a few days prior to “black Saturday”. |
| Lowest NEM-Wide IRPM today | Whilst out, my NEM-Watch SMS alerts continued to remind me of the low levels of IRPM being experienced – with the lowest being down at 11.63% at 17:00.
To put this into context, other articles referencing low IRPM are linked here. |
| Highest NSW regional demand today | The NSW demand reached 13,745MW at 17:00 – again, before beginning the slow decline into the evening.
Back on 1st February 2011 the NSW region experienced a regional demand of 14,649MW (on the same basis as here – Scheduled Demand, dispatch target). We can see that today’s peak was less than 1,000MW below that. |
| Highest QLD regional demand today | The QLD demand reached 8,941MW at 16:55 – again, before beginning the slow decline into the evening.
Already last Friday we saw QLD demand reach 9,088MW this summer – which was 70MW off setting a new record. |
Stay tuned for more this summer!


Not sure how closing Hazelwood is a win for emissions reduction, the same amount of electricity will be needed after it closes, some sources will get to increase their outputs, and there is only one type of generator that can do that useful trick.
Because no plant is more emissive on a t CO2/MWh metric than Hazelwood, so even if you are assuming its output will be replaced entirely by other coal plant, emissions will be at least marginally lower overall.