I’ve been intending to write this article for quite some time – but this week finally got a move on for a couple reasons including:
1) That submissions are due tomorrow (5pm Thu 31st Aug) on the proposed ‘Capacity Investment Scheme’; and also
2) Also (coincidentally!) tomorrow we see the release of the much-awaited 2023 ESOO … which is widely expected to generate a flurry of news media articles about different aspects of the energy transition.
I don’t have time to do everything I’d like, but offer this today so that readers can consider with respect to what comes tomorrow …
(A) Background to this Case Study
Before we get into the details of what happened on those two remarkable days in January 2020, it’s worth recapping some background to this Case Study, for those who have not been frequent readers here…
(A1) A fourteen year trend (2009 to 2022)
On 14th May 2023 we wrote about how ‘we’re not building enough replacement dispatchable capacity’ … which is an important principle to understand – both in terms of:
Aspect 1) how the peak requirement for Firming capacity (of any type) is remaining stubbornly high.
Aspect 2) how we’re not building enough Firming capacity to cover those coal units that have already retired … and to cover scheduled retirement of coal units (such as the looming closure of Eraring as soon as 2025).
We followed that article two weeks later by ‘Digging further into ‘Aggregate Sched Target’ to understand what Dispatchable Capacity is required’ … in which article we looked at daily data over a 14-year period (2009 to 2022 inclusive) to reveal some key patterns in the metric AggSchedTarget …
A key observation that can be made in reviewing this real data is that:
1) Over a 14- year period in which we’ve installed between 40,000MW and 50,000MW of capacity for VRE …
(a) ~20GW of large-scale Wind & Large Solar
(b) plus 20GW to 30GW of Rooftop PV
… this article in the ABC says ‘more than 20GW’ at March 2023 but I know I’ve seen higher estimates elsewhere before (just can’t lay my hand on them now).
2) And yet, despite this investment, the peak requirement for firming capacity:
(a) has remained stubbornly high …
(b) but, at the same time, has become so much more difficult to predict (in terms of timing and duration)
(A2) 366 days through calendar 2020
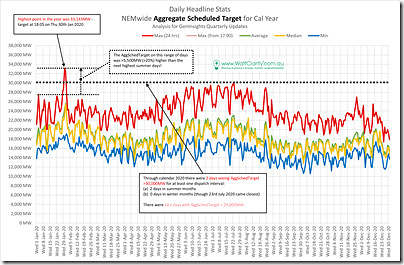
In that article of 31st May 2023 we included two charts particularly pertaining to calendar 2020 which are repeated here for ease of reference.
(A2a) Trended Daily Stats
Here’s the trended daily statistics for the 366 x days through calendar 2020 – pay particular attention to the daily maximum of AggSchedTarget.
In that prior article we noted the following:
‘There are two different stories in this year, by season:
1) In summer we see the cluster of extreme days around Thu 30th and Fri 31st Jan 2020:
(a) That saw an extreme level of AggSchedTarget in absolute terms;
(b) But which seems even more extreme when noting the peak level was over 5,500MW (i.e. more than 20%) higher than that required on any other summer day in the year
2) During winter there were no days exceeding 30,000MW – but there were a significant number of days not far below that level (which speaks to the greater level of consistency of requirement for AggSchedTarget during winter).’
Putting more specificity into the numbers for calendar 2020…
1) The highest daily maximum was on Thu 30th Jan 2020 (at 33,143MW … as you’ll see in more detail below).
2) The next highest daily maximum was on Fri 31st Jan 2020 (at 32,515MW … as you’ll see in more detail below).
3) Below those two days, the next highest were as follows:
(a) There were 12 x winter days with daily maximum AggSchedTarget in the range 29,000MW to 30,000MW;
(b) Specifically with respect to Q1 2020, the next highest were:
i. Wednesday 29th January at 28,990MW (i.e. below those 12 x winter days noted above)
ii. Saturday 1st February at 28,132MW (below a further 16 x winter days); immediately followed by…
iii. Tuesday 28th January at 28,144MW
… noting that this block of summer days (Tue 28th Jan to Sat 1st Feb) is contiguous and that there are no outliers.
(c) Looking further below these, we see…
i. A further 12 x winter days … i.e. that’s 40 x winter days that saw higher AggSchedTarget than the next Q1 or Q4 day that is ‘next highest’ below the range in that one single hot 5-day period (28th Jan to 1st Feb)!
ii. That was on 3rd January 2020…
… at which point the peak AggSchedTarget was 27,459MW (let’s keep that number in mind).
… which is fully 5,685MW (or 17%) below the level seen on Thu 30th Jan 2020!
… which gives some idea of the scale of the ‘Insurance-Style Firming Product’ required for those sorts of extreme events.
(A2b) Time-of-day stats
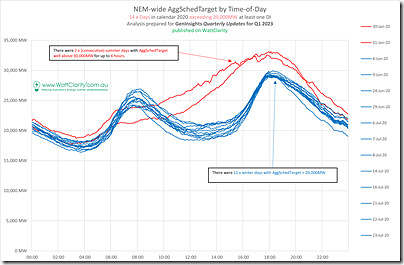
Here’s the time-of-day data for the 14 x days through calendar 2020 that saw AggSchedTarget peak above 29,000MW for at least one dispatch interval (i.e. the 2 x summer days that are the focus plus the 12 x winter days below that, and noted above):
Again in that prior article, we wrote:
‘This year is one of the most important ones to study, to gain a real sense of what the requirement is for installed capacity for scheduled plant and what type of plant might be required.
That’s because:
1) It’s the most recent period not heavily affected by La Nina (hence depressing Underlying Demand),
2) The period prior to March was also prior to the electricity demand effects of COVID-19 (e.g. lockdown induced demand destruction).
3) Because it’s most recent it has in-built the largest effect of the roll-out of wind and solar to this point … so any shape shown for AggSchedTarget should be [sentence unfinished!]
In that sense it’s important to note:
1) The 30th (reviewed here on the day) and 31st Jan (‘white knuckle ride’) 2020 were two extreme summer days what showed what is still possible in terms of the requirement for scheduled plant dispatch.
2) Also pay attention to the significant number of winter days seeing peak requirements.’
So, diving deeper in …
(B) Focusing in …
Of particular interest is the last week in January … but worthwhile flagging commentary written at the time with respect to both Thursday 30th January 2020 (reviewed here on the day) and Friday 31st January 2020 (‘white knuckle ride’). Two very extreme days…
(B1) The last week in January 2020
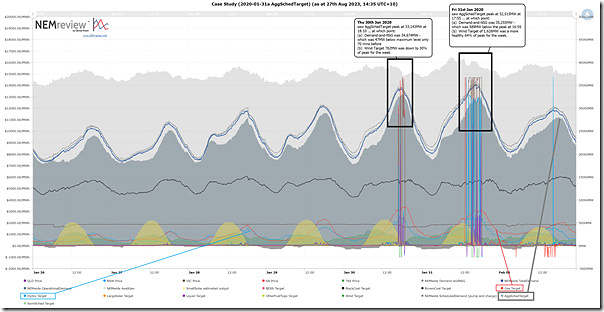
Here’s a trend of NEMwide data (produced in NEMreview v7 … a copy of this chart clients can open here) of the 7 day period ending Sunday 2nd February 2020, with the two days in question clearly standing out from a supply/demand and price outcome point of view:
(click on the image for a larger-sized view)
We’ve annotated this chart with a few key pieces of information, which will be discussed further below.
(B2) Just Thu 30th and Fri 31st Jan 2020
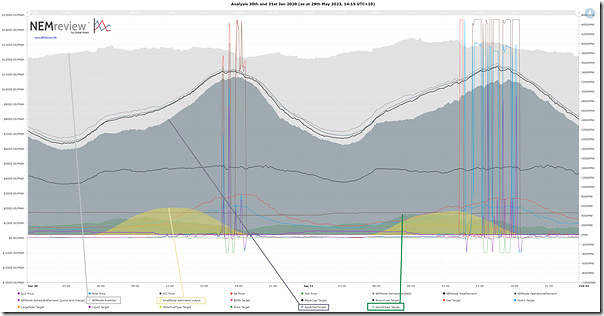
Zooming this chart in to just span Thursday 30th and Friday 31st January 2020 we see the following…
We’ll now take this data, and look at each of these two days in turn…
(B2a) Thursday 30th January 2020
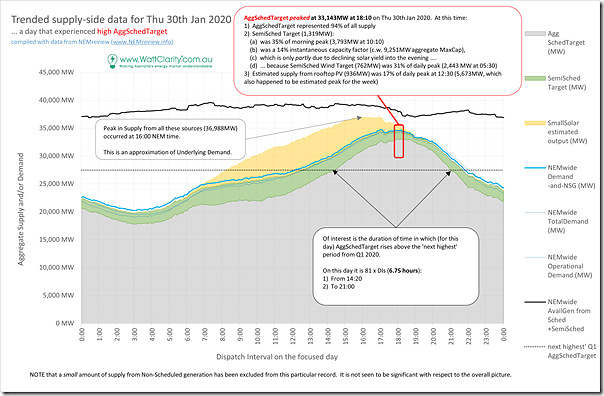
Taking the data just for Thursday 30th January 2020 into Excel and adding a bit more analysis, we see the following pattern for the day.
With respect to the comments on the image:
1) As an approximation of ‘Underlying Demand’ , the peak in supply from all* the sources shown (36,988MW) occurred at 16:00 NEM time on the day.
* keeping in mind in this analysis we’ve excluded a small visible contribution from Non-Scheduled Generation (which does not receive any form of Target). This is not significant with respect to the overall picture.
2) AggSchedTarget peaked at 33,143MW at 18:10 on Thu 30th Jan 2020. At this time:
(a) AggSchedTarget represented 94% of all supply
(b) SemiSched Target (1,319MW):
(i) was 35% of morning peak (3,793MW at 10:10)
(ii) was a 14% instantaneous capacity factor (c.w. 9,251MW aggregate MaxCap),
(iii) which is only partly due to declining solar yield into the evening ….
(iv) … because SemiSched Wind Target (762MW) was 31% of daily peak (2,443 MW at 05:30)
(c) Estimated supply from rooftop PV (936MW) was 17% of daily peak at 12:30 (5,673MW, which also happened to be estimated peak for the week)
3) Of interest is the duration of time in which (for this day) AggSchedTarget rises above the ‘next highest’ period from Q1 2020*. On this day it is 81 x DIs (6.75 hours):
(a) From 14:20
(b) To 21:00
… this could be thought of as a useful measure in determining the the scale of the ‘Insurance-Style Firming Product’ required for those sorts of extreme events.
* as noted above, the ‘Next Highest’ period was 3rd January 2020 and a peak AggSchedTarget of 27,459MW.
(B2b) Friday 31st January 2020
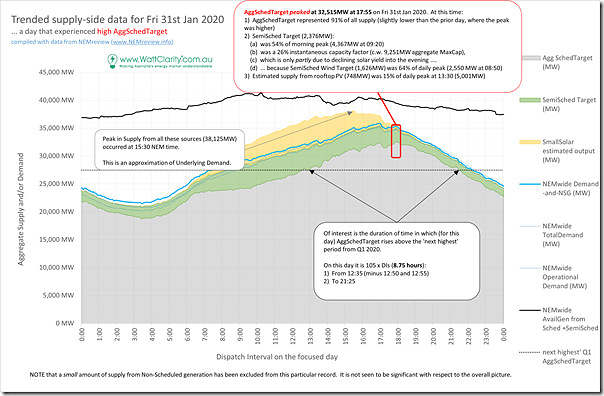
The level of peak AggSchedTarget was slightly lower the following day – as shown as follows…
Again with respect to the comments on the image:
1) Our estimate of ‘Underlying Demand’ (38,125MW) occurred at 15:30 NEM time .
2) AggSchedTarget peaked at 32,515MW at 17:55 on Fri 31st Jan 2020. At this time:
(a) AggSchedTarget represented 91% of all supply (slightly lower than the prior day, where the peak was higher)
(b) SemiSched Target (2,376MW):
(i) was 54% of morning peak (4,367MW at 09:20)
(ii) was a 26% instantaneous capacity factor (c.w. 9,251MW aggregate MaxCap),
(iii) which is only partly due to declining solar yield into the evening ….
(iv) … because SemiSched Wind Target (1,626MW) was 64% of daily peak (2,550 MW at 08:50)
… i.e. with wind doing much better than the day before.
(c) Estimated supply from rooftop PV (748MW) was 15% of daily peak at 13:30 (5,001MW)
3) The duration of the ‘Insurance-Style Firming Product’ was in this case 8.75 hours … i.e. :
(a) A total of 105 x DIs (8.75 hours):
(b) Beginning the 12:35 Dispatch Interval and spanning (minus 12:50 and 12:55) to 21:25.
(C) Big challenges!
We hope that illustrating the situation through the (COVID and La Nina-affected) year of calendar 2020, and zooming into the extreme days of Thursday 30th and Friday 31st January 2020 will give some idea of the challenges that are facing us moving forwards into the energy transition…
… stay tuned for the release of the 2023 ESOO tomorrow…


Leave a comment