
Reminded by Enel-X’s post last week on their involvement in the relatively new wholesale demand response (WDR, aka “negawatt”) mechanism, this article casts an eye over what’s happened since it began on 24 October 2021.

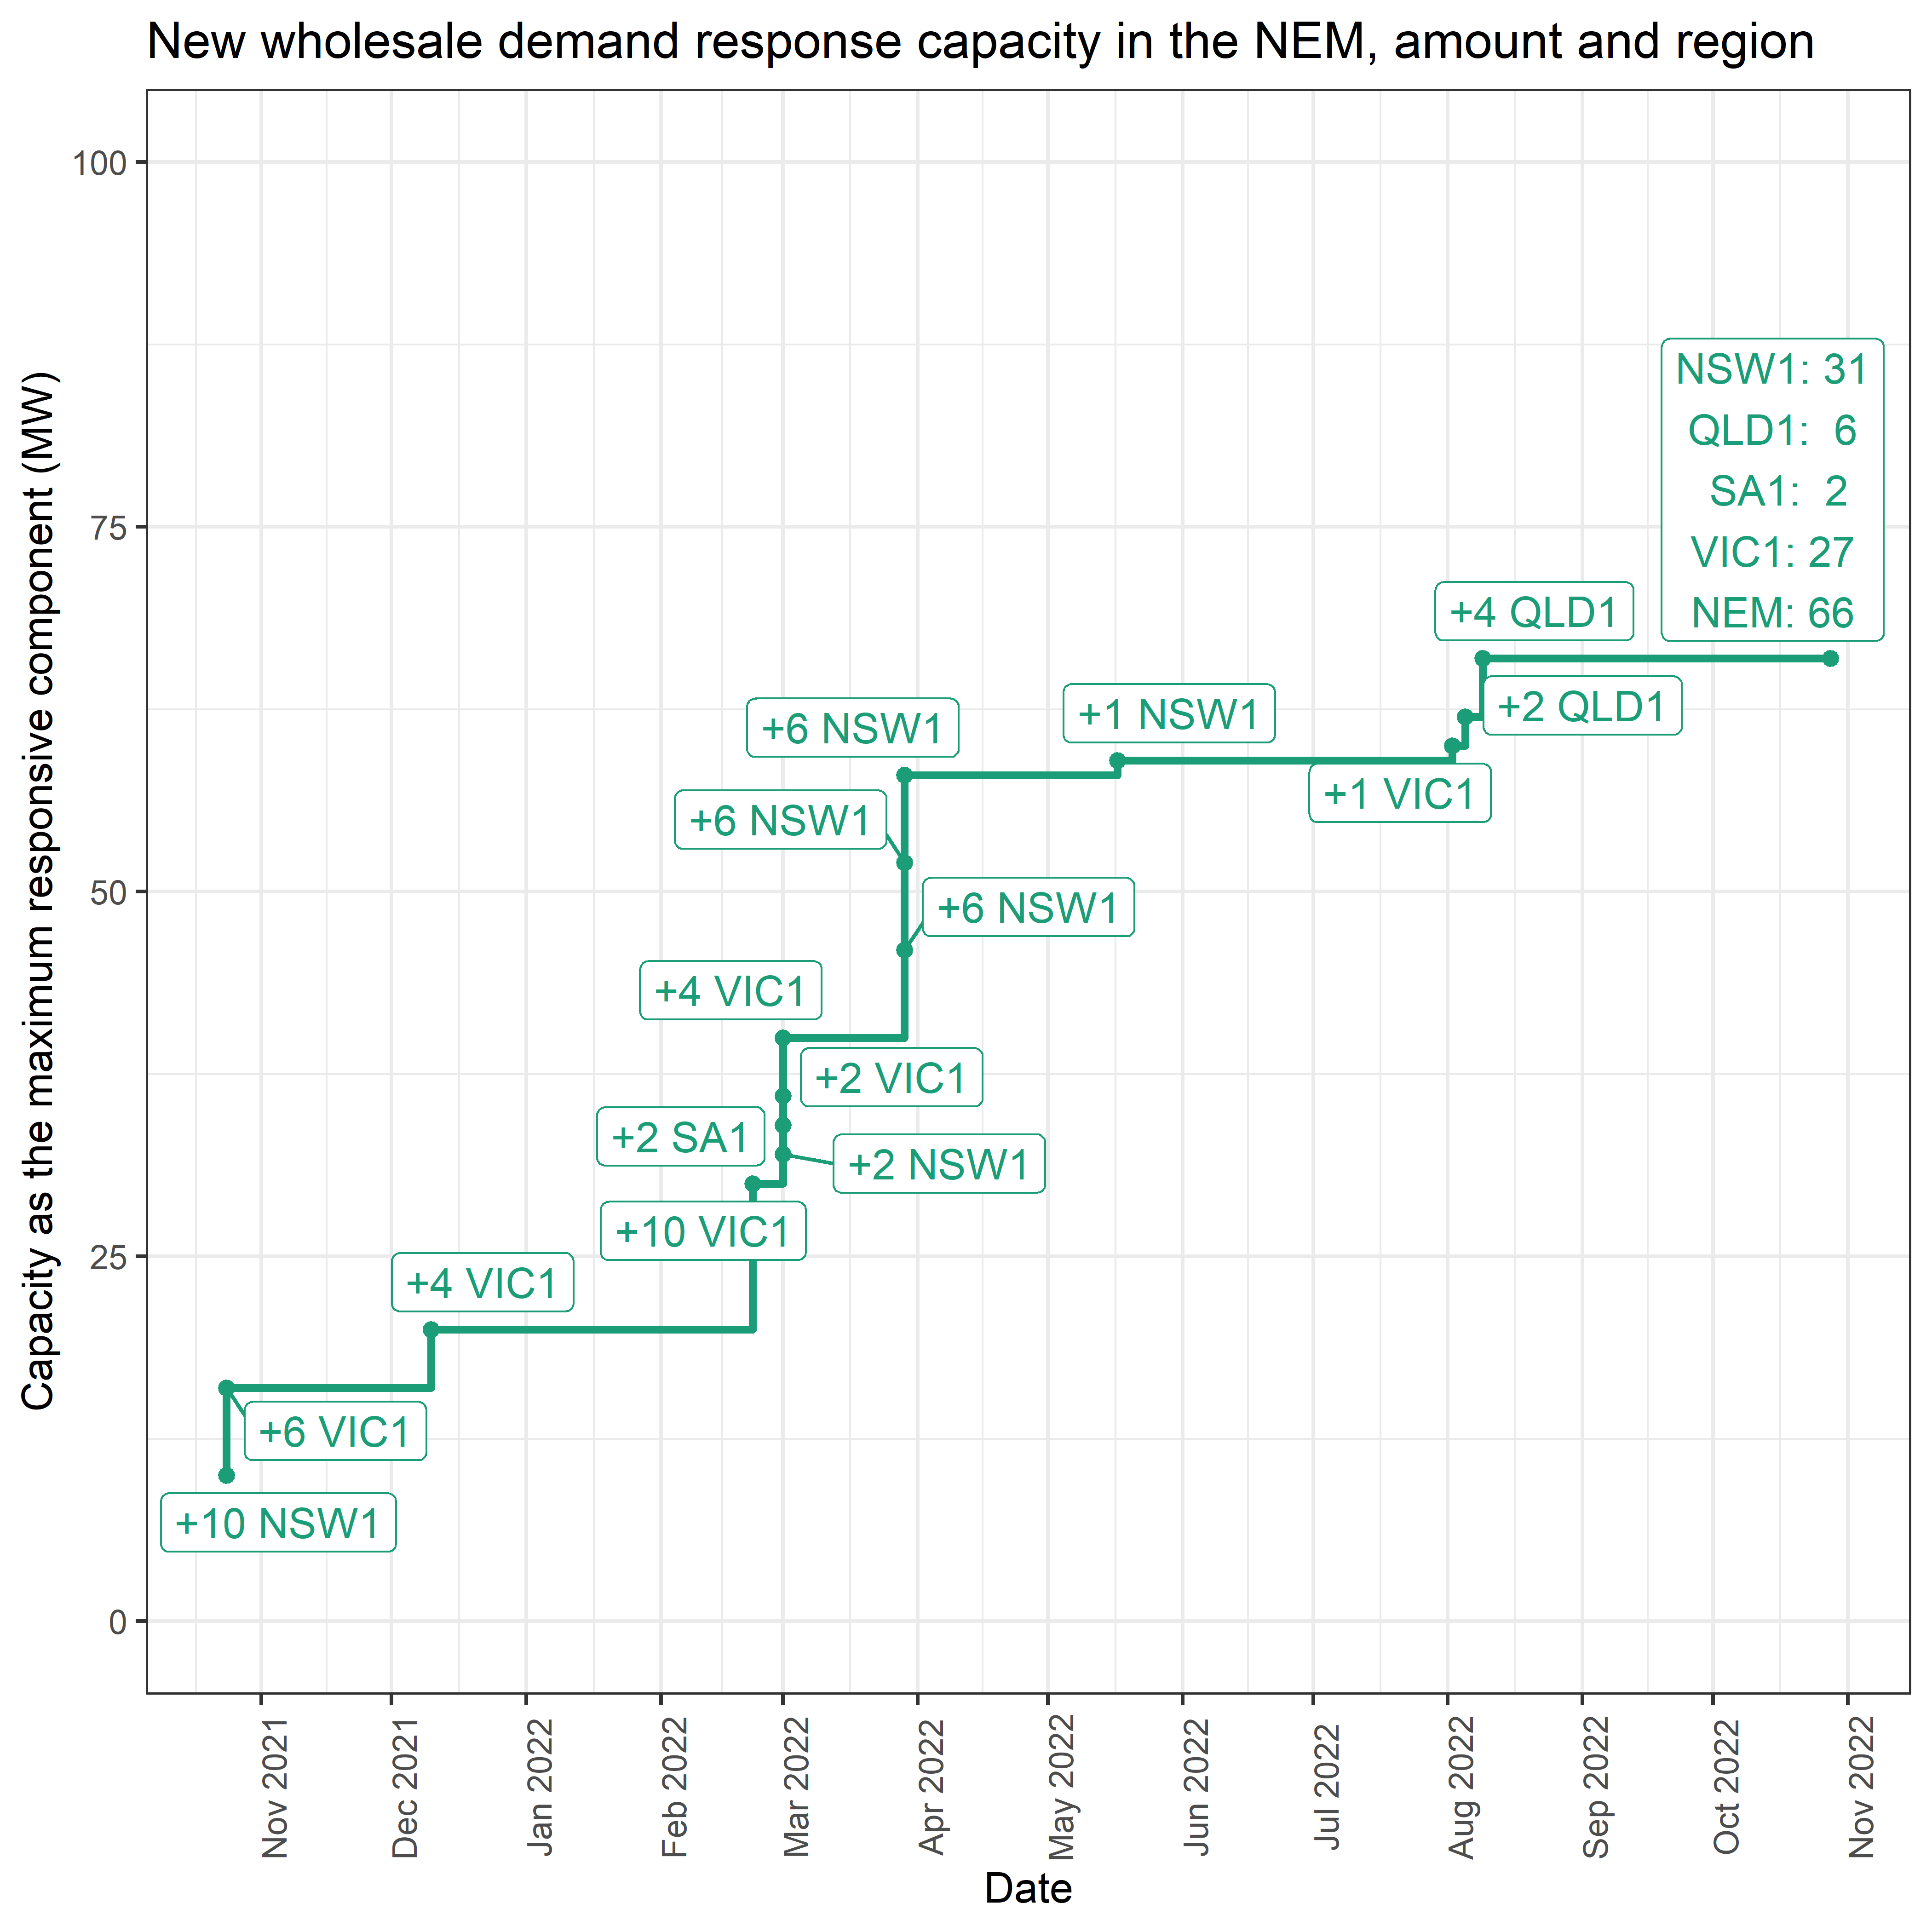
To-date, we’ve seen the registration of 66 MW of response capacity from 12 demand response units
The vast majority of WDR capacity is registered in the NSW and VIC regions. All registered units, to date, are registered with Enel-X as the market participant. We recall that the WDR mechanism involves energy consumption reductions, and not provision of frequency and ancillary services (FCAS).
On average, the registrations equated to 5.5 MW per month. Yet, as the chart below indicates, the actual registration rate fluctuated. There was a 4-month period with very little new capacity being registered between 1 April and 1 August 2022. And the most recent addition (4 MW in QLD) was back in August.
There’s been activity since the early days of 2021
Dispatch of negawatts was rare in the early days. The first occasion was discussed in a review published at the end of 2021. Late in January (the 31st) a WDR event linked to high prices driven by restricted interregional flows was captured in this article. We also note there were no QLD WDR units registered and available to assist early in February 2022 when a different kind of demand-side response was triggered during heatwave conditions in QLD (on 1 February 2022).
All up, over the last year (since commencement) WDR was dispatched on 32 days.
Over the 32 days when WDR dispatch occurred:
- Dispatched energy totaled 570 MWh.
- Dispatch targets amounting to 414 MWh were issued at prices greater than 300 $/MWh.
- Targets for 1.3 MWh were dispatched at the market price cap of 15,500 $/MWh (12 July 2022 18:05).
- The lowest-priced dispatch instructions summed to 0.3 MWh on an occasion when the price dropped to 0 $/MWh (an assumed test event on 12 November 2021).
- Total spot revenue (since 24 October 2021) amounts to $985 thousand. [Note that energy spot market revenue is assumed. It is derived by assuming every dispatch target is met by WDR units. Actual market revenue is determined by AEMO in an ex-post process using metered energy and calculated baseline energy consumption.]
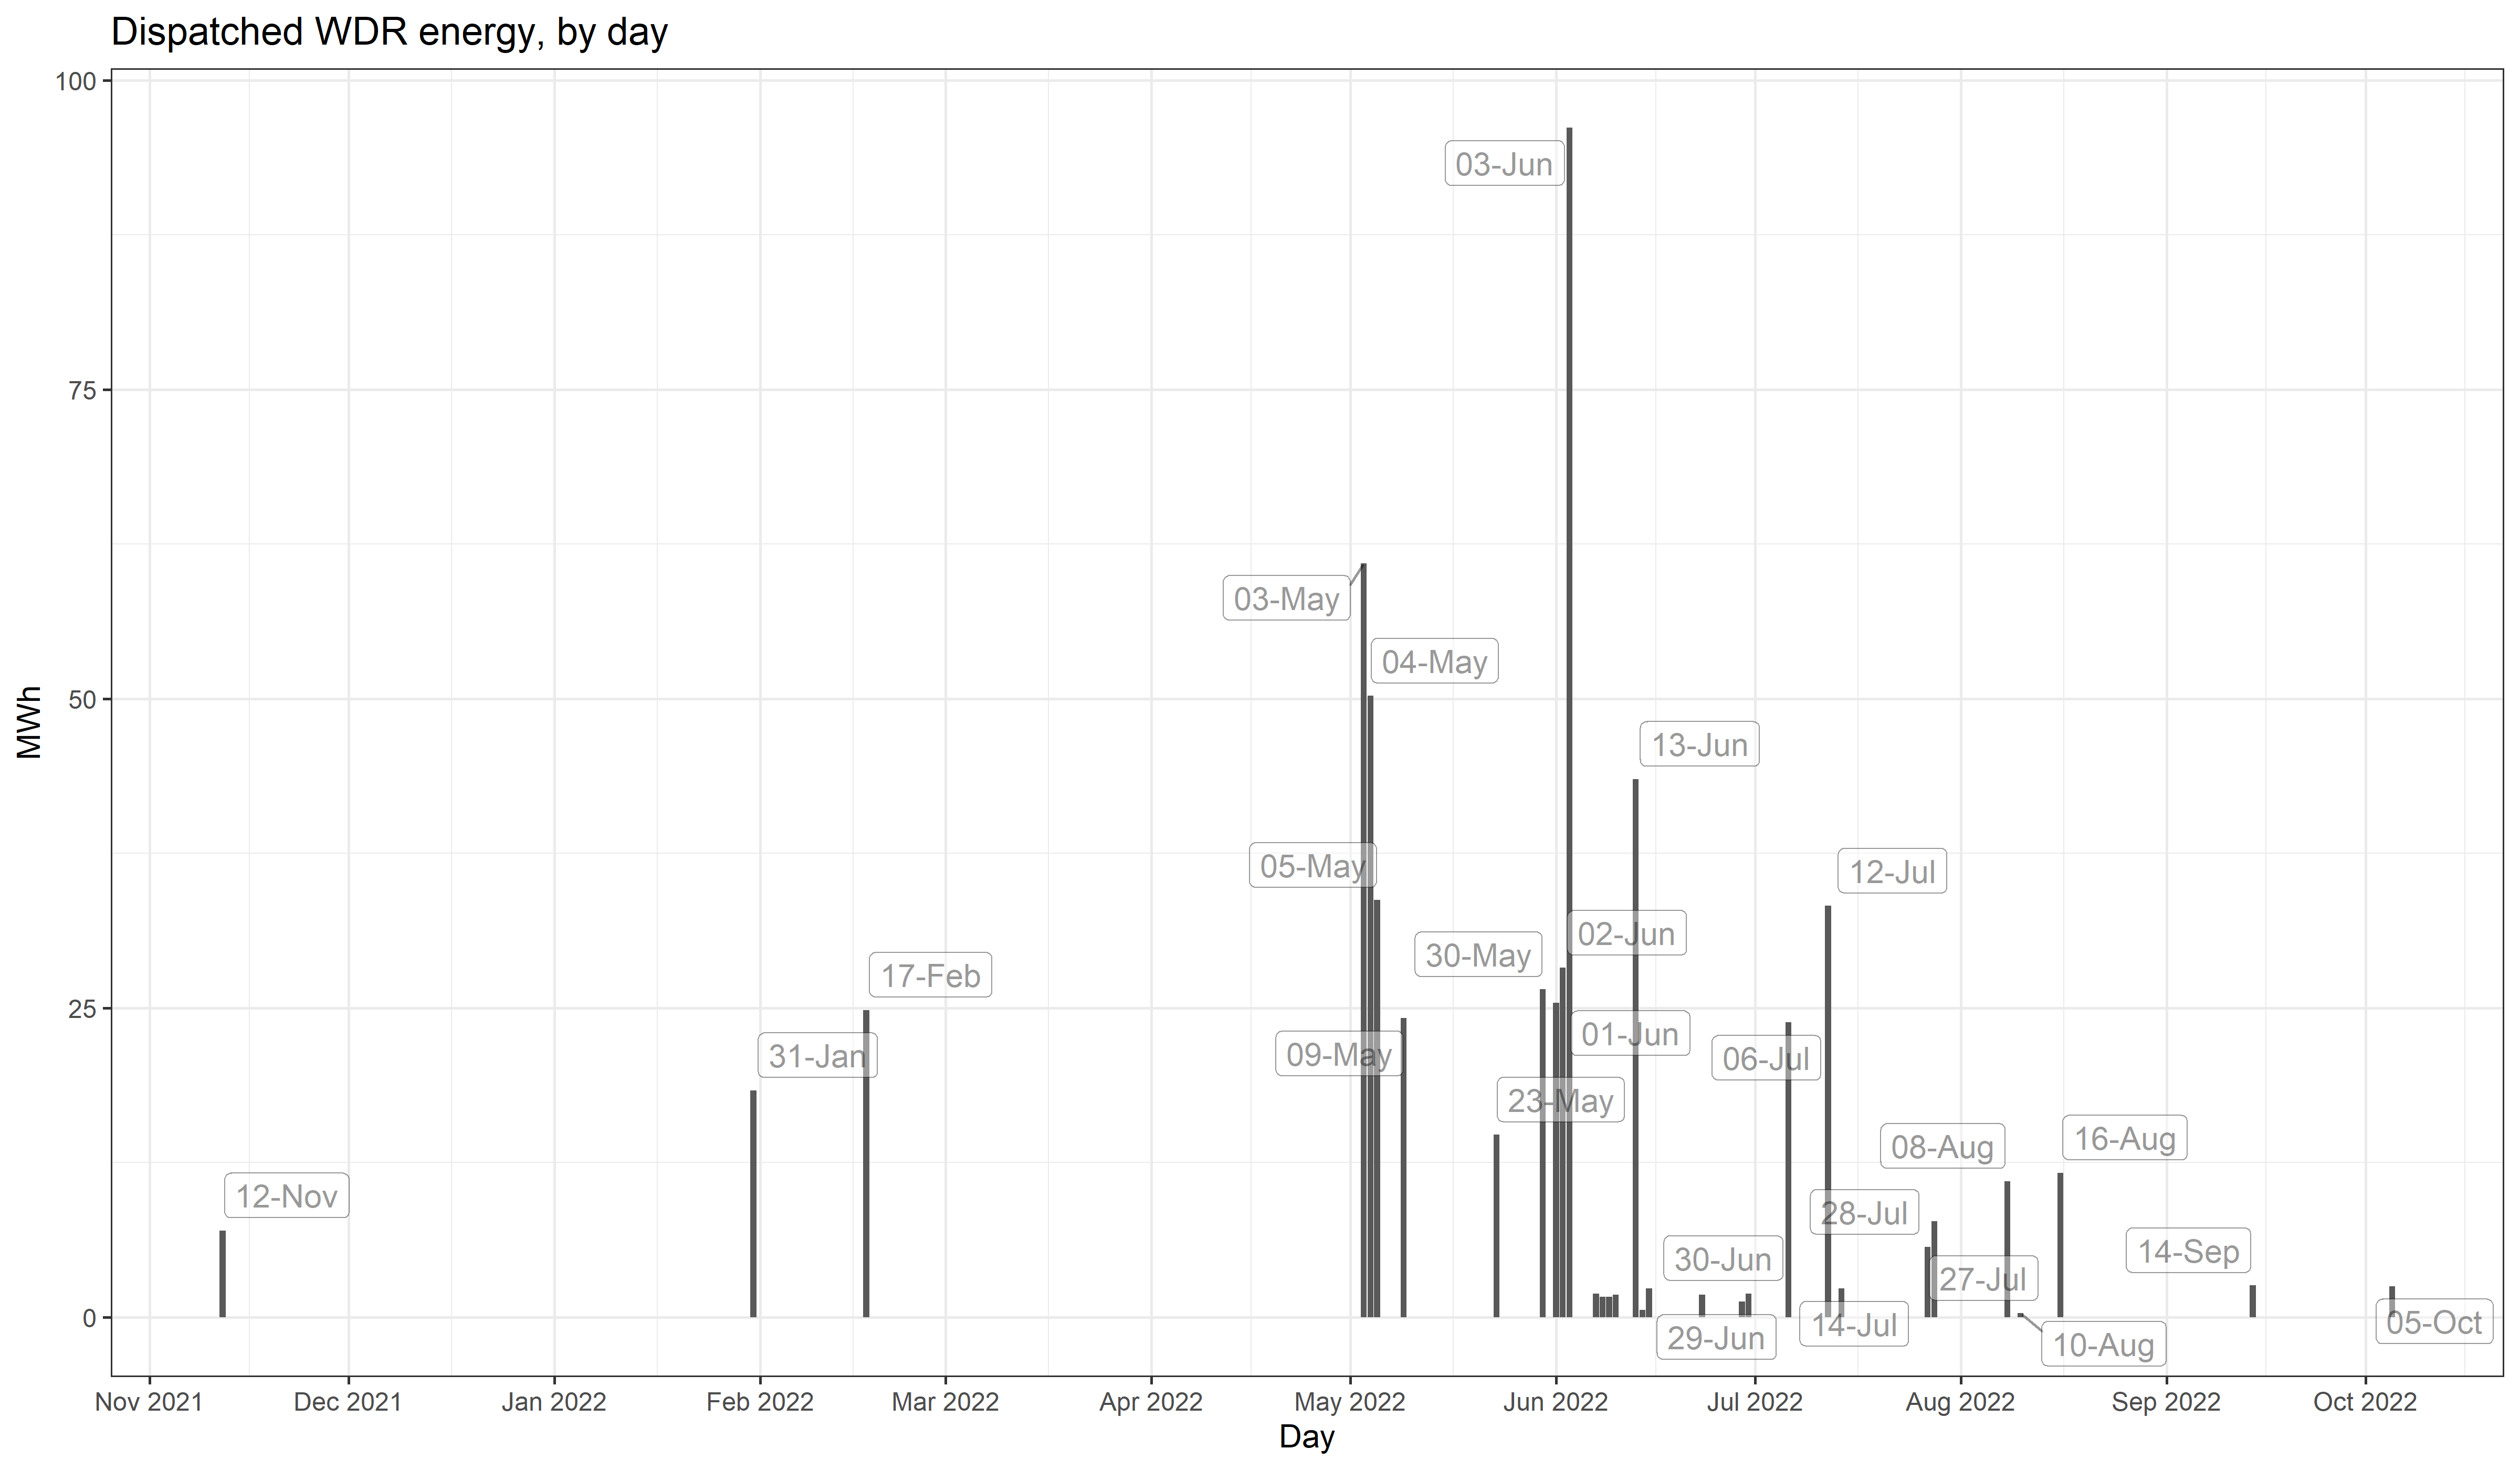
A high point for WDR energy dispatched (daily) occurred on June 3, 2022
Aggregating negawatt dispatch instructions to the NEM, and by day, the following chart uncovers:
- Dispatched energy reached a high point on 3 June 2022, 96 MWh.
- Early May and June saw repeated days where WDR was dispatched.
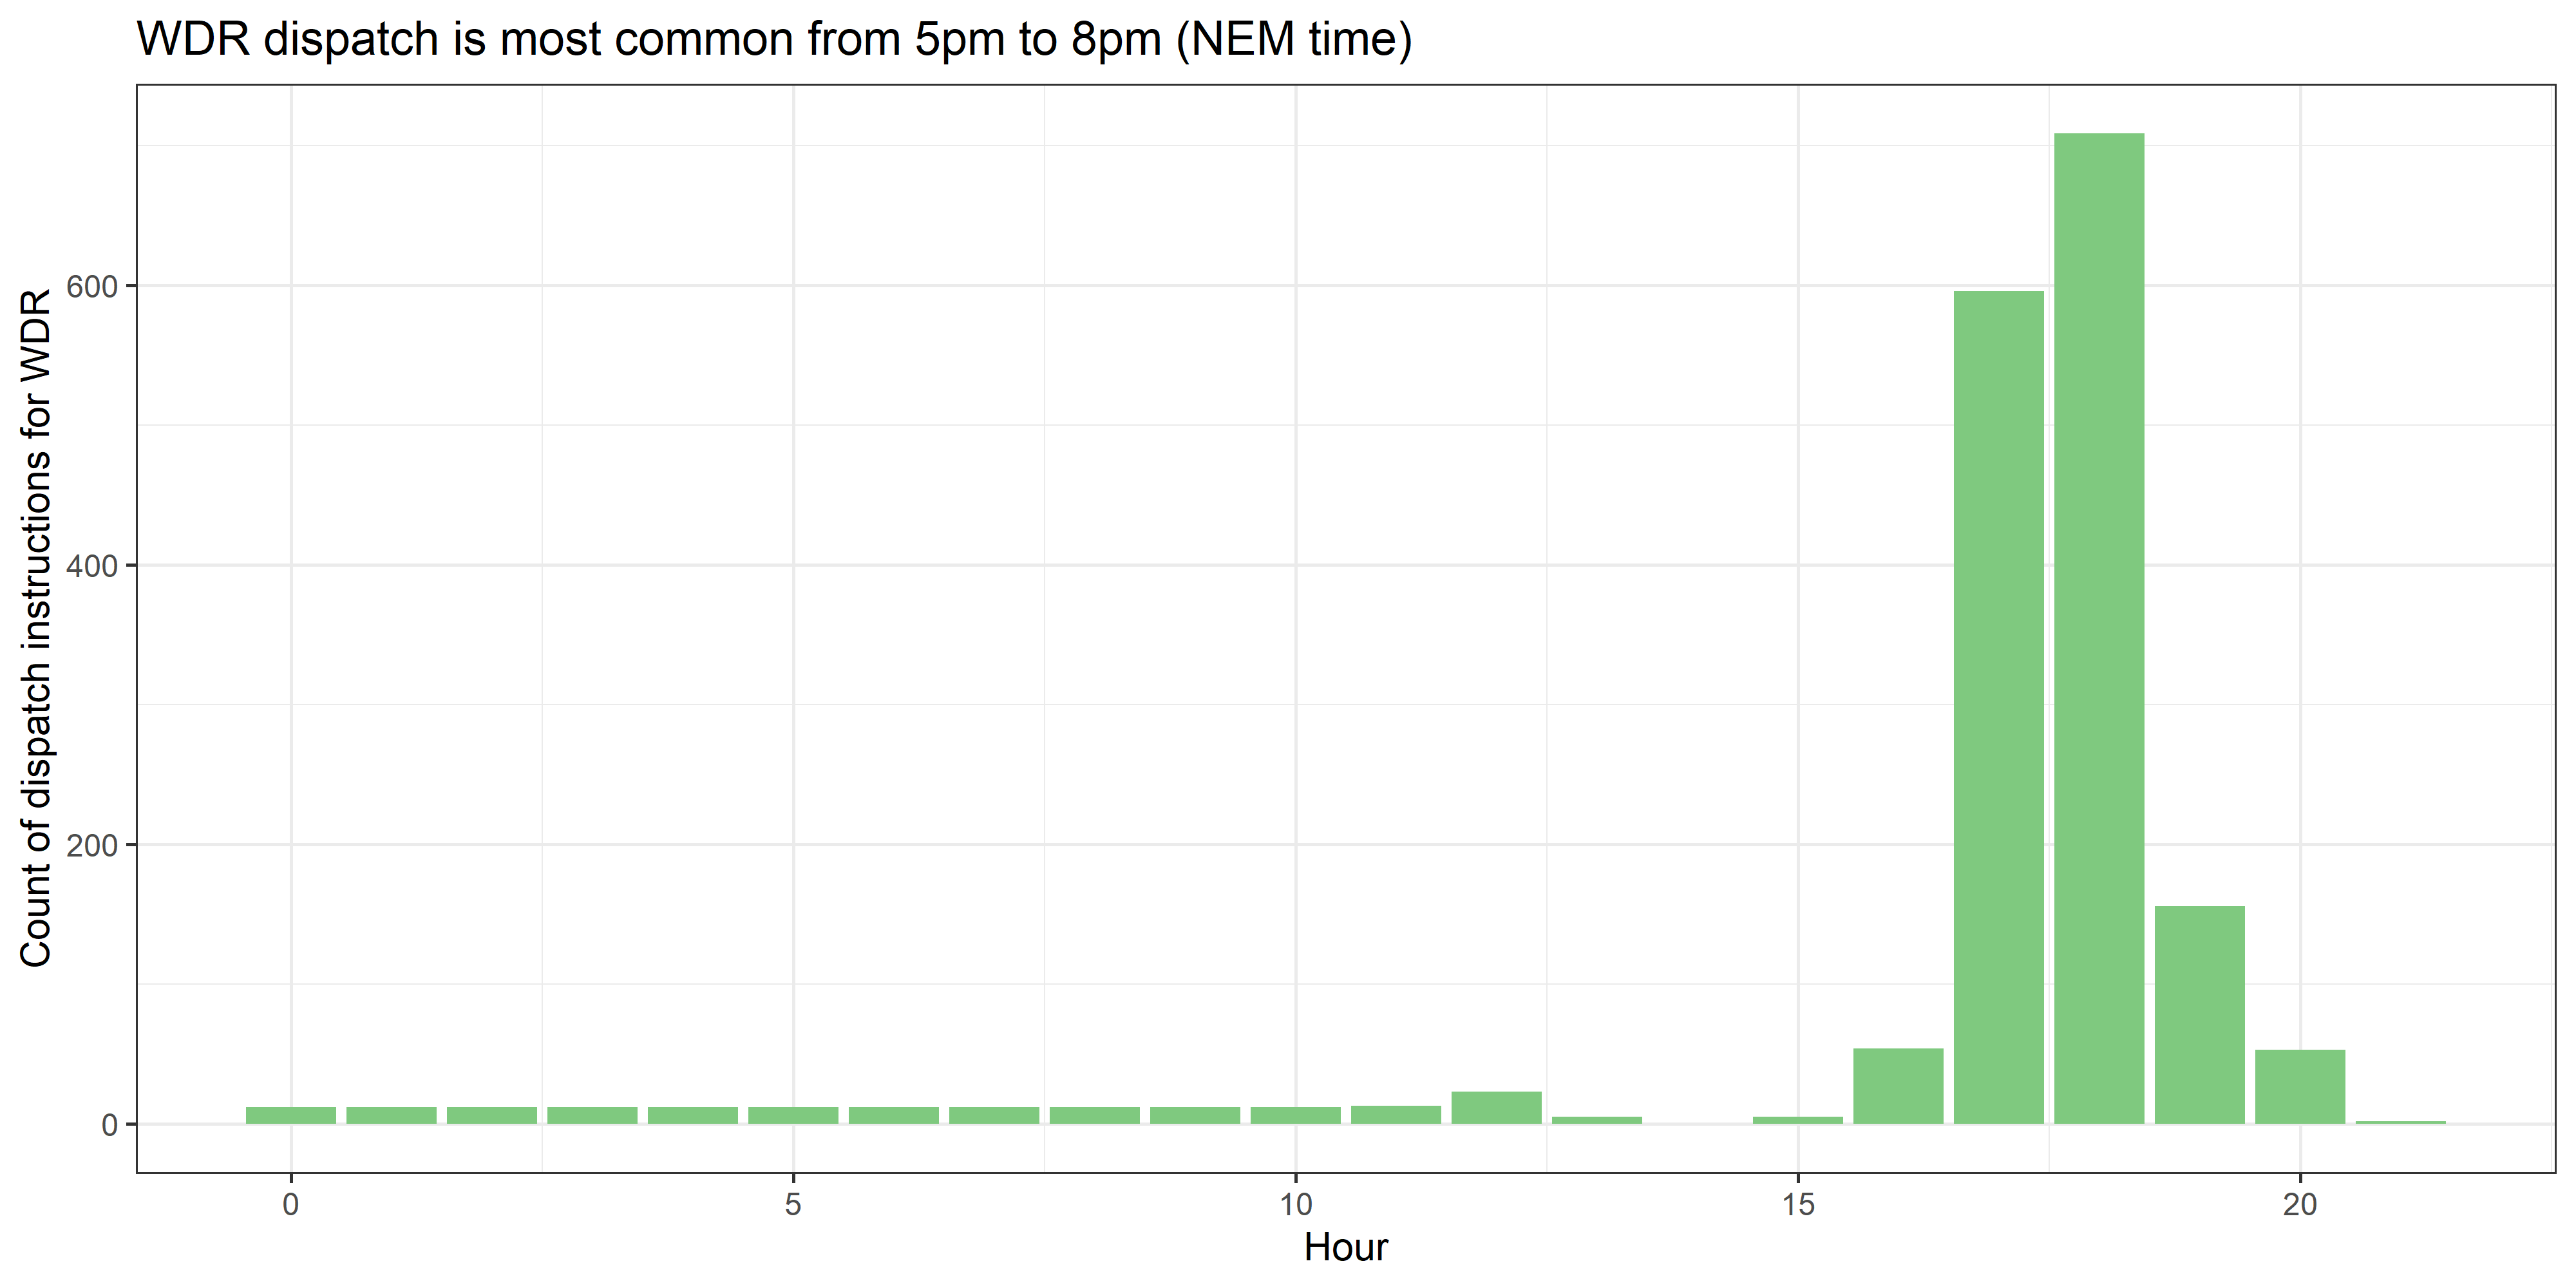
The time of day for WDR dispatch has typically been between 5pm and 8pm
While we know, from prior case studies, that high prices generally involve many market and network factors, the next chart finds the occurrence of WDR dispatch is usually between 5pm and 8pm. This matches the timing of the intersection between the afternoon ramp-down in solar generation and the evening load peak.
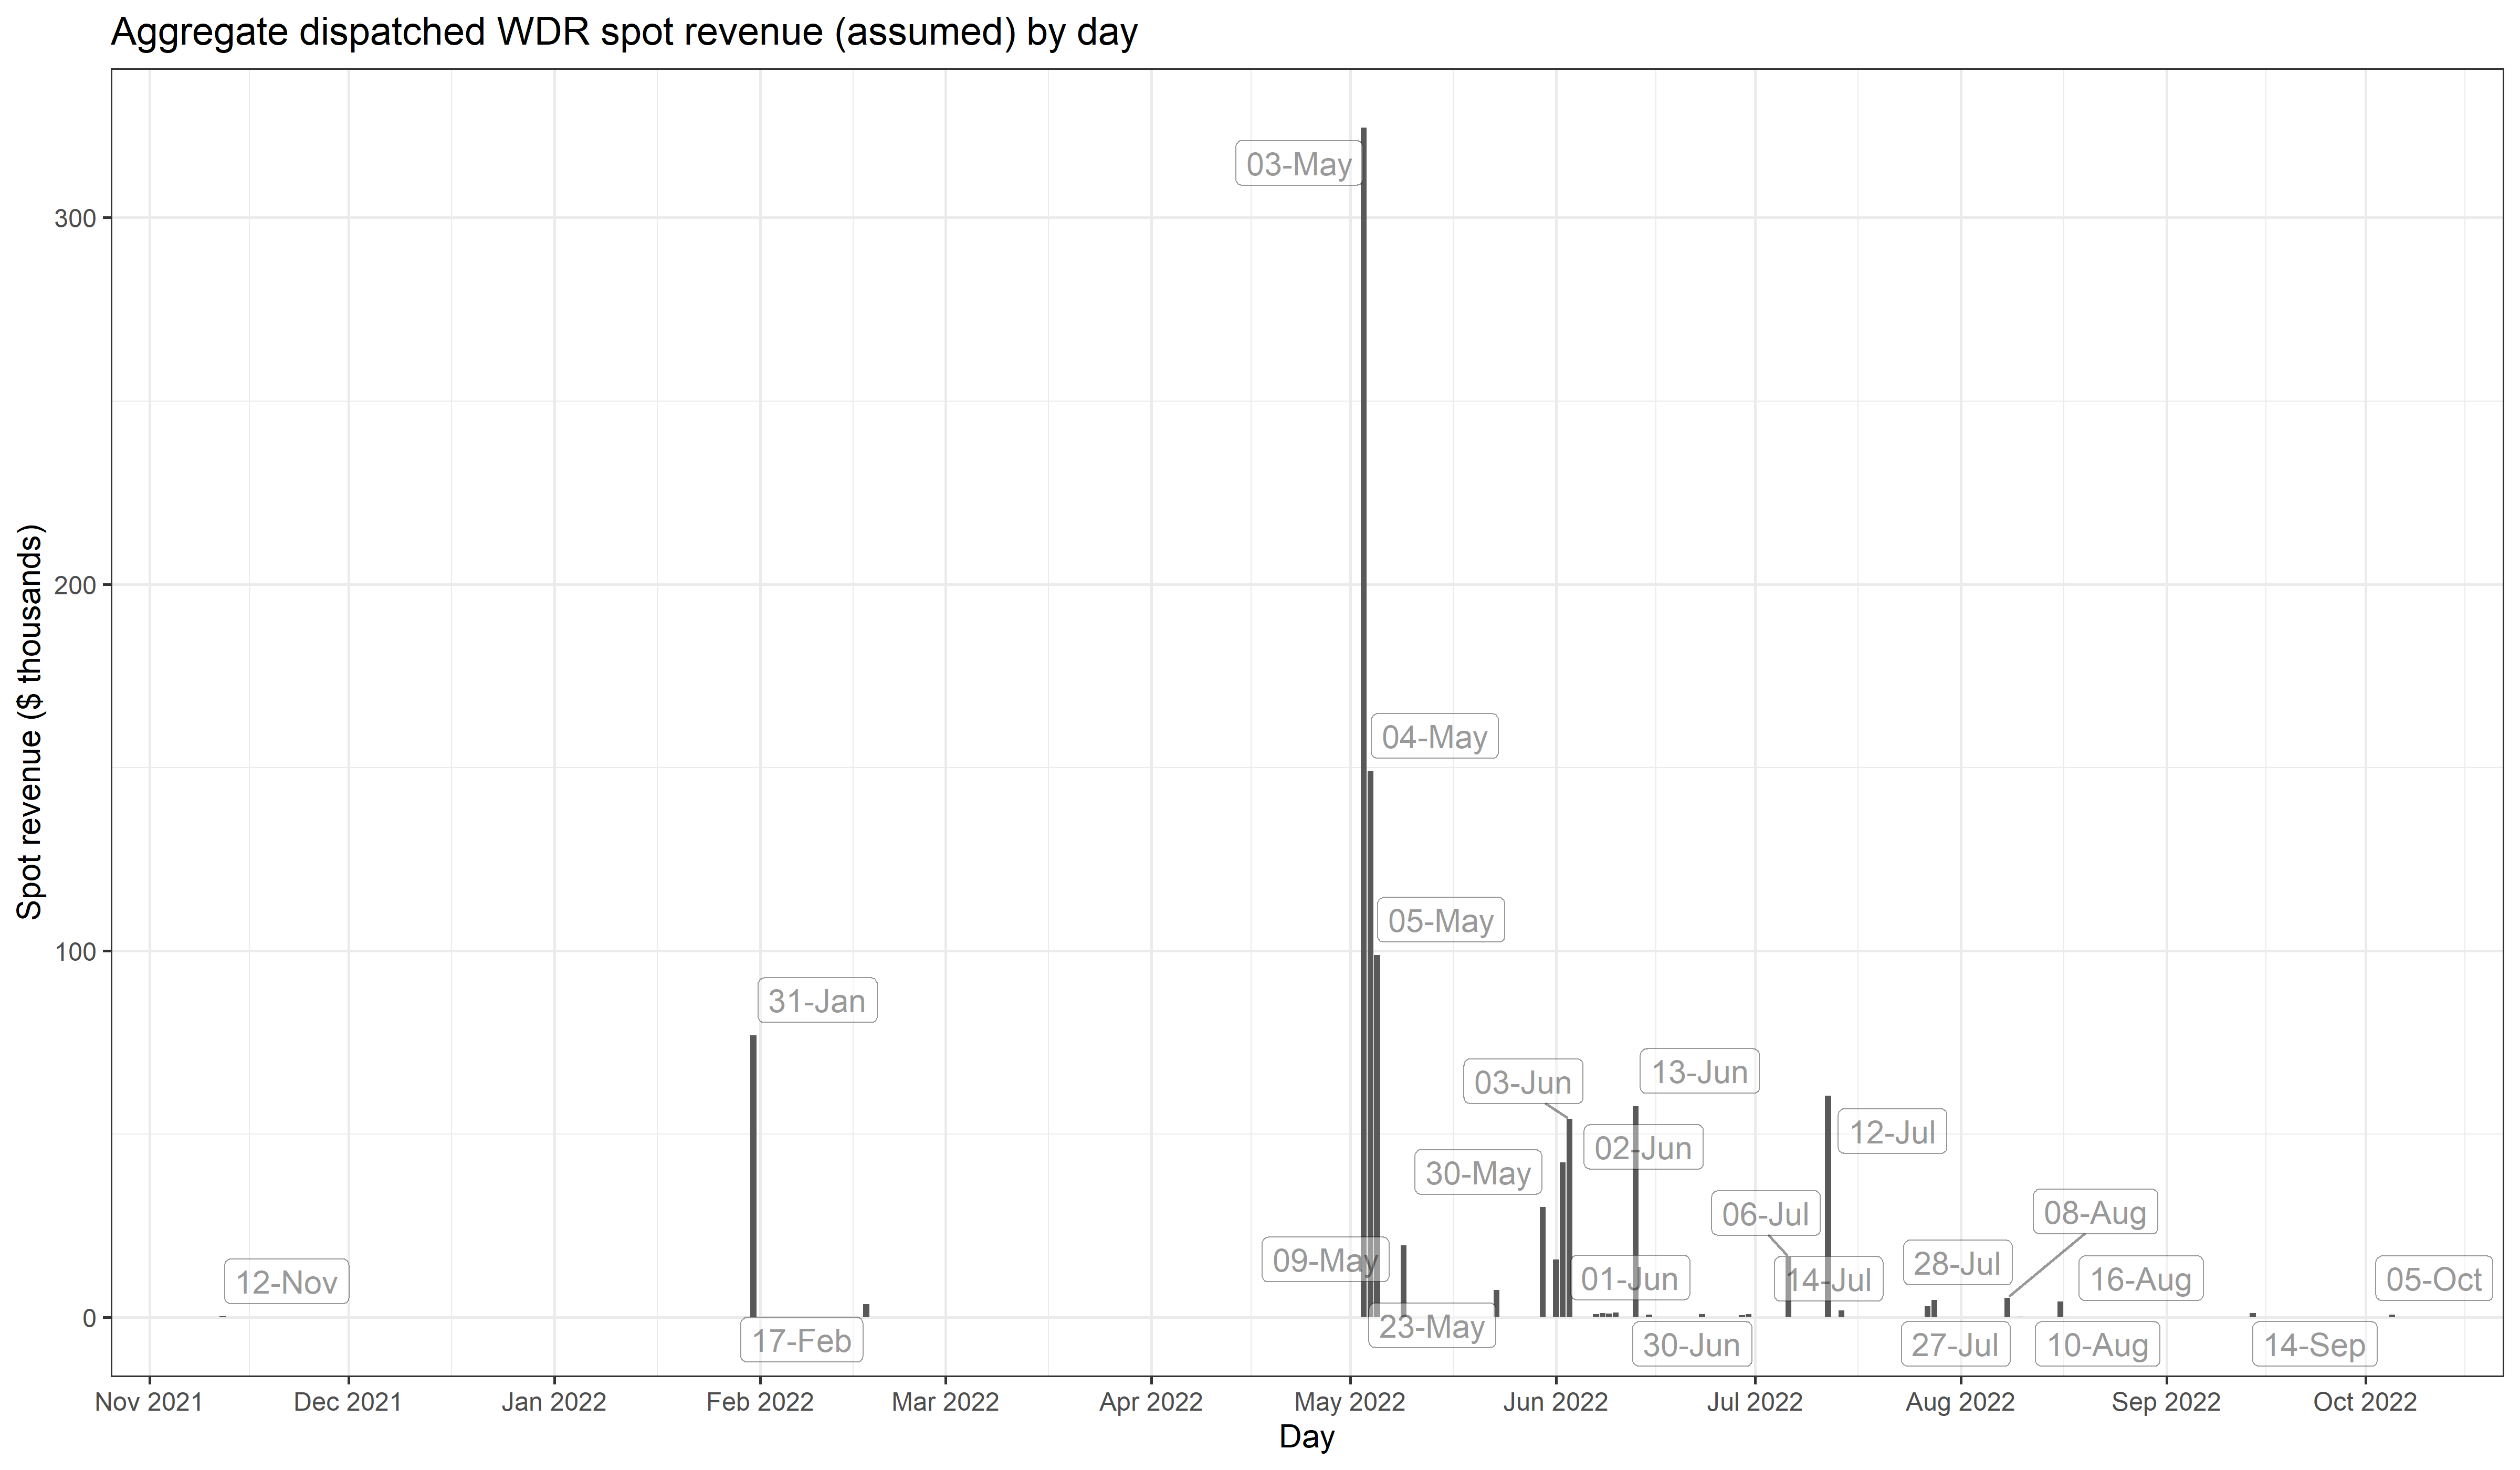
Spot revenues were strongest between May and September 2022
There was extreme high-price volatility during Q2 and Q3 2022. Yet there were also periods (June) where the cumulative price threshold was reached triggering the administered pricing caps of $300/MWh and price scaling in some regions. Later, spot market suspension ran from 15 June 2022 to 24 June 2022 with prices determined according to the published market suspension pricing schedule.
The volume-weighted average spot price for all negawatt dispatch events, since mechanism-start, was 1,729 $/MWh. The median price was 541 $/MWh. And excluding 12 November 2021, aggregating by day, the volume-weighted average prices were all greater than or equal to$300/MWh
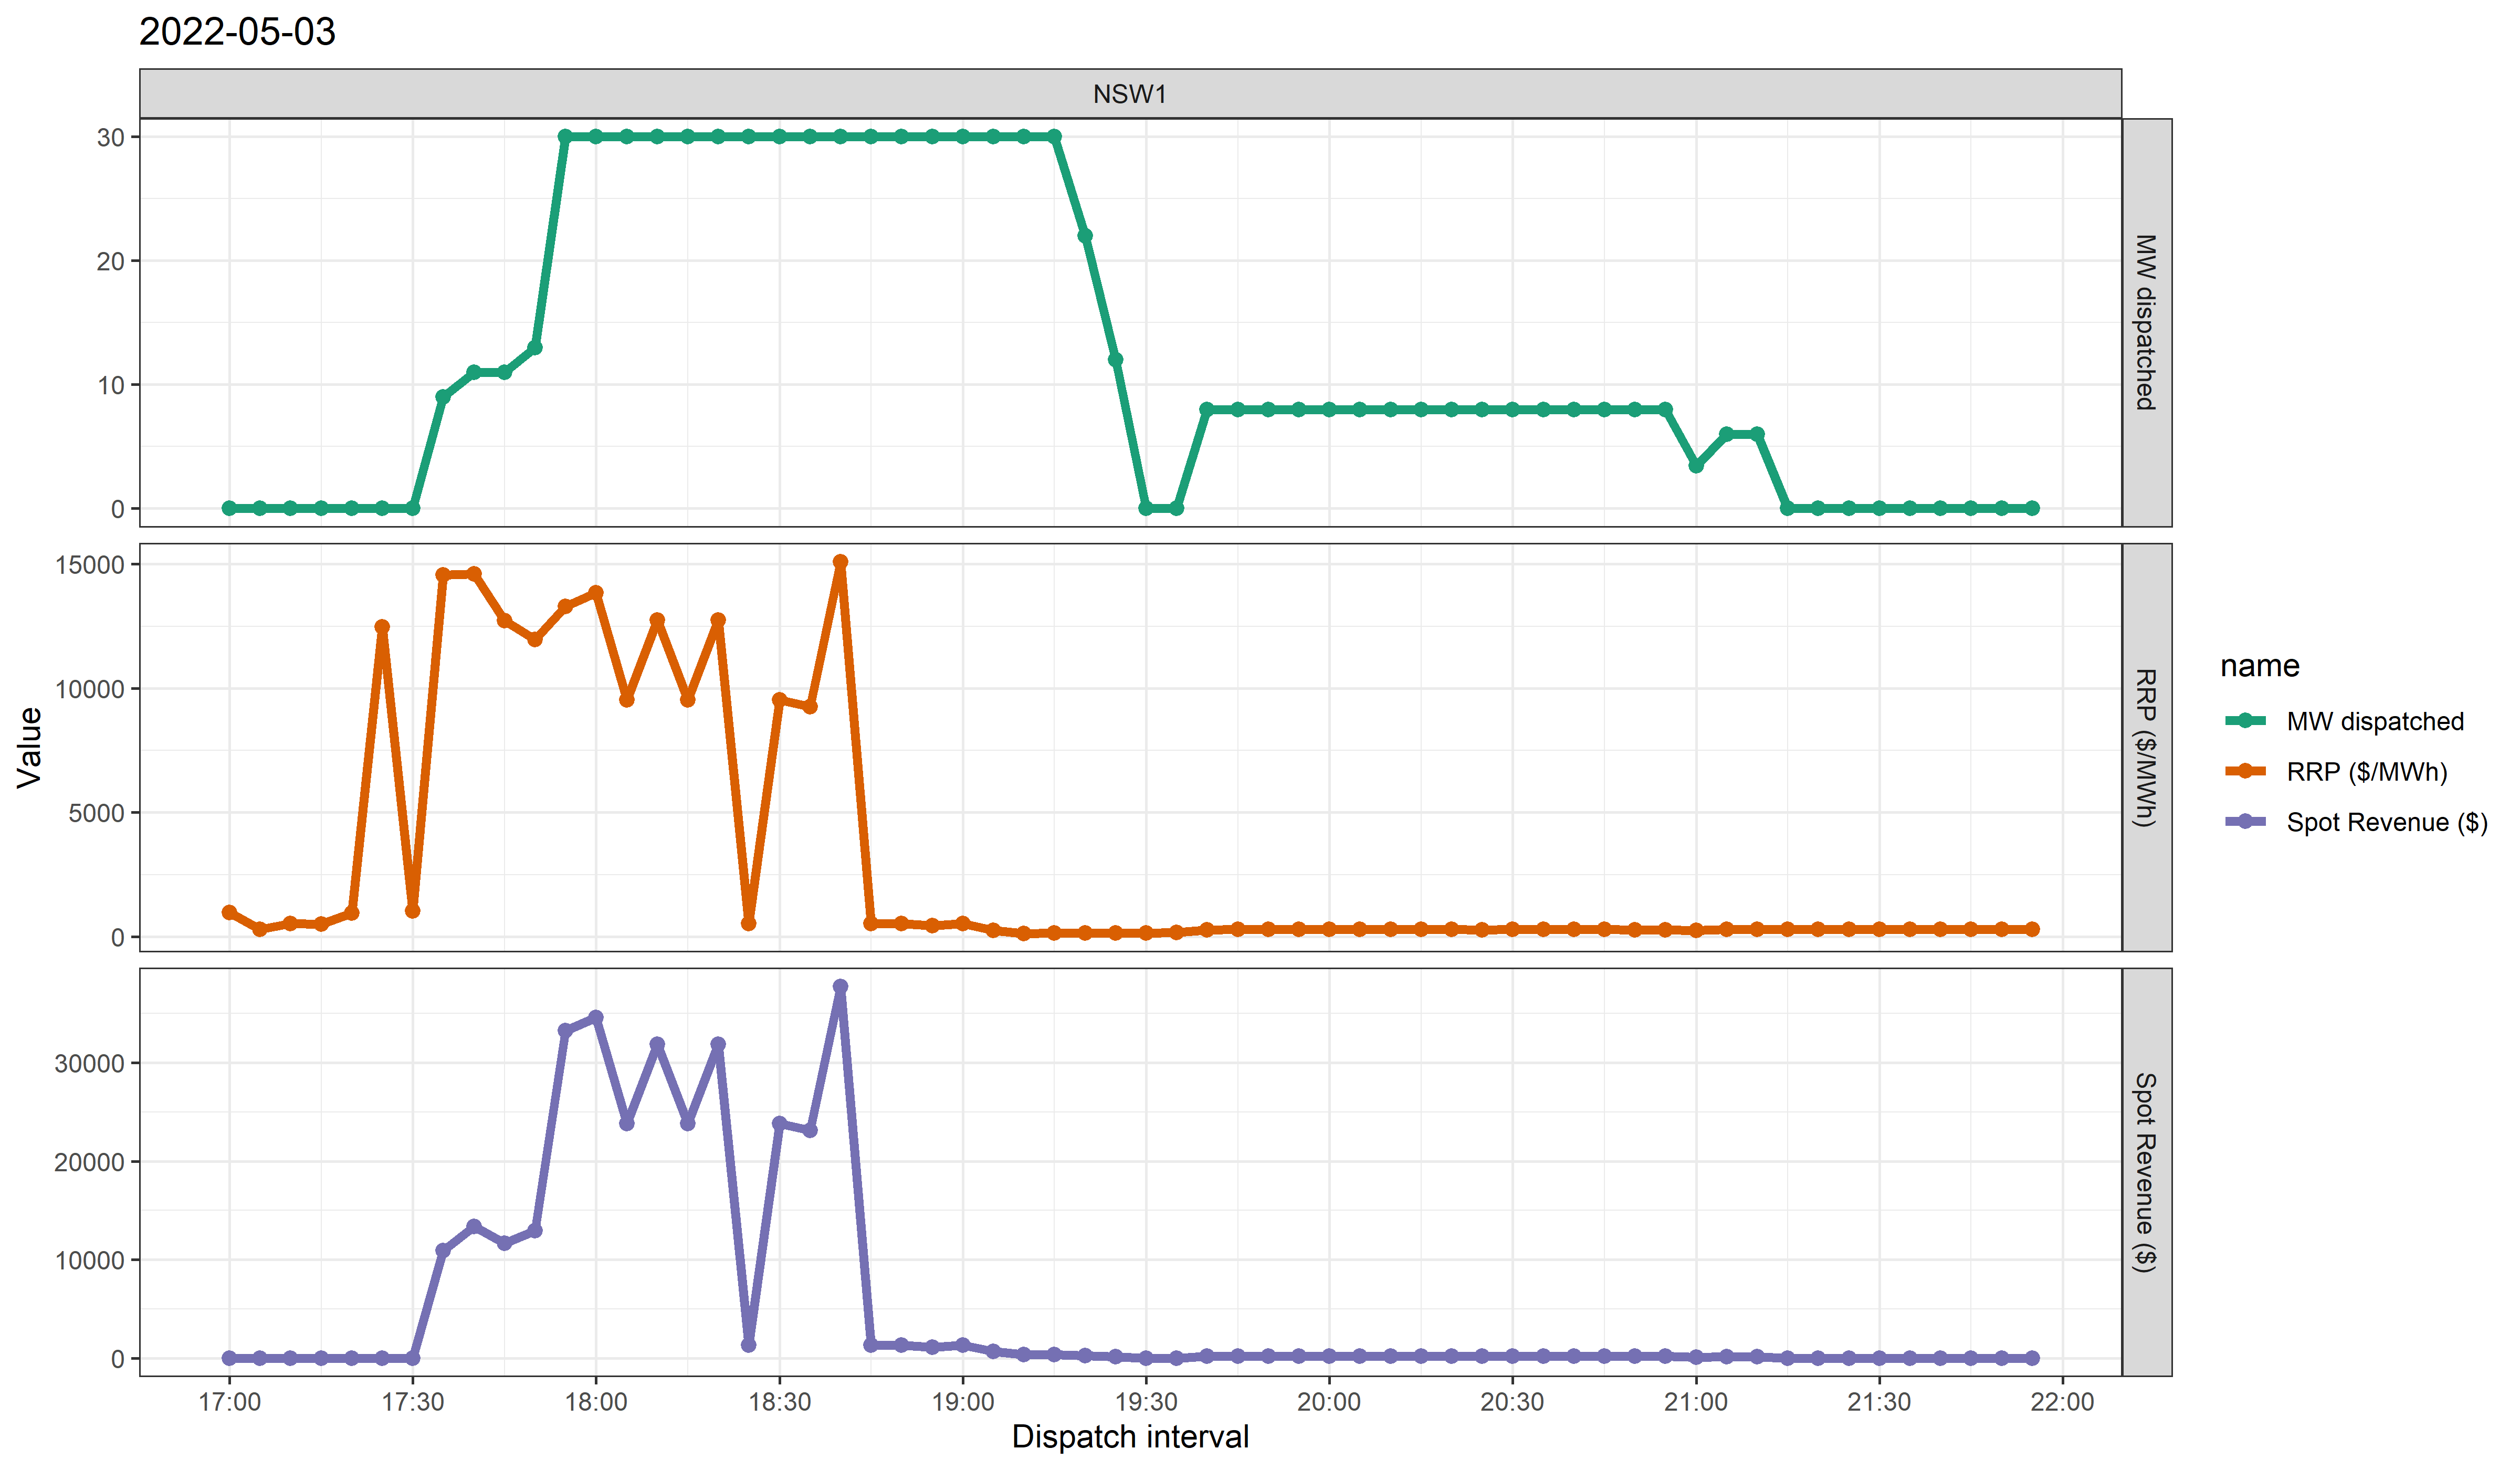
The following chart shows aggregate daily spot revenue for WDR peaked on 3 May at $325 thousand. On this day, many evening dispatch intervals were above 10,000 $/MWh in NSW.
A closer look at 3 May
A closer look at 3 May, chosen because this was the day when the highest spot revenue was earned, shows WDR units in NSW capitalized on high spot prices in the evening.
This period of price volatility was noted on Watt Clarity.
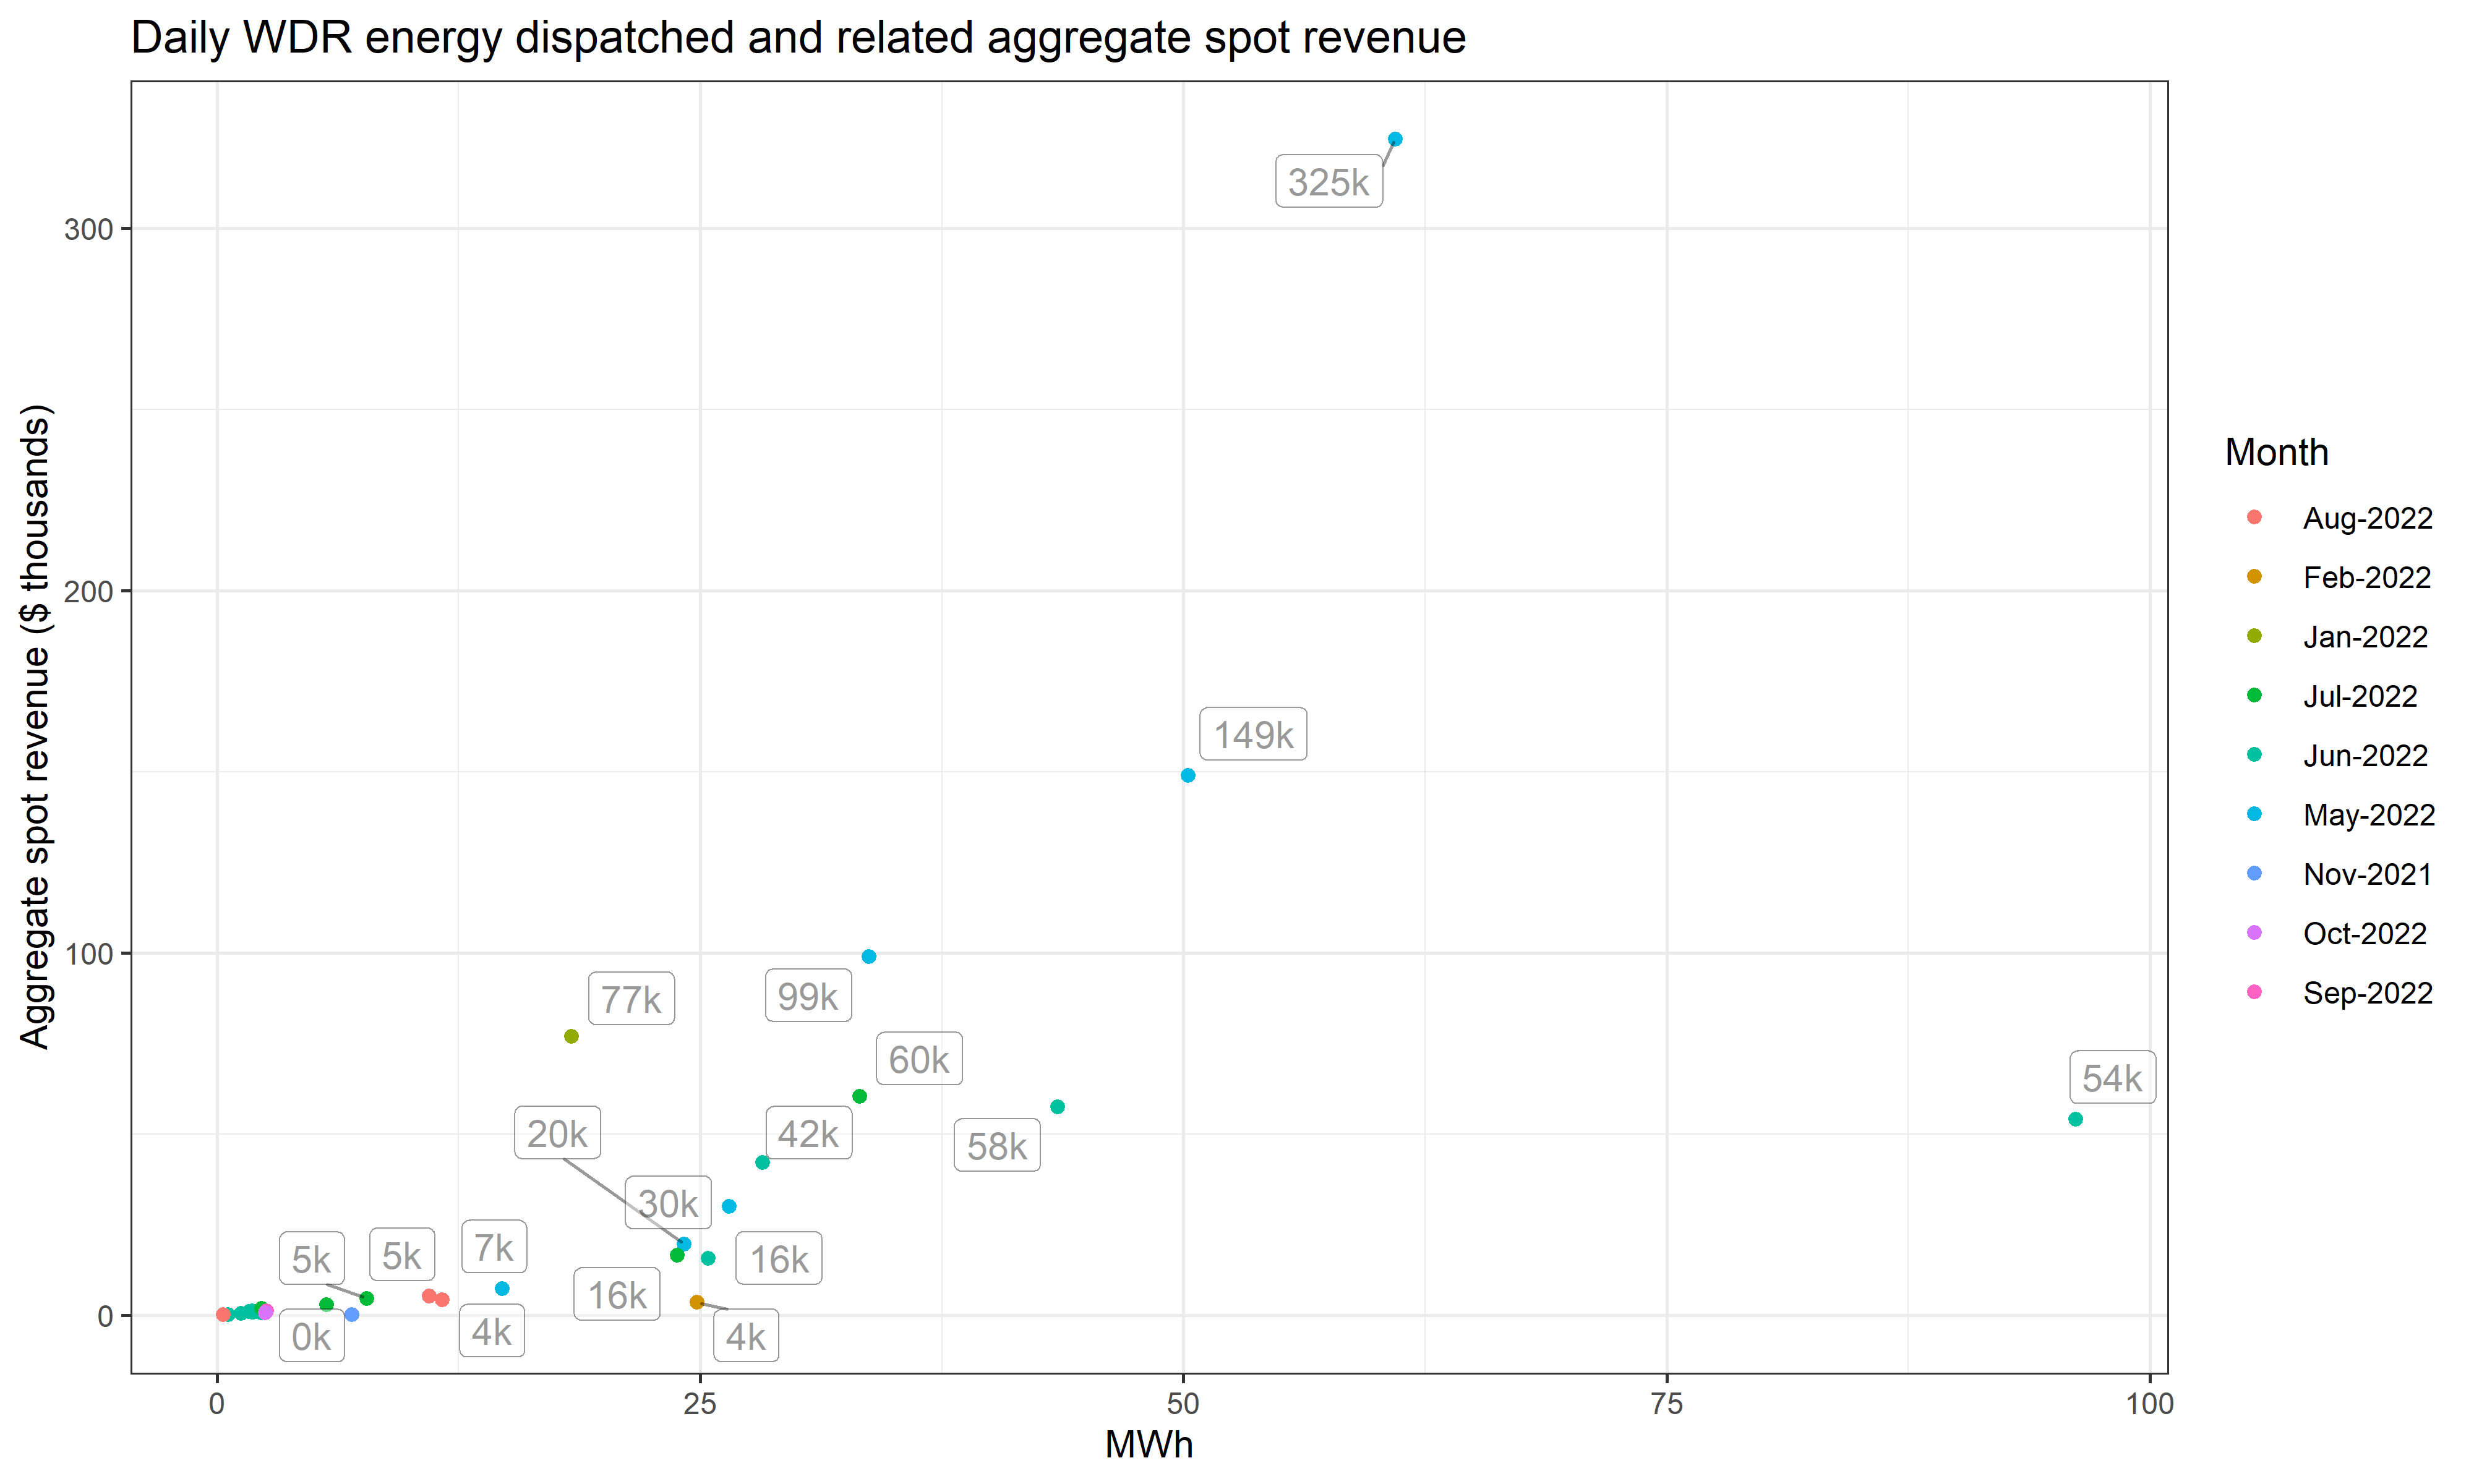
The greater the negawatts, the greater the spot revenue… usually
From another perspective, spot revenues can be charted against energy volume to verify the positive link between dispatched energy and prices. The following chart plots daily spot revenue against dispatched energy and indicates (as expected) more energy correlates with more spot revenue. Yet the spread in data points shows there were days where energy dispatched was less-closely aligned with strong prices, leading to lower spot revenue.
Dates of interest
For later reference, we’ve collated a list of articles referencing market conditions and/or dispatch of negawatts for the 32 days when WDR dispatch occurred.
Leave a comment