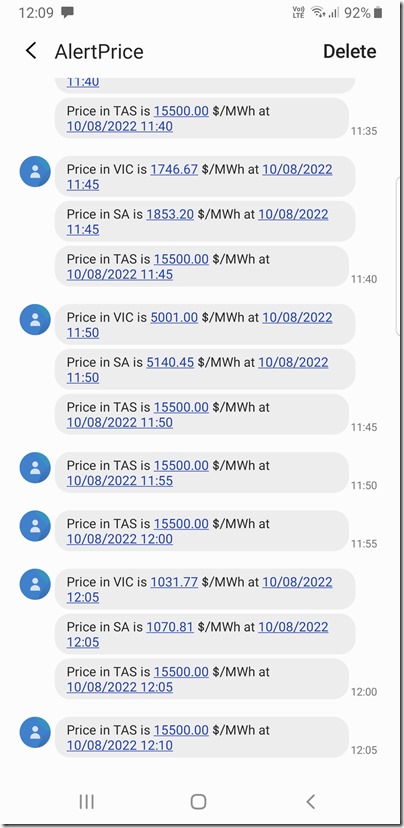
A short (and incomplete) article for Wednesday 10th August 2022 to record a barrage of SMS-based price alerts I’ve received through the middle of the day noting prices elevated in several regions, but particularly in Tasmania – here’s a list of alerts on prices for ENERGY:
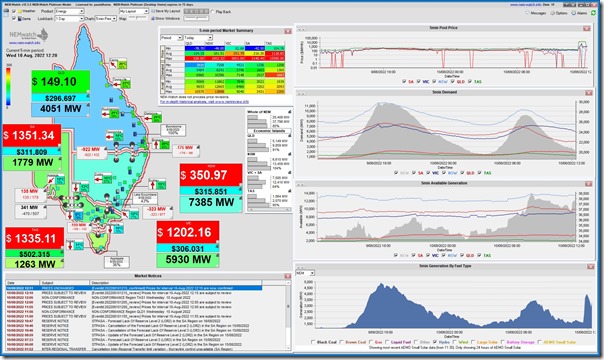
Here’s a NEMwatch snapshot showing the 12:20 dispatch interval, with prices elevated in the three southern regions:
Nothing immediately jumps out at me in the four trend charts on the right, except for:
1) A drop in Available Generation in the QLD region from 11:30 (i.e. not where the volatility was experienced); and
2) A significant/sudden ramp up in hydro output across the NEM in the 11:40, 11:45 and 11:50 dispatch intervals (i.e. InitialMW for each of these)
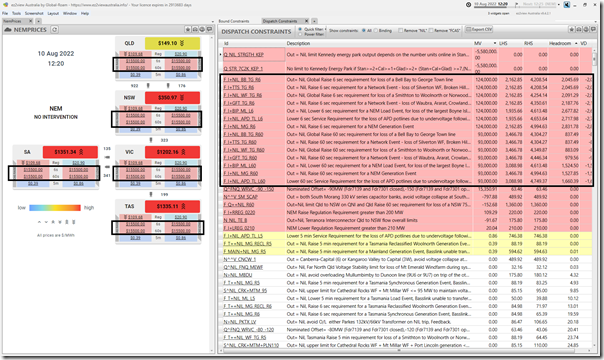
But it’s only when we delve deeper into ez2view with the snapshot for the same (i.e. 12:20) dispatch interval that we see that the fast FCAS contingency prices (both Raise and Lower for 6 seconds and 60 seconds) are at the Market Price Cap everywhere:
In the ‘Dispatch Constraint’ widget on the right we see many FCAS constraints bound with high marginal values (and violating) … i.e. hence high prices at the MPC.
—
There’s clearly a few things going on here!
PS1 due to a ‘Failure Affecting Market Dispatch and Pricing’
Market Notice 100839 was published at 13:11 as follows:
——————————————————————-
MARKET NOTICE
——————————————————————-
From : AEMO
To : NEMITWEB1
Creation Date : 10/08/2022 13:11:35
——————————————————————-
Notice ID : 100839
Notice Type ID : MARKET SYSTEMS
Notice Type Description : Status of Market Systems
Issue Date : 10/08/2022
External Reference : FAILURE AFFECTING MARKET DISPATCH AND PRICING
——————————————————————-
Reason :
FAILURE AFFECTING MARKET DISPATCH AND PRICING
Today from trading interval 1135 hrs, AEMO observed a large change in FCAS requirements for all fast and slow contingency ancillary services. This also resulted in violation of those FCAS constraints and market price caps for those services in all regions and for energy in Tasmania.
AEMO has reversed an approved change to NEMDE that was implemented from trading interval 1135 hrs. Dispatch appears to be operating correctly from trading intervals 1240 hrs
AEMO is continuing to investigate.
Manager NEM Real Time Operation
——————————————————————-
END OF REPORT
——————————————————————-
Will be interested to learn more…
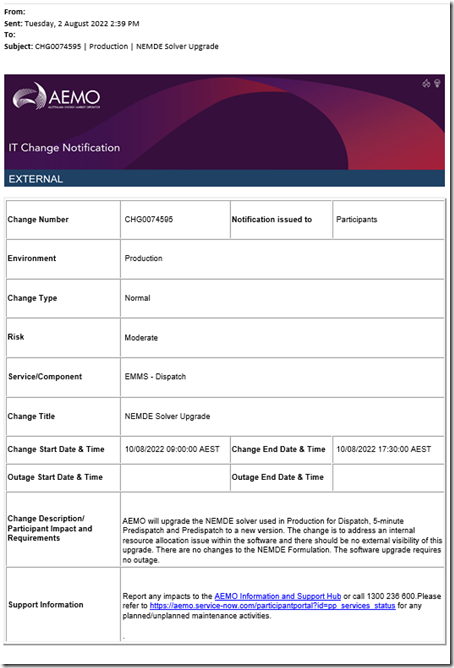
PS2 might have been related to CHG0074595?
One of our team flagged that it might have been this change which was about:
‘AEMO will upgrade the NEMDE solver used in Production for Dispatch, 5-minute Predispatch and Predispatch to a new version. The change is to address an internal resource allocation issue within the software and there should be no external visibility of this upgrade. There are no changes to the NEMDE Formulation. The software upgrade requires no outage.’
PS3a prices revised
These prices were all subsequently revised … will add more details in here later…
PS3b AEMO declares Scheduling Error
On Friday 12th August the AEMO published ‘Scheduling error declaration’ here (download it) – and also in their AEMO Communications newsletter also noted the following…
AEMO declares scheduling error
AEMO has today declared a scheduling error (linked above) for a dispatch error on Wednesday 10 August, which resulted in high volumes of contingency Frequency Control Ancillary Services (FCAS) requirements for the National Electricity Market (NEM) across 13 five-minute trading intervals (1135 hrs to 1235 hrs).
The FCAS requirements were unable to be met in full, violating the requirements and resulting in prices at or near the market price cap of $15,500 for these services in all regions. The electricity spot price in Tasmania was also affected. AEMO identified that the issue commenced after an IT change to the NEM dispatch engine. AEMO reversed the software change, which resolved the issue at around 1240 hrs.
AEMO has revised the energy and FCAS prices during these trading intervals using the reinstated version of the dispatch engine. Dispatch targets and FCAS enablement levels are unaffected and AEMO recognises there may be individual impacts, which AEMO will be working through.
AEMO will report on the scheduling error and surrounding circumstances after completing a full investigation. The report will assess the impact of the error on central dispatch outcomes, and is also expected to include recommendations on:
• Improved communications with the market
• IT change control
• Manifestly incorrect input procedures
Please email if you have questions at nemintervention@aemo.com.au .
PS4 discussion elsewhere
Josh Stabler from EnergyEdge wrote about this on Wednesday via LinkedIn here, and the comments collecting underneath might be of interest to readers.
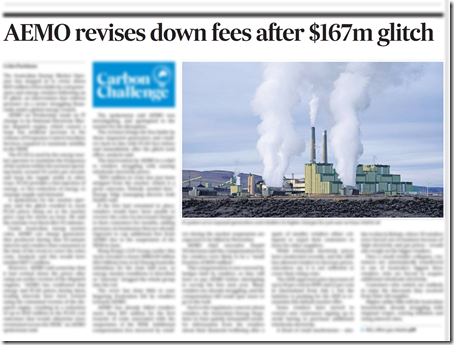
I also saw that Colin Packham wrote in the AFR about the incident here for Friday’s print edition:


Digging in to this one, looks like generation at DUIDs CHYTWF1, STOCKYD1, MUWAWF1 and MUWAWF2 were suddenly interrupted. Do not know if these were the result of constraints binding (i.e. dispatched off), or there was some kind of fault in the area.
Some DUIDs were on the LHS of the bound/violated FCAS constraints. Without double-checking, the ones you list sound like the correct ones.
This may also have been a participant response to the extreme FCAS raise prices. Generators pay for raise FCAS and a number of them will bid their plants down or off when FCAS raise prices spike.
I watched this as it happened, and then wrote about it the following day at the blog site I contribute to. I have been keeping all the AEMO coverage area wind generation data on a daily basis for the last four years in my daily Posts, and for the year prior to that all the (AEMO coverage area) electrical power generation data from every source for a year and a half, and then for the year prior to that, all the Base Load data, also on a daily basis.
This was a failure of (ONLY) wind plants and Solar Plants. (not rooftop solar, just the solar power plants) The initial fall at 11.35AM saw an immediate loss of 3600MW, and then over the following 45 minute further losses to take the total loss to 4700MW. Keep in mind here that this was ONLY those wind and solar plants. Now, while you might think that 4700MW is not all that much, at the time of failure that amounted to a loss of 17% of overall total power consumption across the AEMO, so this was a significant failure.
At the same time as the failure began, Hydro came ‘to the rescue’, as it always does when there is a failure of any power Unit, because hydro can come on line almost immediately. The plants at Tumut Three (pumped hydro) Upper Tumut (Tumut One and Two) and Murray (Murray One and Two) immediately put 2450MW into the grid to replace the missing wind and solar power. As you are aware these (some of them older than 50/60 years) Units are smaller Units, around 150 to 250MW, so there was around 12 to 15 Units coming on line here. Also at that same time, EVERY black coal fired Unit (15 Units in NSW and 22 Units in Qld) also ever so slightly RAMPED UP (and hey, haven’t we been told ad infinitum that they cant ramp, despite doing exactly that twice every single day by between 4500 and 5500MW) and in the next 10 Minutes, those coal fired Units also added an extra 650MW to the grid to all but cover that initial loss from wind and solar plants.
Note here especially, that the point of failure and the point in time of rescue were exactly the same, 11.35AM.
It was almost 2 hours before wind and solar recovered to their level at the time of failure, but this was the failure of just wind and solar plants.
There is more text, and images showing the failure on load curve graophs at the following link
https://papundits.wordpress.com/2022/08/11/australian-daily-wind-power-generation-data-wednesday-10-august-2022/
I hope this helps.
Anton Lang
Anton
I’ve only skimmed what you wrote at the link in your comment – but it does seem that you have misinterpreted ‘the reason why‘ the wind and solar farms collectively dropped in output. It was not a ‘failure’, in that sense – though the underlying software glitch would seem to be a failure of other processes.
Coincidentally I’ll be posting to explain this here on WattClarity in the next day or so, so stay tuned…
Paul
Paul, and thanks for the quick response here.
Using the same word semantics you used, I didn’t ‘skim’ your article. I read it all.
At no point did you even mention the failure of ONLY those two renewables as the end result of what you found.
You mentioned the Queensland situation, with no explanation.
You mentioned the rise in hydro. (without even going to check why)
You mentioned the spike in the cost of generation, also without checking why.
All of that is down to the immediate loss of 17% of power, and the extreme short notice of finding replacement power ….. OUTSIDE of the bidding process, hence enormously expensive, hence the spike in prices.
That 17% of power was 4700MW, and that’s the equivalent of six to nine of those large scale coal fired Units. If that many coal fired Units dropped off line, even for this same reason, then you would have been shouting it from the rooftops. A failure of delivery of power ACTUALLY IS a failure.
You say that I may have misinterpreted the reason why, but it seems you have also misinterpreted things as well, perhaps more than I have.
I look forward toy your coming article, ….. a week after I wrote about it. Feel free to use anything from your skim, but hey, you might credit me if you do, eh!
Anton Lang.