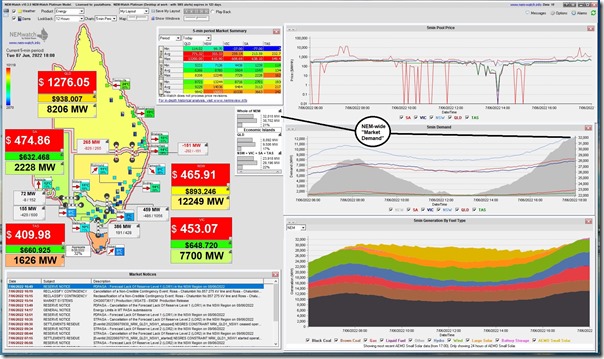
One further article this evening with this snapshot from NEMwatch at the 18:00 dispatch interval this evening (i.e. 30 minutes after this) to highlight one other factor that’s been important in this ‘2022 Energy Crisis’:
I’ve flagged here where the NEM-wide ‘Market Demand’ is shown … up at 32,010MW target for the 18:00 dispatch interval (NEM time).
—
Now my own senses were telling me (as I’d noted earlier) that this was a pretty big level of ‘Market Demand’:
1) But I knew it was still quite a way below the all-time record;
2) Albeit that these all-time records are typically biased towards summer periods (i.e. peak demand is higher in summer, typically … but average demand is higher in winter).
3) Notwithstanding the seasonality, I thought I could remember some occasionally big winter evenings, in terms of winter peak in demand … but not for a number of years.
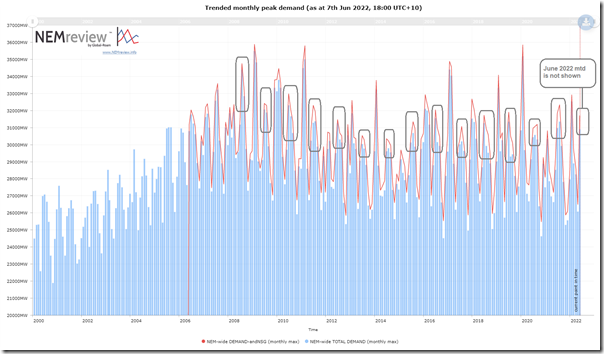
So I powered up NEMreview v7 and produced this longer-range trend of monthly peak demand:
Noting that this trend does not include month-to-date data for June 2022 (and also that the AEMO’s more recently favoured ‘Operational Demand’ measure has not a great deal of history, so I have left it off) I have highlighted the winter spikes in demand to make eyeball comparisons somewhat easier. It seemed clear to me from this that:
1) there were many winters in recent times with peak ‘Market Demand’ not even approaching 32,000MW;
2) but there was a particularly pronounced spike way back in 2008 that was considerably larger (up at 34,394MW).
(A) May and June peak ‘Market Demand’ very high on a historical scale
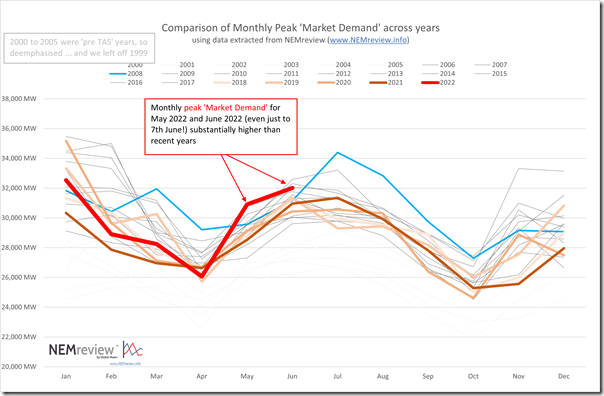
So I extracted the data and flipped for easier comparison as shown below from a chart in Excel:
With the interest particularly being comparison against recent years, I have deemphasised the earlier years (particularly 2005 and beforehand, being pre-Tasmania) and highlighted the last 5 years (and also the 2008 year to show the outlier in July … 18:30 on 28th July 2008 at 34,394MW).
And so with the results…
Headline Result #1) The month of May 2022 showed the highest ever peak ‘Market Demand’ when compared across the other 23 years in the range.
Headline Result #2) The month of June 2022 (to date … i.e. only 7 days young) has reached peak ‘Market Demand’ only exceeded previously in 2007, 2010 and 2009 ... which are all more than a decade ago.
Keeping in mind the broader questions about the causes of this ‘2022 Energy Crisis’ , it’s useful to highlight these extremes as indicative of one of the drivers of the extremes in pricing we have seen.
In layperson terms, it’s cold (and particularly important that it’s colder than expected), which is ramping demand higher than it was expected to be.
(B) Caveat about ‘Market Demand’
Remember that we continue to refer to ‘Market Demand’ as that is the metric produced by AEMO/NEMDE that most directly reflects how prices are set in the NEM … and at what level.
In comparison, AEMO increasingly speaks about ‘Operational Demand’, as that better reflects their challenges relating to keeping the lights on. The measures are similar in very broad terms, but have some key differences – and ‘Operational Demand’ is typically higher than ‘Market Demand’.
It’s worth a short note here, so readers are aware about the longitudinal comparability of ‘Market Demand’… in recent times as discussed in numerous places (including here), the NEM has seen increasing challenges with minimum demand. As part of the suite of mechanisms introduced by AEMO to grapple with this challenge, it’s made some changes to operational requirements to some smaller (legacy) Non-Scheduled wind farms such that they now operate in many respects as if they were Semi-Scheduled.
When I have more time, will link to some background to this change.
One of the implications of this I believe (but have not invested time to verify) is that the way in which ‘Market Demand’ is calculated will have changed slightly, to now count in the supply from these smaller Non-Scheduled wind farms (whereas prior to this change they would not have been counted). Assuming I’m correct in this belief, it would be useful for readers to keep in mind with respect to the above.


Leave a comment