
Background
A year ago we reviewed, in one year on by the numbers, the market outcomes of wholesale demand response (WDR) in the NEM. WDR was a new mechanism that had been in operation for year, having started on 24 October 2021.
It’s been 2 years now, providing a new milestone from which to review participation and impact.
The hole and the peg
As early as 2011 but in earnest in 2018 (when three rule change proposals were consolidated into one) the case that a demand-side sized hole in the electricity market existed had been argued and adopted. The demand side had lots (loads?) to offer but there was a perception that there was no direct access to the wholesale market to realise its potential.
Although, there were already existing opportunities:
- Route 1 = Scheduled load (though may not suit some modes of operation),
- Route 2 = Wholesale market customer,
- Route 3 = Spot exposure in retail contract (this also extends to the residential sector – e.g Amber).
The peg, the solution, to fill the hole was the creation of the wholesale demand response mechanism. It would expose demand-side energy reductions to the wholesale market allowing large commercial or industrial sites to participate in the market alongside generators. This would help to reduce tight supply-demand balances by incentivising participating loads to reduce demand. Accordingly, flow-on benefits would ensue in the form of lower wholesale prices, increased transparency. It would also start a journey towards a greater role of the demand-side in the wholesale electricity market.
Implemented 24 October 2021, WDR is a mechanism targeting large electricity consumers. It enables participants to sell demand response (reductions in consumption) into the wholesale electricity market. Centrally dispatched demand responses earn the wholesale market spot price in a similar way to how generators operate on the supply-side of the market.
This 2-year review considers whether whether WDR has settled into the space created for it.
Year 2 in review
Volumes dispatched were down 65%
Year 1 of the mechanism saw 570 MWh dispatched.
In the 12 months ending 23 October 2023 (year 2) 202 MWh were dispatched.
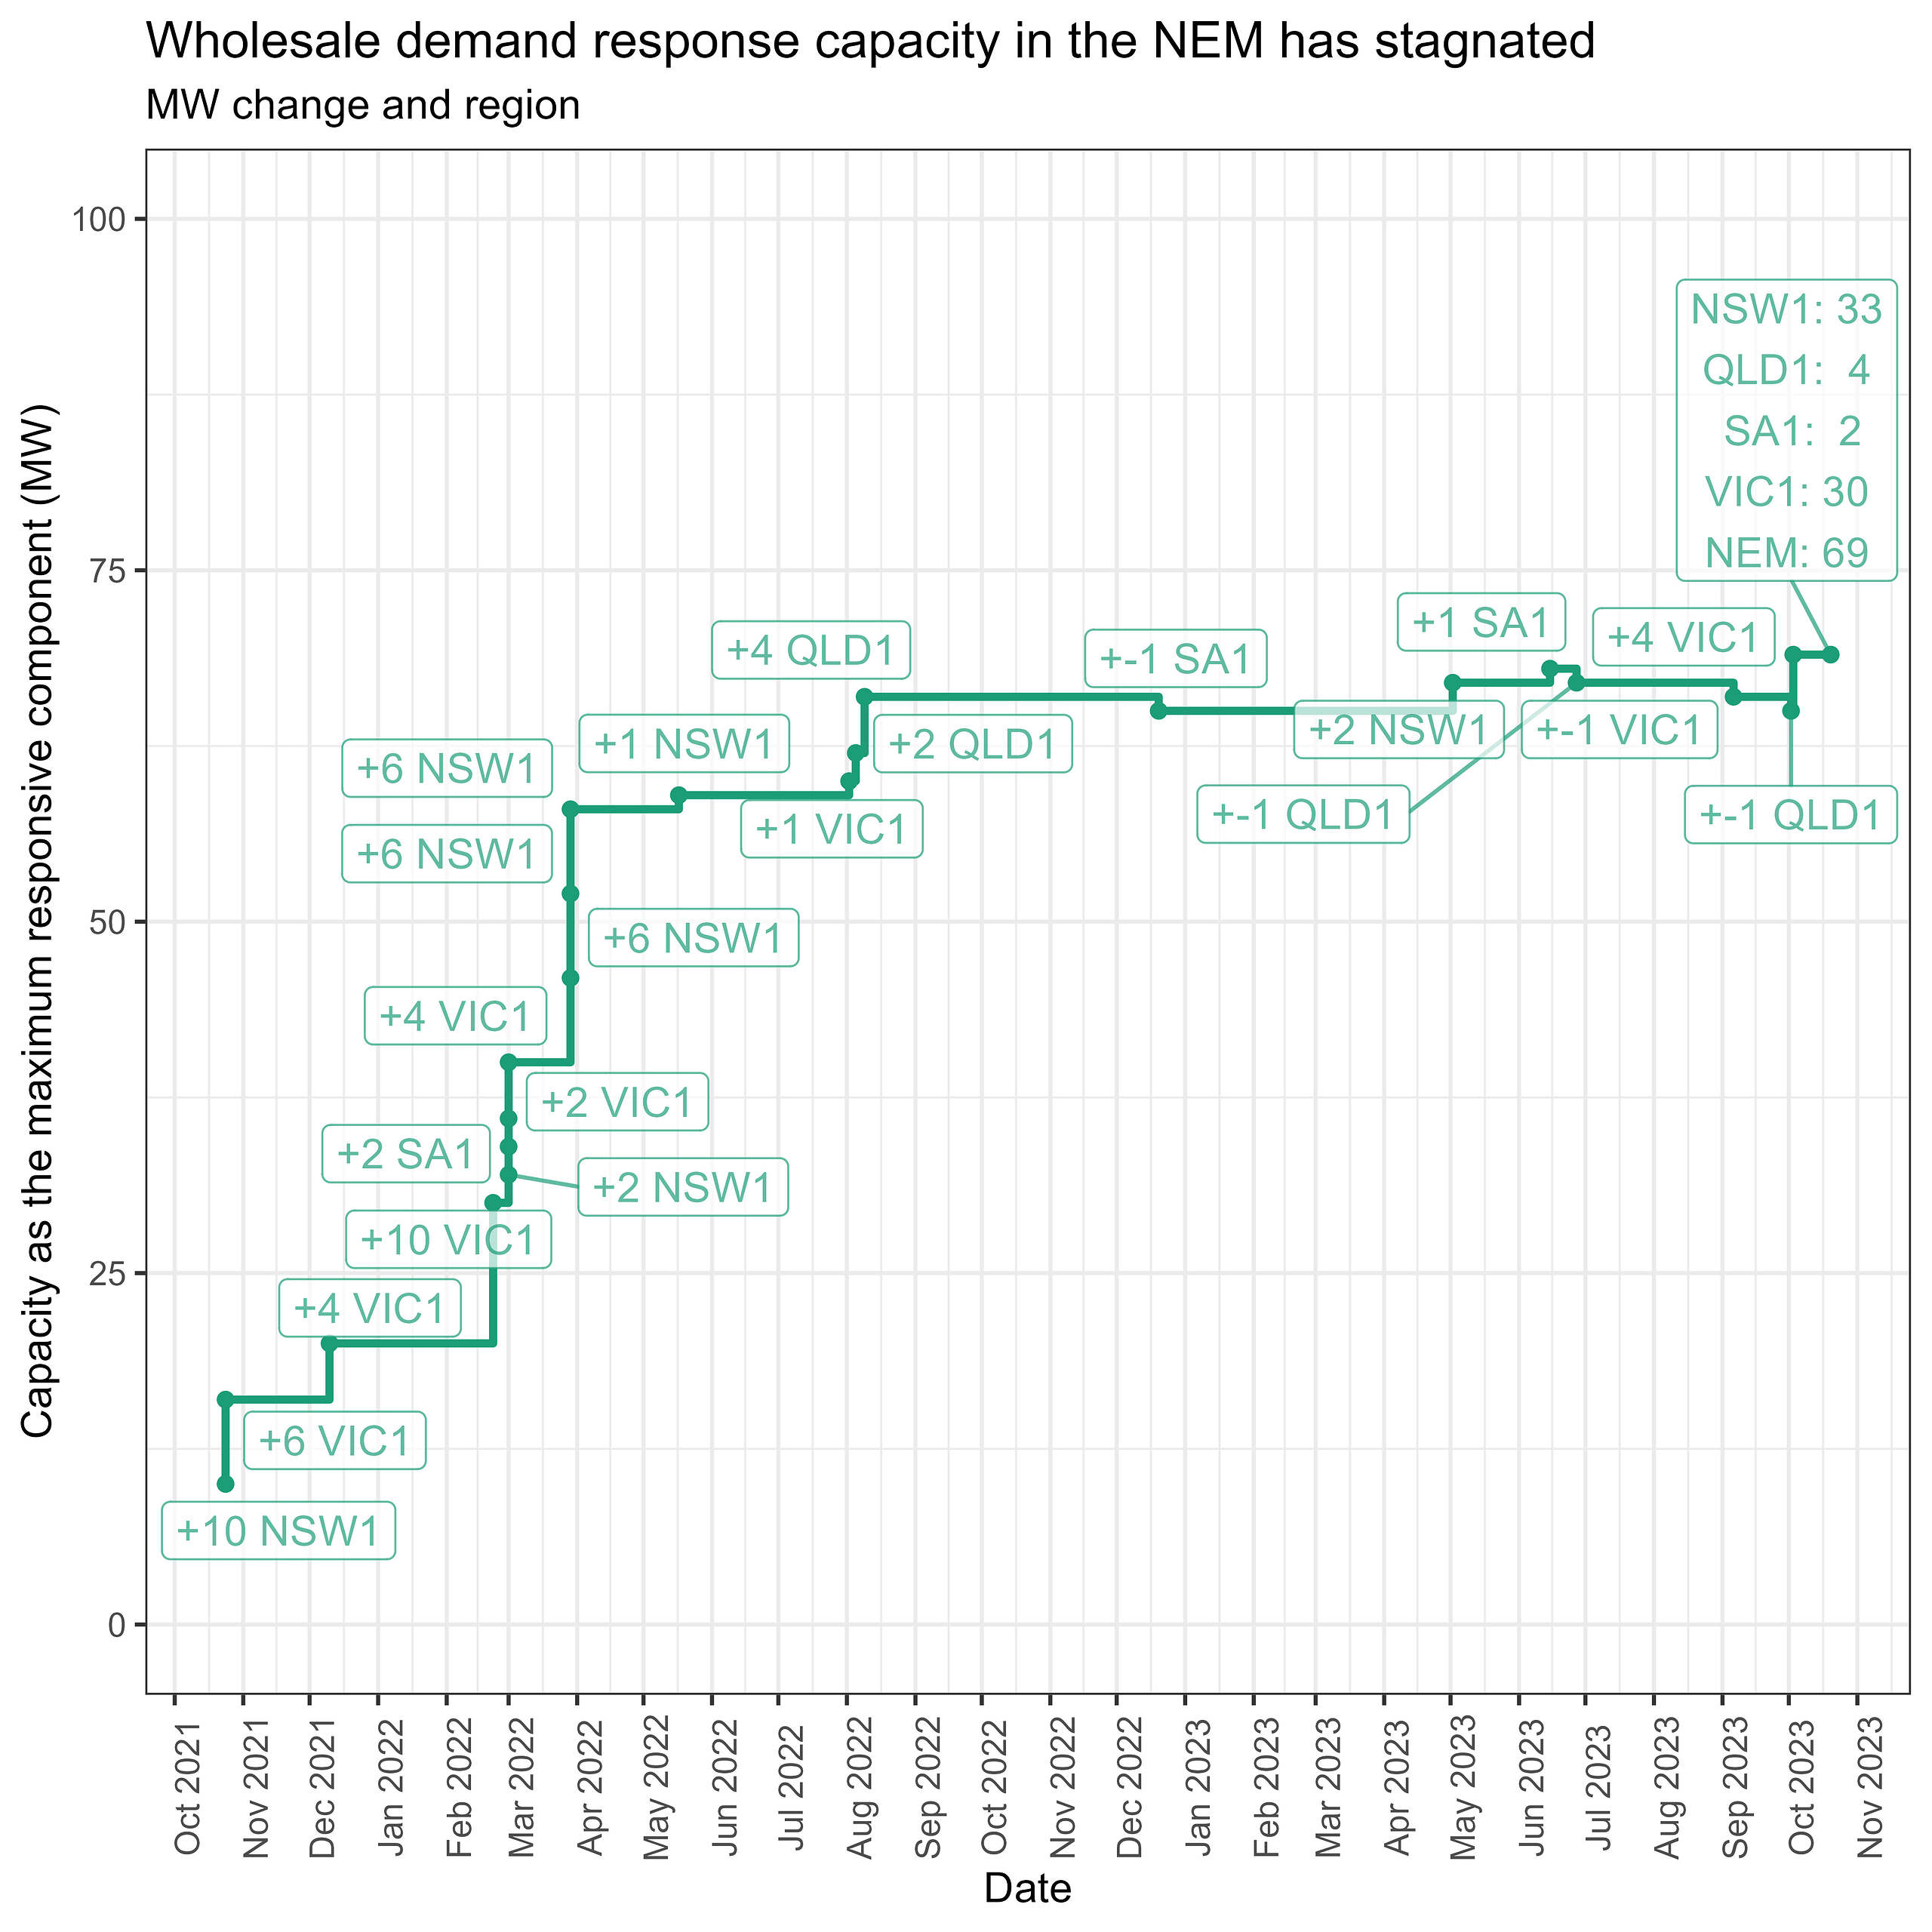
Capacity increases have stalled
At 69 MW of capacity NEM-wide, it is +3 MW since the year before. This result was noted in Paul’s article With the 2023 ESOO report, some real head scratching about Demand Response! .
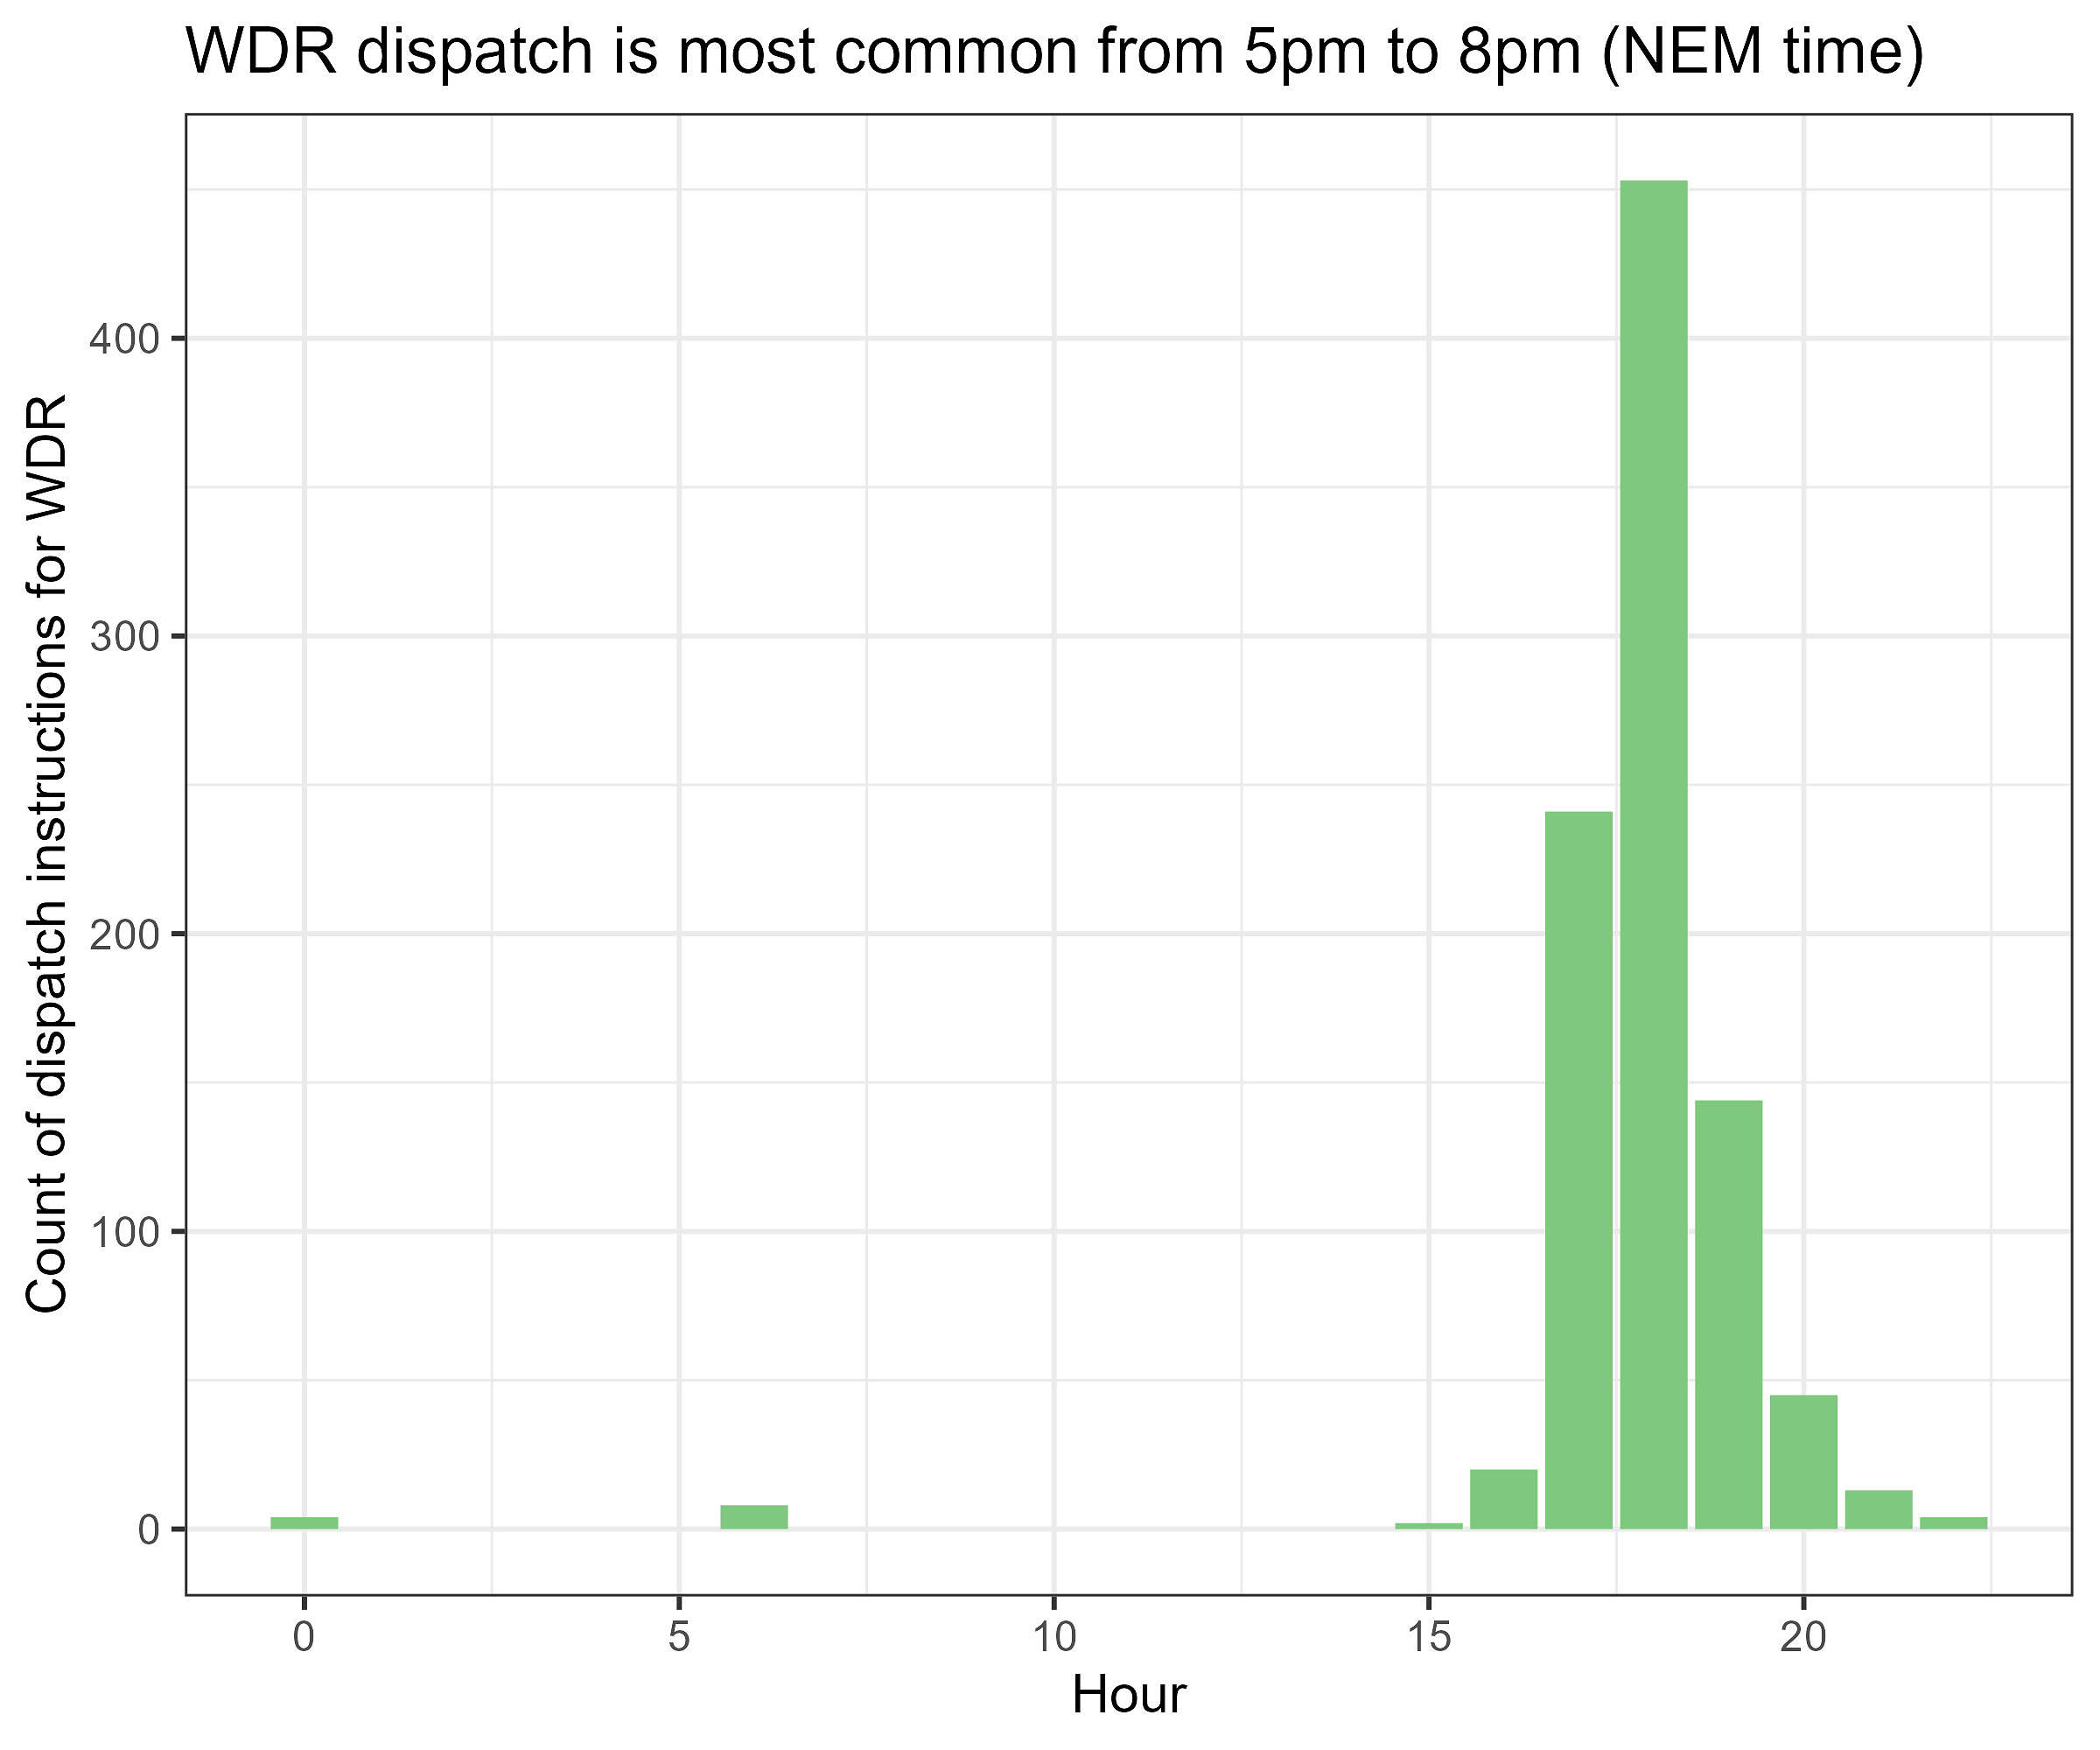
The evening remains the most common time of day for dispatch
Last year we noted 5pm – 8pm was the most common time of day for WDR dispatch. This aligns with evening demand peaks and increased potential for higher prices.
We can see in the next chart that the timing for the last year (October 2022 – October 2023) hasn’t changed materially. Hour 17 is 5pm and hour 20 is 8pm.
VWAPs increased
In year 2, we find the volume-weighted average spot price (VWAP) was 1,952 $/MWh. This is a 13% improvement on year 1 where we noted the VWAP for all negawatt dispatch events, since mechanism-start, was 1,729 $/MWh.
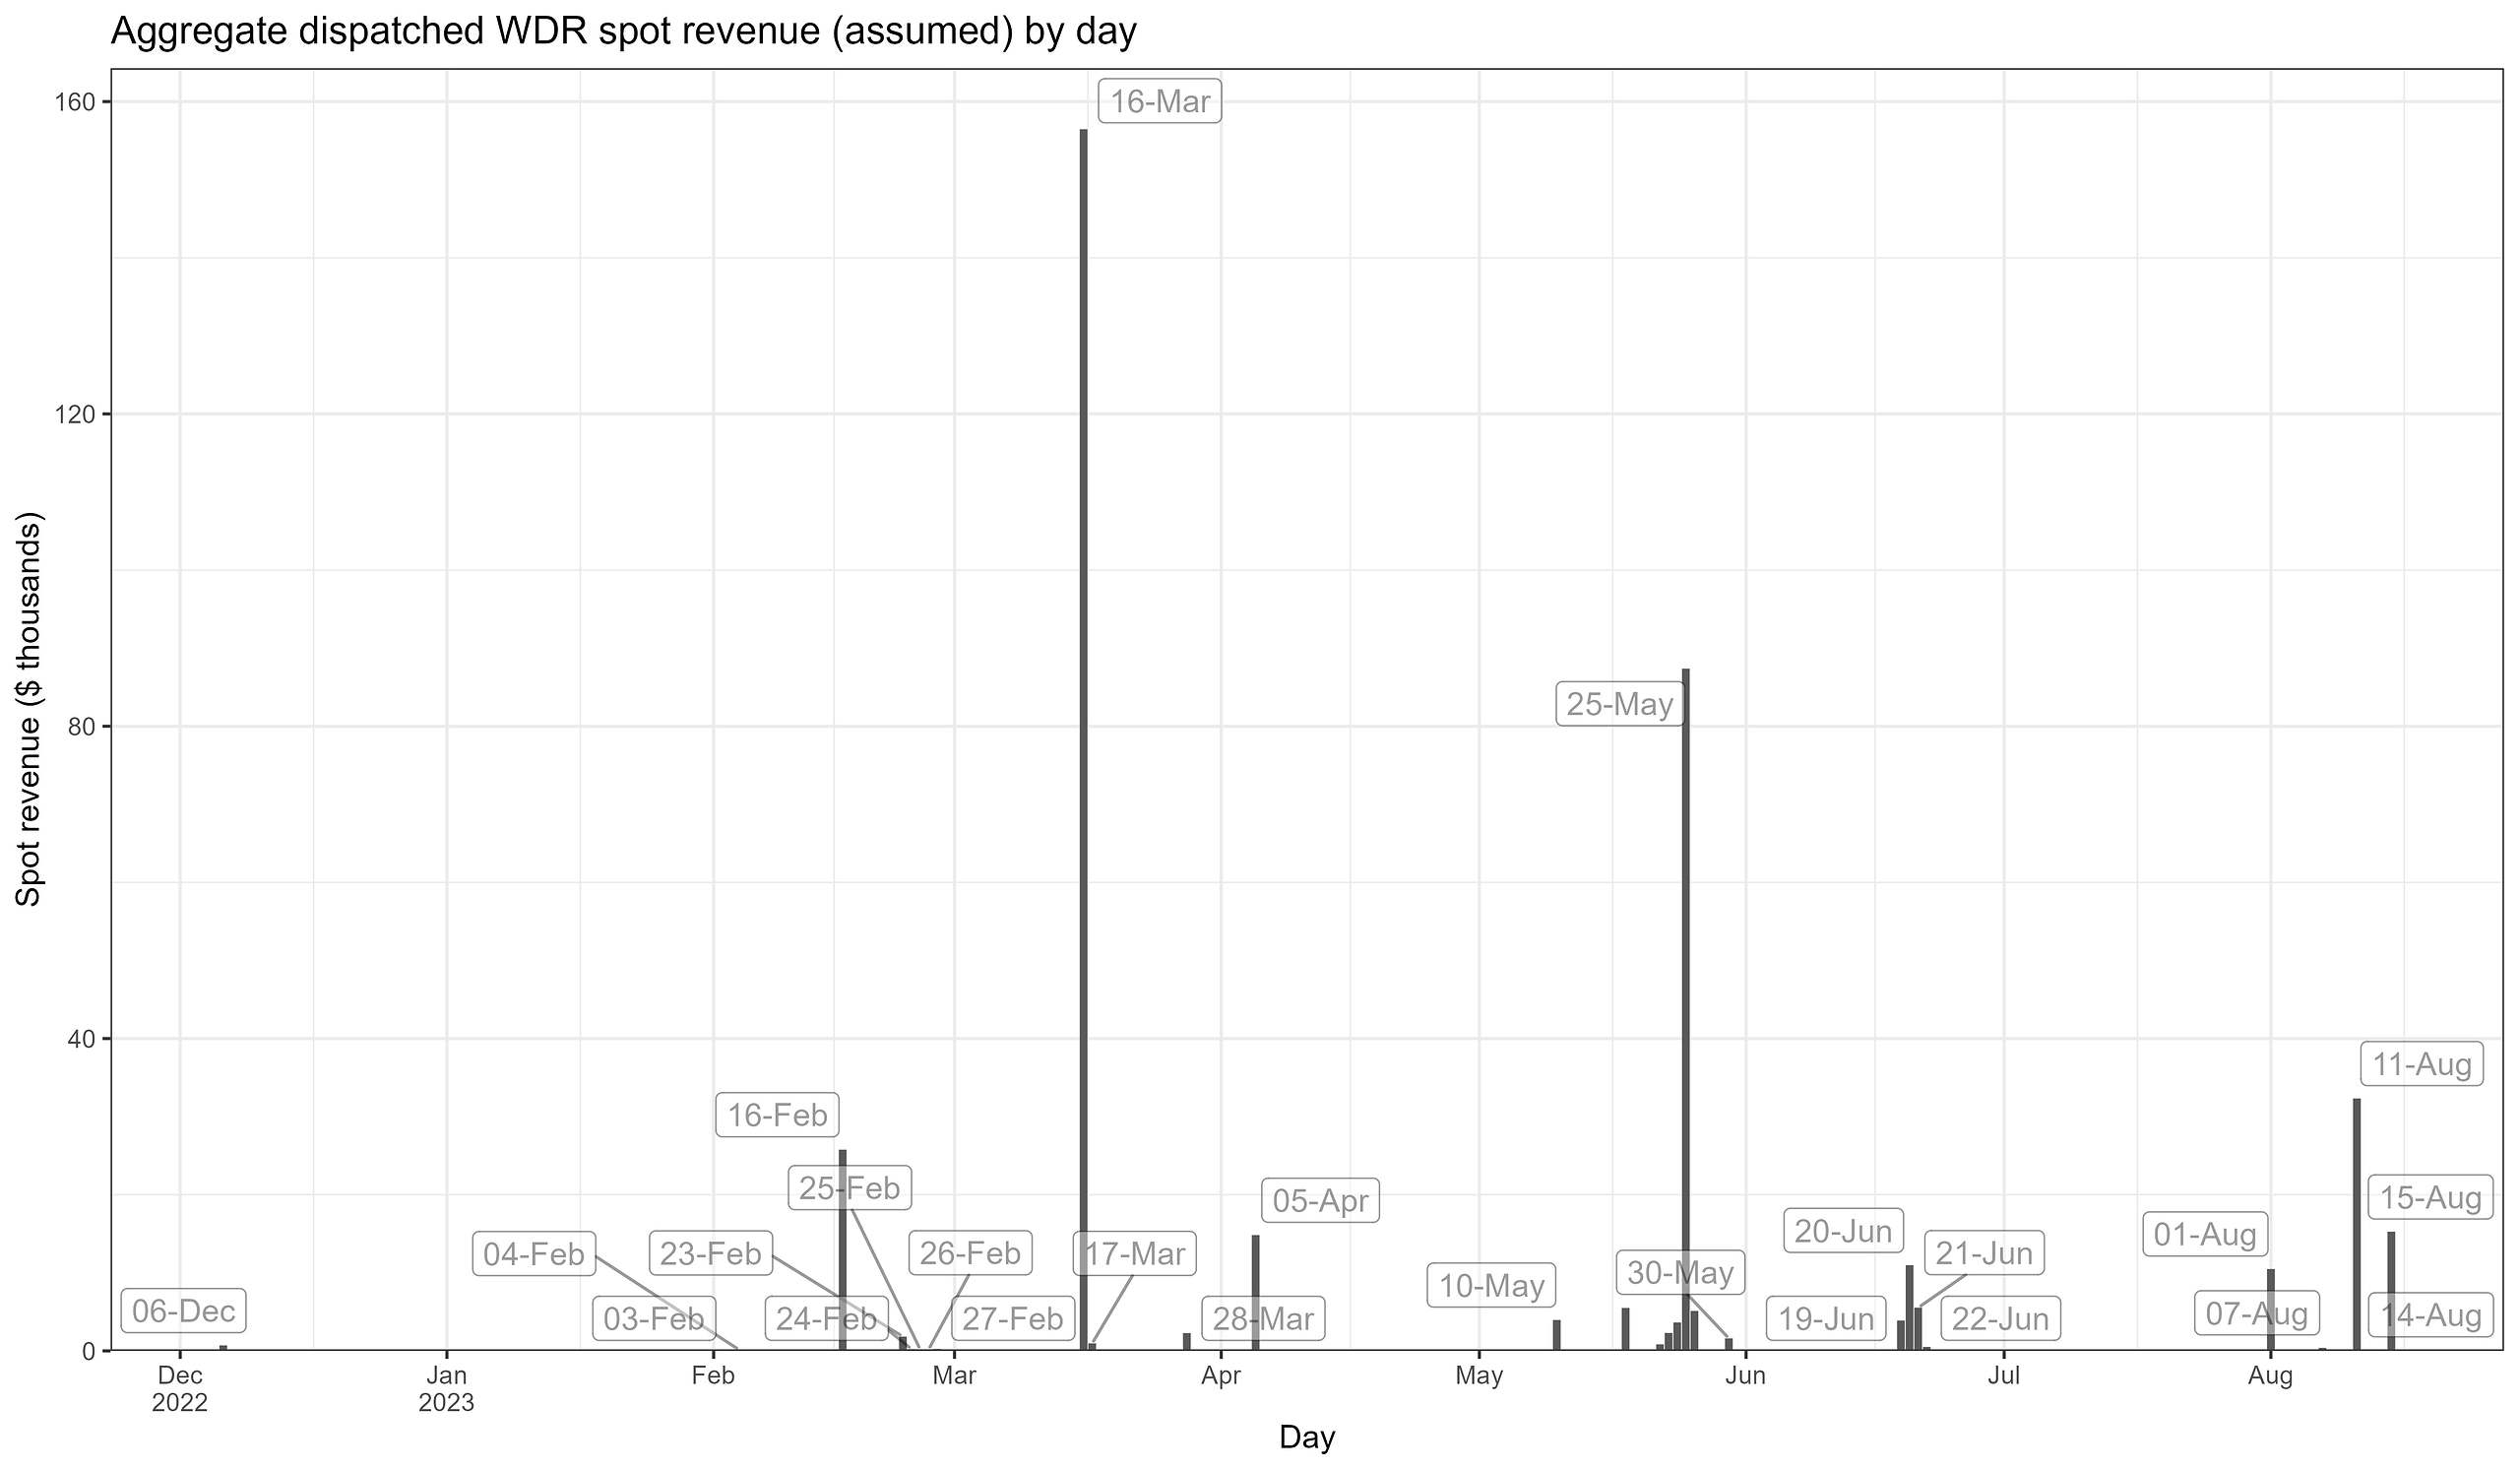
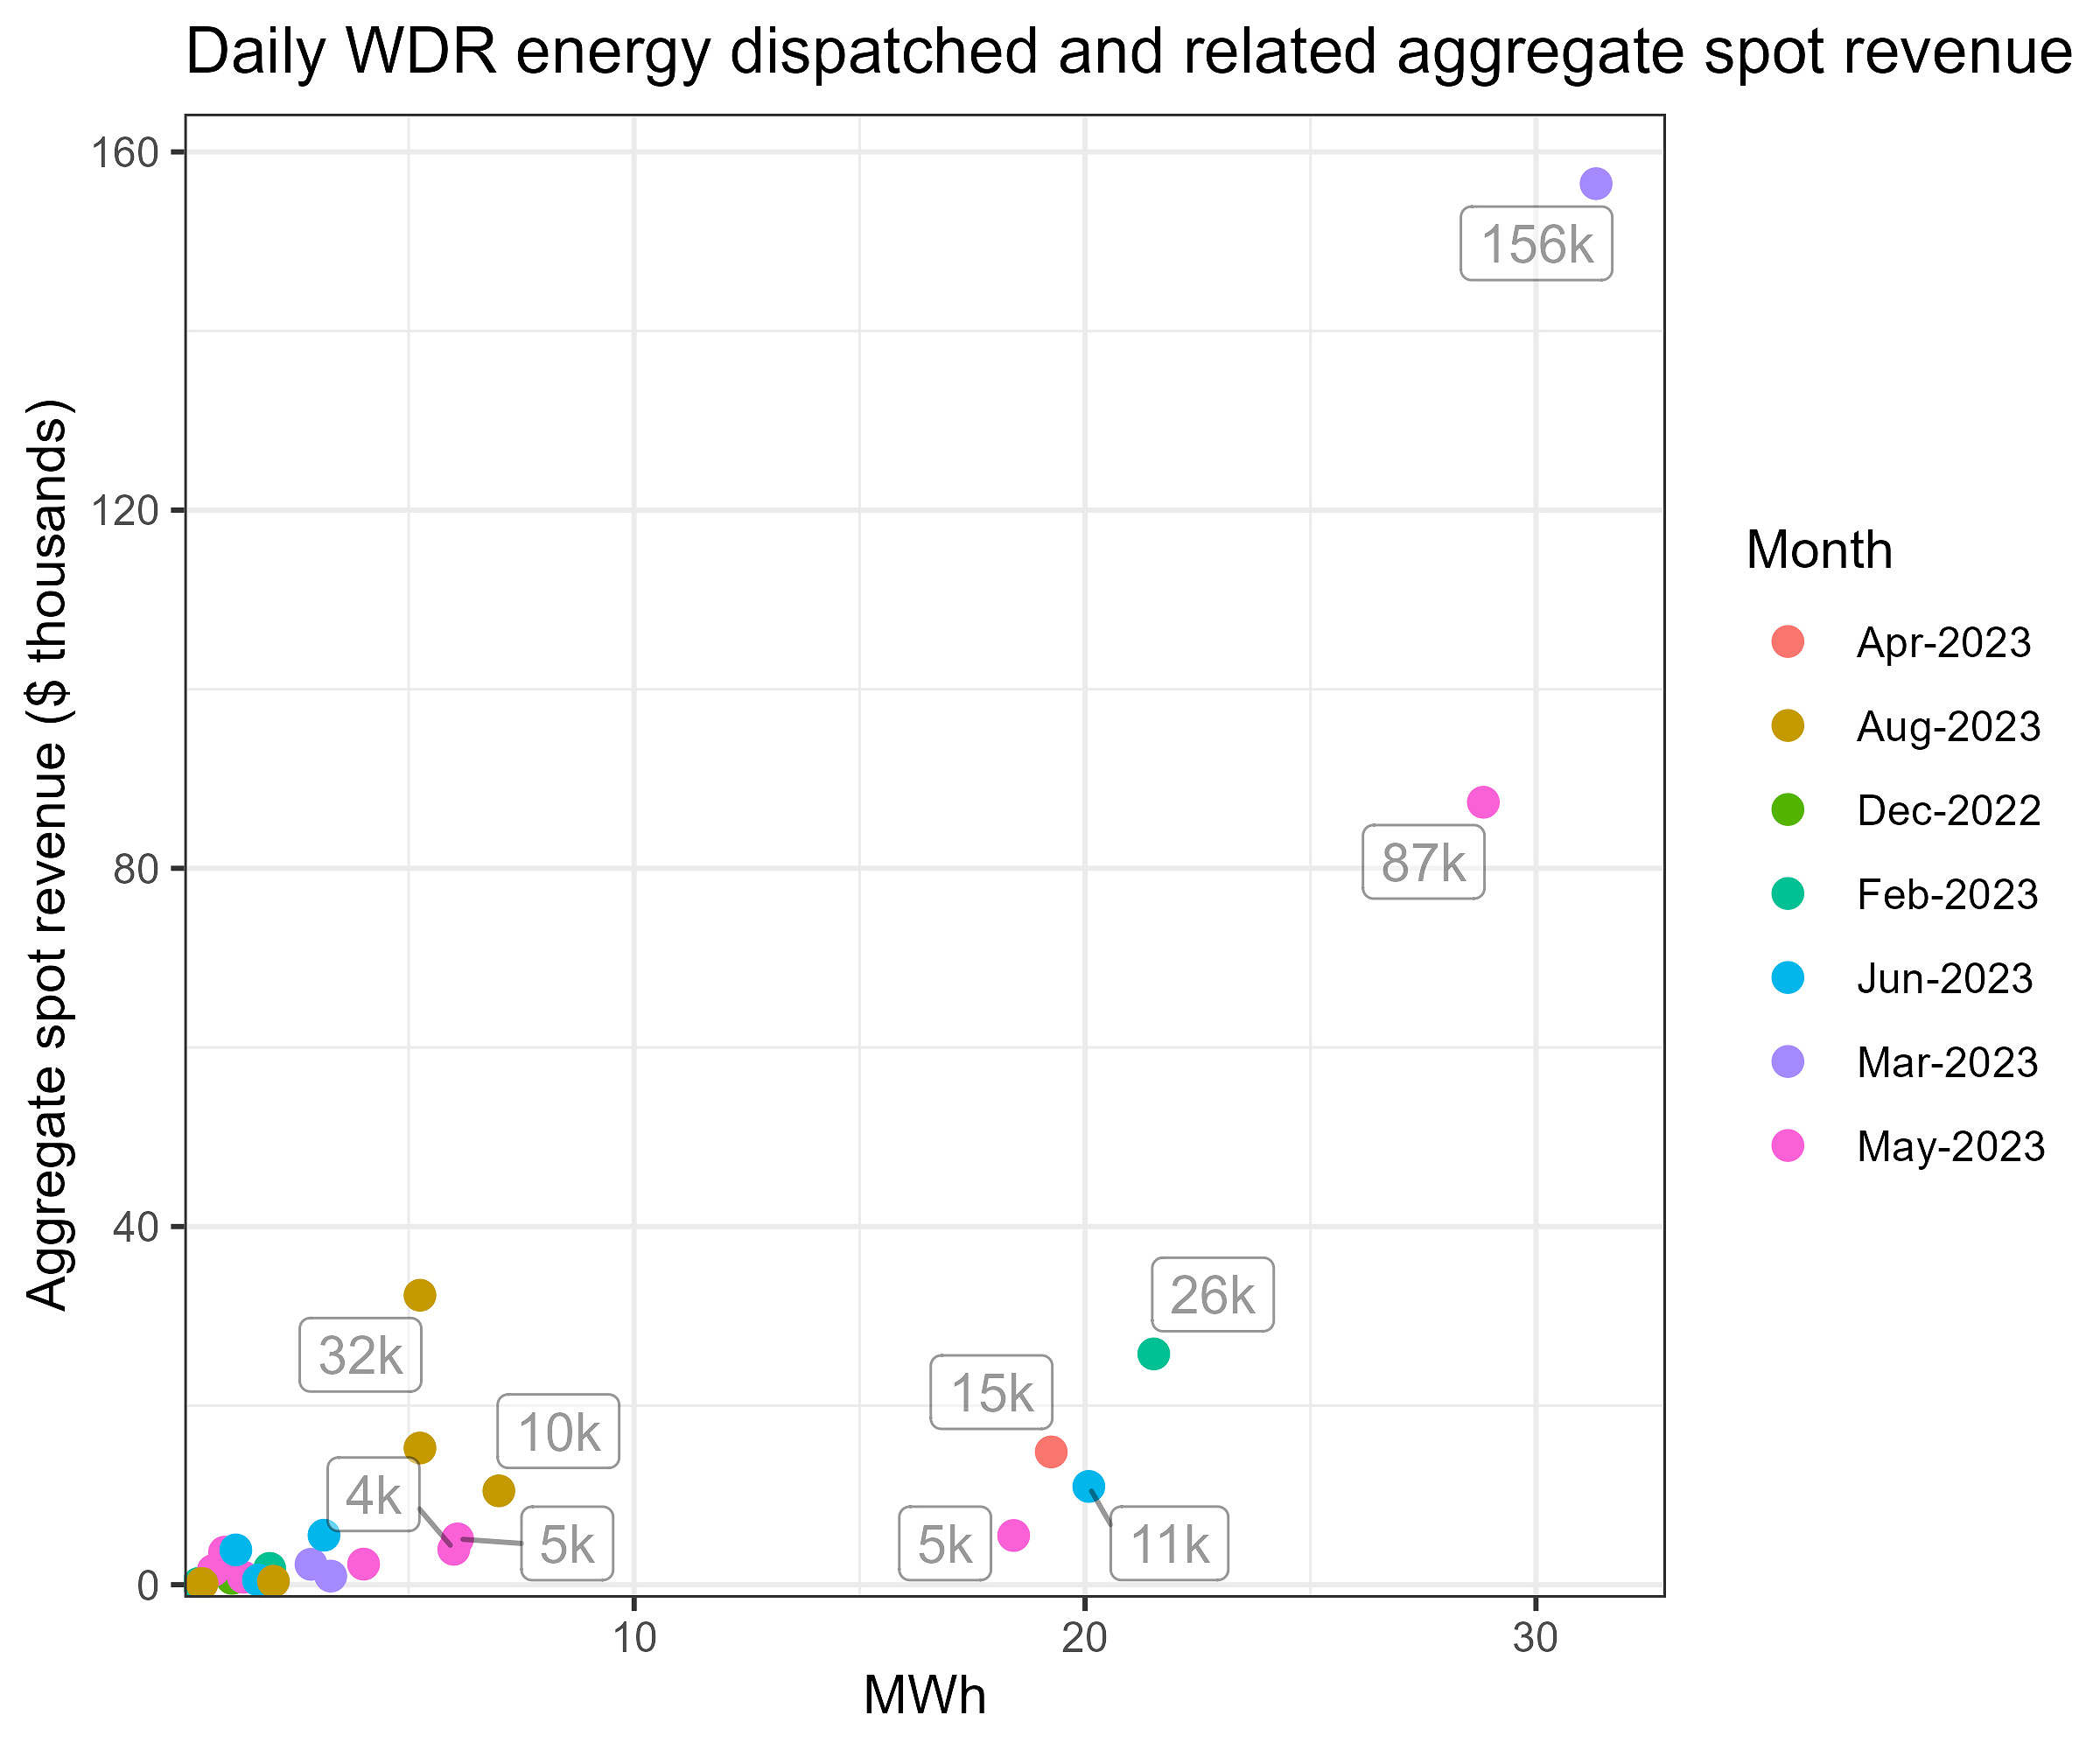
The aggregate dispatched WDR spot revenue by day chart, below, captures when WDR units were most successful.
The 16th of March 2023
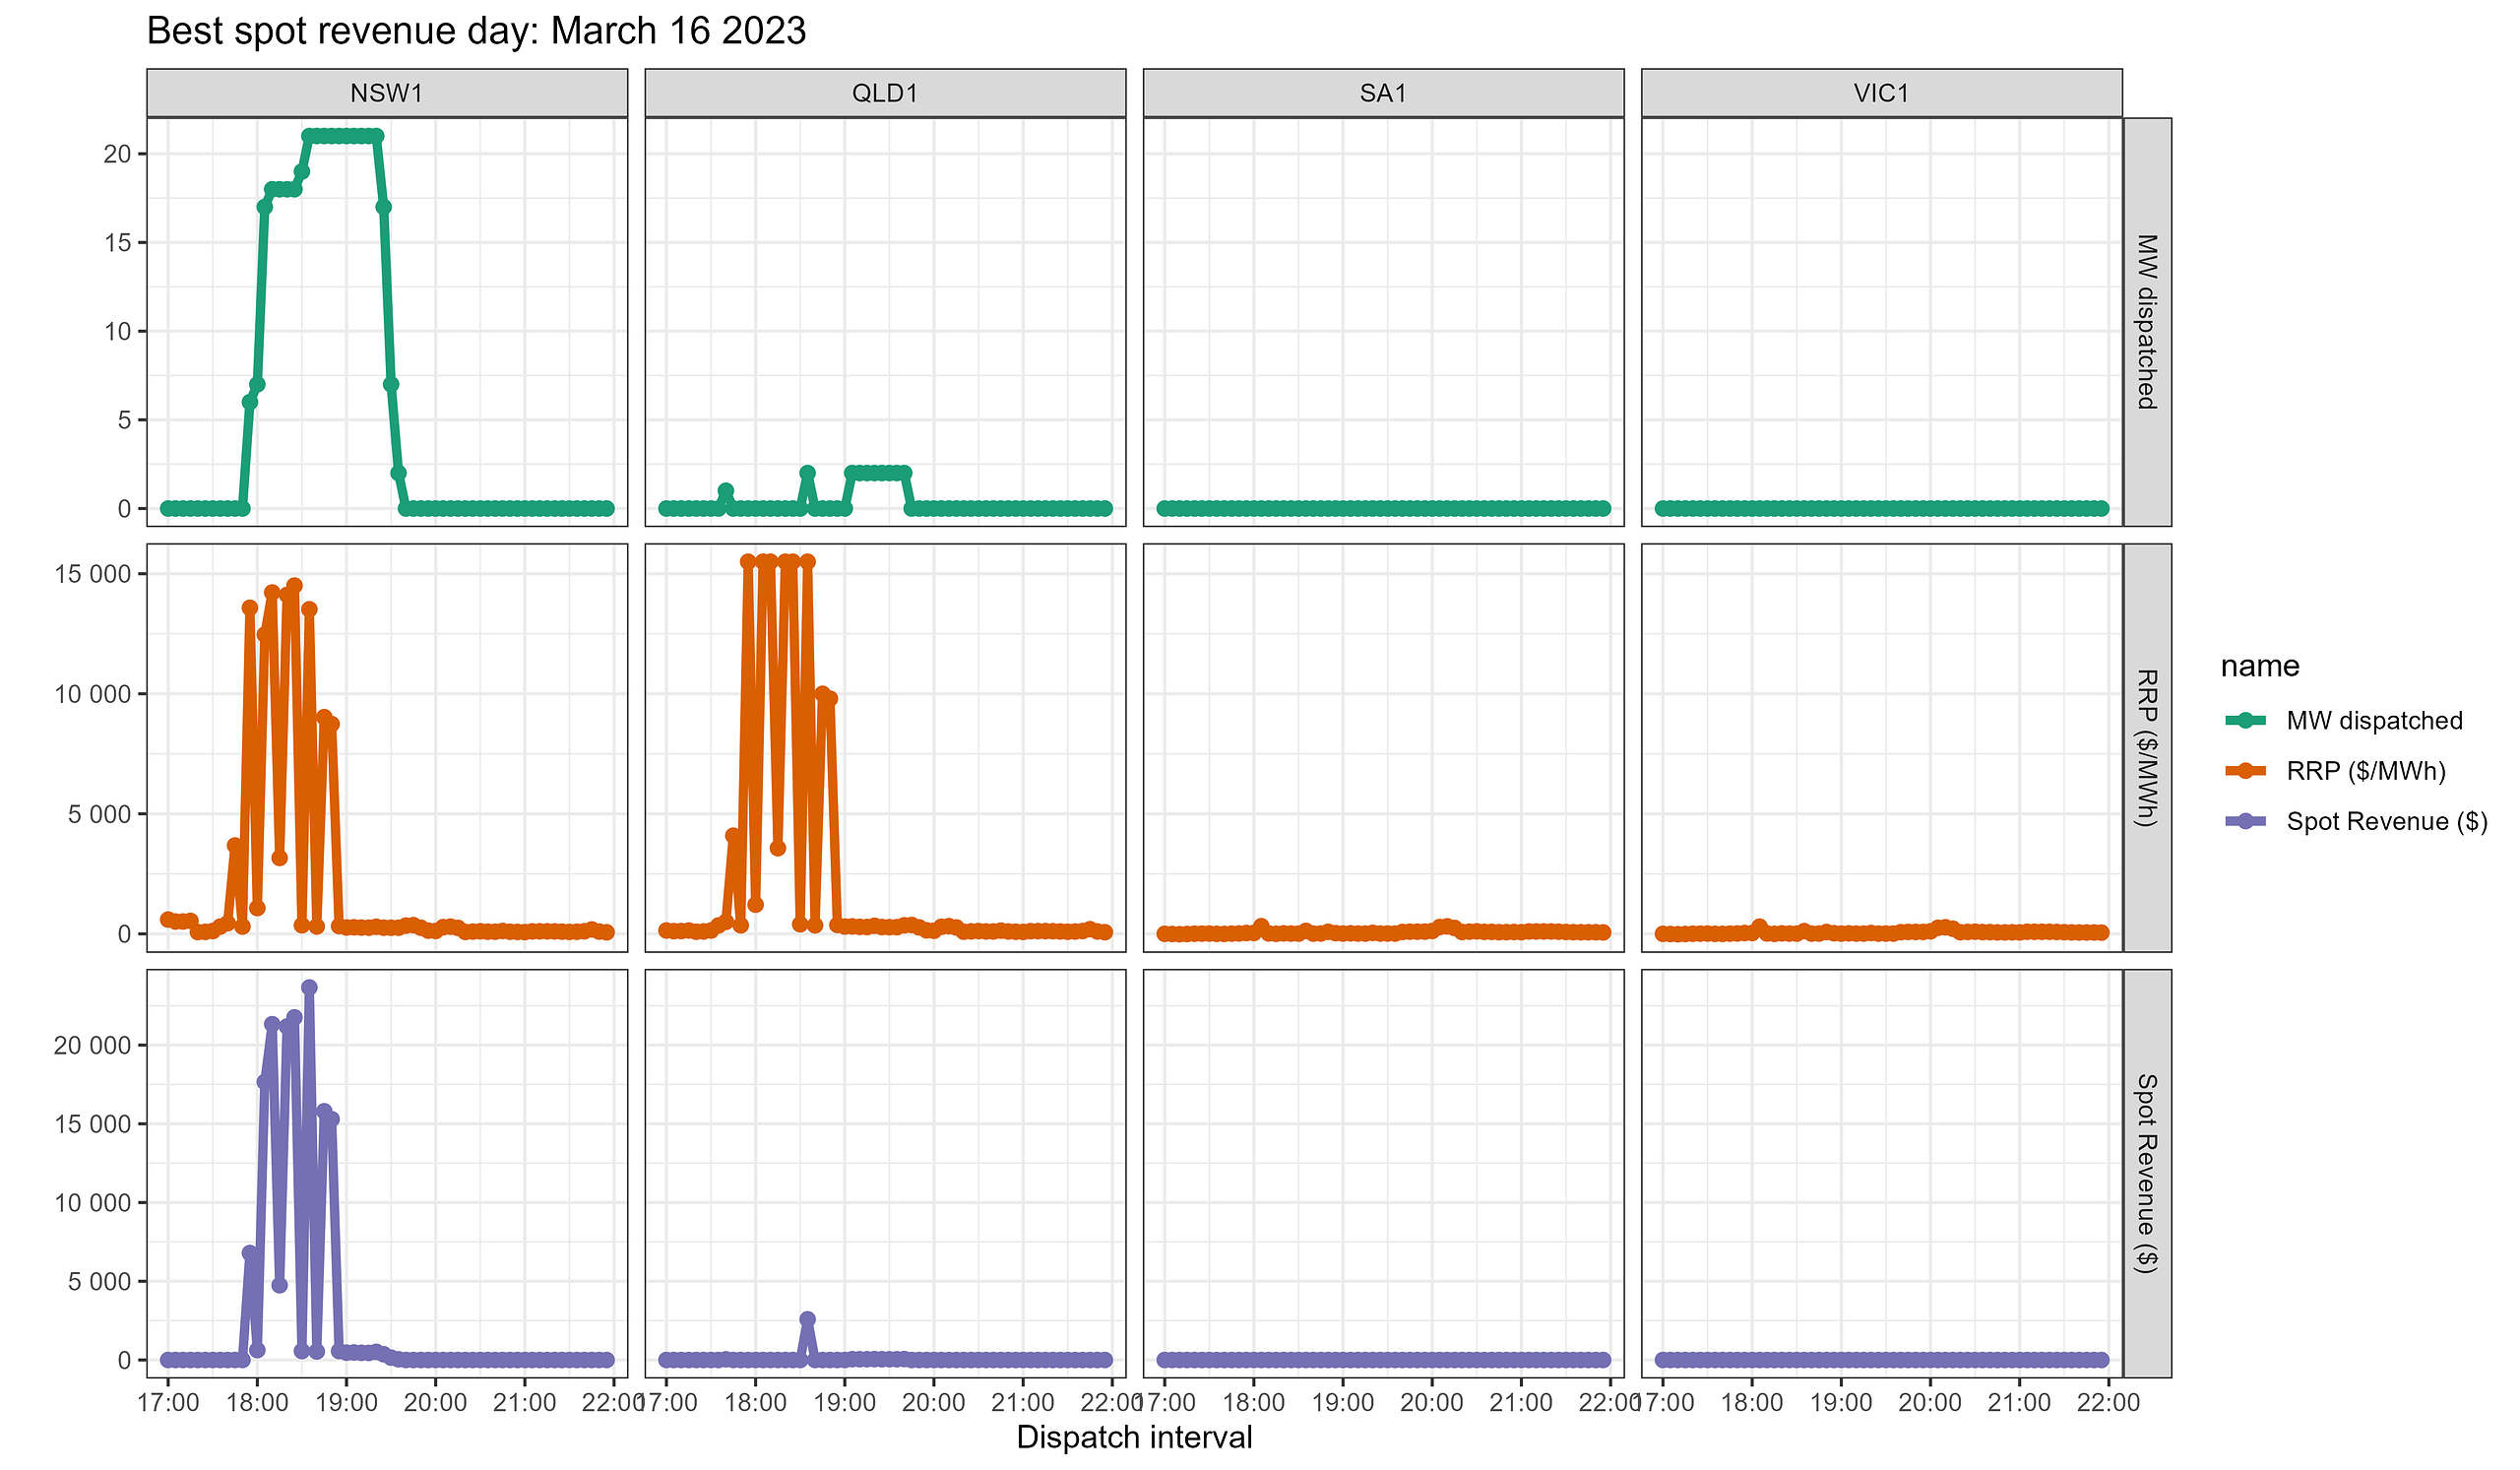
The 16th of March 2023 stands out as the day when the greatest revenue was earned (based on dispatch targets, not actual settlement data which is private to the participant). On the 16th, prices spiked in NSW and QLD between 5:45pm and 7:00pm NEM time.
The next chart summarises how WDR units in NSW seized the moment on March 16. It shows dispatch of WDR aligned well with the price spikes in NSW. Prices also spiked in QLD but there was little activity that aligned with the price volatility among registered WDR units on that occasion.
The 16th March was noted on WattClarity in Late ‘summer’ hot blast drives demand higher in NSW and QLD. Later that same day, an actual LOR2, and a run of volatility in NSW and QLD … only 34 days till the closure of Liddell unit 4 provided an update on the event.
From the perspective of prices and WDR dispatch, noteworthy aspects of the event of the 16th of March included:
- Hot and dry conditions in NSW and humid and hot in QLD.
- High levels of demand, low IRPM (instantaneous reserve plant margin) https://wattclarity.com.au/other-resources/glossary/irpm/
- A setting sun reducing PV output
- Constraint ‘N>>NIL_39_11’ restricted northward flows on the VIC-NSW that would otherwise have supported supply in NSW.
- A Lack of Reserve Level 1 declared for NSW, and later upgraded to Level 2.
- Short-notice RERT engaged in NSW and QLD, but not dispatched.
Daily revenue vs energy
The scatterplot of monthly spot revenue against dispatched energy shows that most days saw aggregate revenue below $40 thousand. There were only 2 days above this level.
How did we get here?
This section aims to capture some standout drivers that appear to be behind the current state of NEM WDR. I’m not professing to hold the explanations as to exactly how WDR participation and dispatch has worked out the way it has, merely aiming to list key aspects likely to have played a role.
We do need to have patience and play the long game in evaluating WDR’s impact and understanding its potential for the NEM. Two years is not a long-enough duration to cover a good spectrum of extreme demand and weather conditions. New facilities are surely yet to emerge with advances in technology and know-how.
The following aspects may have all played a role. It’s not an exhaustive list and any degree to which they’ve impacted WDR participation hasn’t been quantified. At least, not yet.
a) Other mechanisms or opportunities
The WDR Mechanism isn’t the only opportunity available to sites seeking reward for demand response in times when the market (or grid) needs it most.
Competing opportunities for demand response include:
-
- Being contracted for RERT (conditions apply, might miss out on securing a contract or being eligible).
- Programs that an electricity retailer offers (may reflect wholesale prices to some extent, may not offer same earning potential relative to wholesale spot prices under volatile conditions).
- Engaging with network service provider programs (generally in support of alleviating network impacts of demand rather than wholesale prices though the two may often correlate).
- Going ‘on spot’, becoming a market customer and paying the spot price (risky).
- Do nothing (avoid added complexity but forego the possibility of earning by switching off).
b) RERT (emergency reserves) in particular
The recent ESOO’s reliability outlook compelled RERT tenders be conducted for VIC and SA for summer 2023-24 to support the identified reliability risks in those NEM regions. AEMO sought capacity amounts of 118MW in SA and 120MW in Vic for 2023-24, and other amounts for subsequent periods.
It appears (based on the Interim Reliability Reserves Tender Questions and Answers Published 15 September 2023) that some wholesale demand response units may have been considering an exit from the market in order to be eligible for RERT instead of participating in WDR.
This was evident in questions relating to eligibility:
If an existing wholesale demand response unit exited the wholesale demand response market. What would need to happen to demonstrate to AEMO that they are now “out of market”…?
and
Presuming the wholesale demand response unit exited the wholesale demand response market with an effective date 1 Oct 2023, would they only be eligible to be contracted for RERT (either interim reserves or short notice RERT) from 1 October 2024?
Any material movement in capacity, to this end, hasn’t yet been noted in the registered capacity data. It may well be that any perceived benefits around RERT availability and delivery payments are somewhat offset by potential to miss out on securing a contract and or miss out on spot price volatility via the WDR mechanism.
c) Weather driven events
The past 12 months were atypical for weather. We saw a wetter and cooler-than-usual spring (2022) and summer (2022-23) associated with the slow transition out of a strong La Ninia period. A milder winter ensued in 2023. This seems likely to have helped suppress grid demand levels (and therefore prices).
d) Coal retirements
It’s not actually the retirement of Liddell in 2023 that has reduced opportunities for WDR, but there appears to be a recent trend in improved reliability of the remaining coal fleet that is currently operating. For example, Origin’s 2023 annual report covered by Paul indicated that there was very good reliability at Eraring – a less than 5% forced outage rate.
With improved dispatchable supply-side reliability there is less opportunity for price volatility.
e) Government Initiatives
The recent WDR year (October-ending) has come off the back of the 2022 energy crisis where heightened attention towards electricity supply and prices was rightly directed. In December 2022 the Energy Relief Price Plan was announced. It included elements aimed to reduce wholesale electricity prices via downward pressure on input fuel costs.
f) Barriers to eligibility
A number of eligibility requirements are in place to ensure AEMO can reliably determine whether a load has delivered on its scheduled response target. This includes permitting only sites that have one connection point to the grid. These requirements may be restricting some sites from getting involved.
A recent rule change proposal by Enel-X [link to AEMC site here] targets expanding eligibility to sites with multiple connection points. The proposal suggests the initiative could unlock an additional 300 MW of capacity. Yet this is still relatively small given peak demand in the NEM is nudging 33,000 MW.
Other reporting on the topic has noted ideas of tweaking the baseline methodologies to be more flexible. Obviously this would need to be balanced with requirements maintain accuracy and reliable assessment of delivered responses. In other words protect against rorting!
Further reading
In June 2023 AEMO released its report on WDR for the financial year.
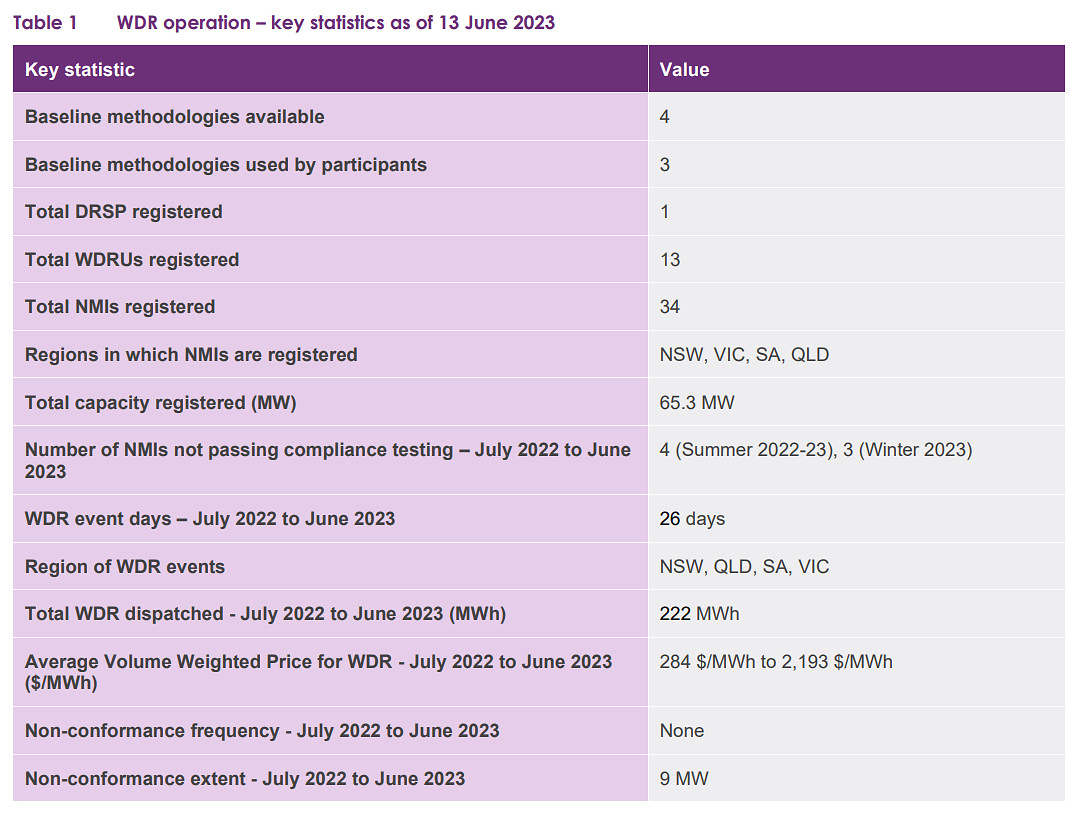
Table 1, reproduced below, summarises key statistics for the financial year. The report is a great resource. Of note it includes summaries of how participating sites have performed against eligibility requirements. The summary in table 1 touches on this, finding up to 4 (at most) out of 34 sites (NMIs) did not meet compliance testing at one point in the year. This compliance testing verifies that the methodology applicable to determine any demand response delivered can be adequately applied to the sites actual demand.
Leave a comment