It should be obvious (but is most often forgotten in the “excitement” that surrounds the release of key forecasts, like AEMO’s NTNDP, or the AEMC’s Pricing Forecast) that looking forward into the future is a mugs game (as previously noted).
It is, however, something we need to make a fist of, to make any sense of answering key questions about what we should be doing now to make the future better.
Unfortunately there are three main flaws in the forecasting process:
Flaw #1: A Model’s just a Model – it’s not reality
I’ve noted this before, a number of times, but it is worth stressing here.
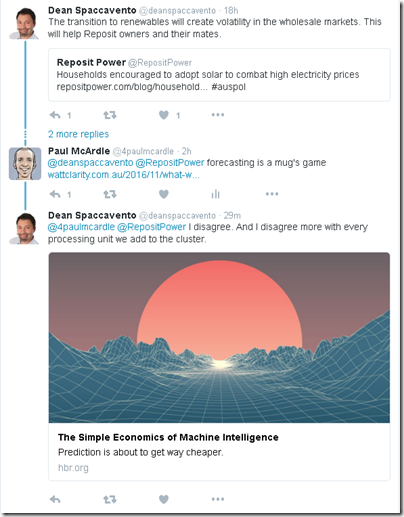
There is no model that exists (or even could exist) that can accurately represent all of the intertwined technical and commercial intricacies of the National Electricity Market. It is worth noting that there are those who might disagree with me, like Dean over at Reposit, who links to this article at HBR:
My own take is that models will certainly get better, but they will never be perfect. A key question, then, is what is the level of “good enough”?
Some of the current shortcomings in the models that exist today include:
1a) The good models currently model the fully interconnected transmission grid across the NEM, taking into account all (or almost all) “System Normal” constraint sets. However it is not possible to fully accurately model the effect of the transient constraints (e.g. such as the transmission outage that led to load shedding on 1st December), as (by definition) they cannot be known in advance. Unfortunately, because of the nature of pricing in the NEM (and especially how this is changing) it is these outliers that will have a hugely disproportionate effect on price outcomes across the year.
1b) As noted here, the NEM is a Market – and, as such, people in a market respond (on both the supply side, and the demand side). I’ve noted this before, including how we want this to happen – indeed, we need it to happen, for the market to deliver efficient outcomes. It does mean that we can guess at – but not know – how “the market” might respond to what’s actually happened, and expectations of what might happen in future.
1c) The NEM is also not an island. As others have noted, it’s impacted by other external factors – some of them market-based (like the RET, a market in and of itself) and some of them more policy-driven (or should I say “politics-driven”, like the broader response to the climate challenge).
In my experience, some models are better at the physical side than the commercial/economic side, whilst other models are the better on the economics than the engineering. All need to make simplifications.
All have their uses – but you’d better be sure you know of their strengths and weaknesses.
Takeaway #1 – Unless you understand the key simplifications made in that particular model (they all have them, but they will be different), and understand the significance of them, then you are very likely to be deluded by the results in some way.
Flaw #2: Garbage In = Garbage Out
We’ve all heard this one before, I would hope.
At the very least, the industry has (collectively) improved a long way from 20 years ago, when forecasts were released with great fanfare but analysis of the underlying assumptions might not even have been buried in an appendix. It’s why, for instance, we invested the time way back in 2008 to do this sort of analysis of successive demand growth forecasts – which just happened to be (coincidence) around the time that demand growth began to flatten off, and then decline.
However the macro demand numbers (energy and peak) are but a few of the great many input assumptions made in any model. Giles has included his own critique of one particular modelling exercise here (and a particular comment by David Pethick below that article is also worth particular attention).
Back 20 years ago, models had to deal with variability of demand, and randomised forced outage patterns of thermal generators. Both difficult, but do-able to some extent. To that mix we now have to add in a number of other independently variable factors that are different to model over a longer time horizon:
2a) variability of energy stored in hydro storages (as everyone was blindsided about with the 2007 drought).
2b) variability and diversity of wind harvest patterns from wind farms – one reason I have been intrigued by the surprising lack of diversity across the current stock of wind farms in the south-western part of the NEM. With wind, we only have 5-10 years of history, so not enough to form a complete picture of any longer-term performance challenges that the turbines might encounter (and which should be taken into account in long-term modelling)
2c) variability and diversity of solar production patterns from small-scale solar PV, and also the few large-scale plant currently existing.
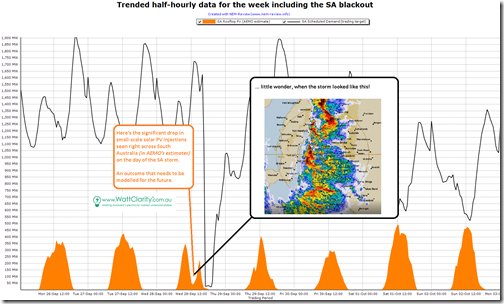
Take, for instance, the fact that the storm that blanketed South Australia on September 28th and led to the state-wide blackout also had the effect of covering pretty much the entire state and so severely curtailing solar production, as seen in this chart from NEM-Review:
Now let me be very clear here, for the emotional finger-pointers at both ends of the Emotion-o-Meter:
i) my point here has nothing to do with the blackout.
ii) my point is that we have a real case, here, where a state-wide storm has temporarily dropped the entire solar production for the state by 80-90% over a period lasting several hours. These types of incidents (e.g. the frequency and duration) will need to be taken into account in modelling as the NEM transitions to one heavily dependent on solar production. This task will be made harder by the opacity of solar PV.
2d) in the near future modellers will also need to incorporate input assumptions about battery storage (both large scale and distributed) – particularly in terms of:
i. How much will be deployed – where, and when; and then
ii. How it will be operated – by whom, and what their commercial drivers are (e.g. tariff arbitrage, or spot market trading, or other); and
[more on this one in 2017]
2e) there are others, as well…
Suffice to say that more attention should be focused on the input assumptions made by the modeller in running a model. Some might see that as an exercise in “disproving” the results of a given model – I view it as a more general process of saying “given that you assumed X, and the Model produced Y, what can we learn about what might really happen”
Takeaway #2 – We need to invest more time to understand the input assumptions made in the modelling.
Flaw #3: Consultants are only human – they (like all of us) talk their own book
I’ve also notice a trend for people to adopt their favourite forecaster, and to bag their “least favourite” ones – a trend which seems to be based on the degree to which the outputs from the modelling exercise align with the recipients own preconceived notions of what the outcome should be.
It’s part of the bigger game that’s called “Consultants at 20 Paces” which I spoke about in 2014 here.
Here’s a recent case:
As I noted in response, everyone is talking their book – referencing the comments I had made previously here. The sooner we all accept that (including the fact that we are no different ourselves) the sooner we can progress to a place better equipped to deal with the insights a particular consultant might be providing.
Takeaway #3 – Learn how each individual forecaster might be biased in order to factor this into the results they provide, and (they all have them, but they will be different), and understand the significance of them, then you are very likely to be deluded by the results in some way.
In summary, software’s not perfect (flaw #1), nor are humans (flaw #3) and data can lie (flaw #2). With this in mind, I hope we can (collectively) approach the modelling that will need to be done in future with more of an open mind…
[Oh, and next time someone tells you that some particular model “proves” a particular outcome (which just might align with their tightly held beliefs), feel free to reply that Forecasting is a Mug’s Game, and direct them to this post]


The problem is you’re trying to model an extremely variable and complex system when it’s obvious you should stick to computer modelling a simple system like climastrologists do.
As someone responsible for a fair few modelling exercises I concur with a lot of what you say Paul.
Two additional observations:
1) Modelling is not the same as forecasting. Non-modellers in particular too frequently seem to believe that anything coming out of a “complex” model must be a forecast, and far too often go on to treat the results as holy writ.
You’ve clearly pointed out the plethora of challenging assumptions needed to feed any model, and the real world uncertainties and unknowables that models cannot adequately capture. I’d argue that these difficulties have increased in uncertainty and complexity in recent years (consider the future price / availability of gas for power generation as just one example).
Given this, treating any single set of model outputs as a prediction of the future, rather than just a scenario reflecting a particular set of inputs and modelling method, is naïve at best and quite disingenuous if done deliberately.
2) Modelling and model results are too often employed to advance particular policy positions. This is related to your point about modellers talking their own book, but I guess my observation is that once every policy position is advanced and buttressed with the support of sophisticated (but often opaque) modelling, presumably with the aim of rendering it immune from debate and criticism, it actually devalues the modelling process in general.