On 10th September our 17th Case Study in the series was published – looking at a case on 6th March 2019 where Semi-Scheduled units collectively underperformed by +329MW.
If we wind the clock forward 19 days now, to 25th March 2019, we have our 18th Case Study looking at two dispatch intervals in the middle of the day of extreme* under-performance on Monday 4th February 2019.
* in terms of ‘extreme events’, we’re specifically looking at Dispatch Intervals where there has been:
Scenario 1) more commonly ‘large’ collective under-performance across all Semi-Scheduled units (being measured as Aggregate Raw Off-Target > +300MW); or also
Scenario 2) much less frequently ‘large’ collective over-performance across all Semi-Scheduled units (being measured as Aggregate Raw Off-Target <-300MW).
(A) Background context
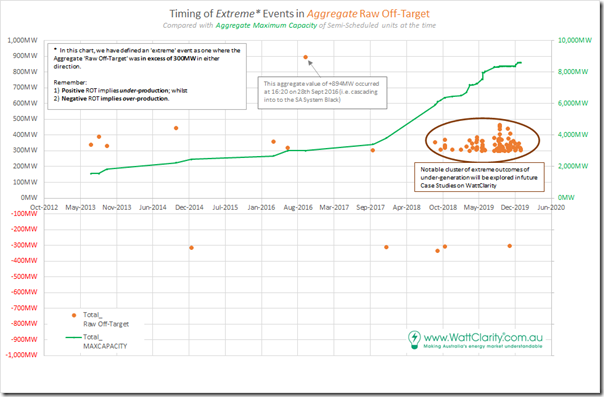
Remember that we identified a total of 98 discrete instances where aggregate Raw Off-Target across all Semi-Scheduled units was either:
(a) above +300MW (representing collective under-performance) or, much less commonly,
(b) under –300MW (representing collective over-performance relative to AEMO’s expectations, seen in the Dispatch Target).
There was a smattering of only 10 cases through 2013, 2014, 2015, 2016, 2017 and through until August 2018. However thereafter (to the end of 2019) there was a sharp escalation of extreme incidents – as seen in the following chart:
Note also that we have not yet looked into 2020 data, which will be the focus of the GSD2020 (so we can’t comment on whether the trend from 2019 has continued to grow).
We’re doing this given a push from the AER Issues Paper, but moreso inspired by the deliberations by the (now defunct) COAG Energy Council and (extended?) ESB relating to ‘NEM 2.0’. Note that these case studies deal with imbalance in the Dispatch Interval timeframe, but readers should understand that there are other challenges that ‘NEM 2.0’ also needs to resolve, including:
Other Challenge #1) Within the dispatch interval timeframe, energy-related services focused on frequency maintenance and response to contingencies;
Other Challenge #2) Relating to ‘firmness’ of supply in the broader forecast horizon; and
Other Challenge #3) Others that we bundled into a ‘keeping the lights on’ services in our discussions in the Generator Report Card 2018 (for instance, in relation to System Strength).
In preparing these focused Case Studies, we’re seeking to understand why and what the implications are of this escalation.
(B) Results over 2-Hour period
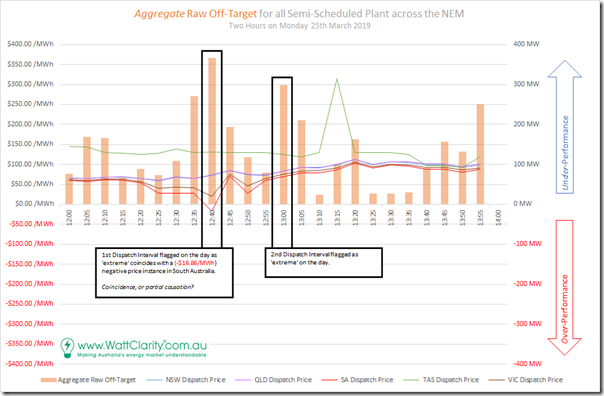
In this Case Study looking at 5 events that occurred on Wednesday 17th November 2018, we took a look across 5 hours in the day to understand how the calculated Aggregate Raw Off-Target value trended over time. We’ll do the same here, just over a shorter period of 24 dispatch intervals:
From this trend:
Observation #1) we see that every single dispatch interval was of collective under-performance.
Observation #2) whilst there are understandable reasons why under-performance is more prevalent than over-performance (to do with the way in which the Semi-Scheduled category operates) it also reinforces the misleading simplicity of the (mistaken) belief that might be summed up as ‘the unders and the overs will cancel each other out’ as a reason not to be too concerned about the scalability of the Semi-Scheduled category as it currently works.
Observation #3) I have also highlighted the 12:40 dispatch interval as one where the dispatch price dropped just below $0/MWh coincident with the largest instance of Aggregate Raw Off-Target. Given the concerns raised in the AER Issues Paper, we’ll need to remember to look (below) to see if any generator deliberately under-performed in this interval – the act of which would have made an extreme outcome more extreme?
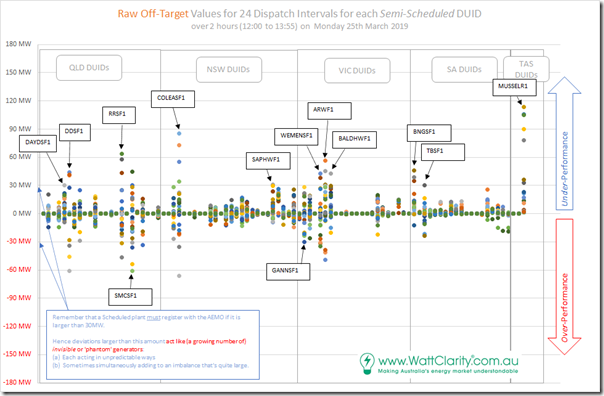
Looking at the individual data for all DUIDs operational at the time, we can clearly see the DUIDs that were the biggest non-performers during this 2-hour period:
We’ll start with the three DUIDs that show Raw Off-Target of greater than 30MW, a quite significant deviation for an individual unit. Remember that the choice of what’s ‘large’ is a little subjective – however I have based it on two things:
Criteria #1) Practical considerations, like my time constraints in drilling into each instance – not to mention my sense of a reader’s patience in working through these articles;
Criteria #2) More holistically, though, I have also made the choice based on the fact that 30MW has been the historic threshold where a dispatchable asset must be registered with the AEMO and operate as a Scheduled Generator. Keep in mind that the registration threshold for a battery is 5MW (i.e. it was seen that 30MW was too large a tolerance for invisibility).
… so for now 30MW seems a good criteria for me to also use in looking at the growing number of invisible, and quite random ‘phantom generators’ we have entering the NEM which are operating as the ‘evil twin’ of a Semi-Scheduled generator which would be fully predictable in a dispatch time horizon through the AWEFS and ASEFS processes.
… so we see…
Observation #4) Of the 68 Semi-Scheduled DUIDs operational on this day, there were 13 (or 20% of the total) that displayed ‘phantom’ generators operating invisibly to make the AEMO’s job more difficult in balancing supply and demand.
#4a) Certainly a non-trivial number!
#4b) Of these:
i. Four were Wind Farms (SAPHWF1, ARWF1, BALDHWF1 and MUSSELR1 having the largest individual divergence)
ii. Leaving nine that were Solar Farms (DAYDSF1, DDSF1, RRSF1, SMCSF1, COLEASF1, GANNSF1, WEMENSF1, BNGSF1, TBSF1)
#4b) A number of others showed results at 28MW and 29MW, so not far off our criteria for ‘extreme’.
(C) Focusing on Two Dispatch Intervals
So let’s delve into the two dispatch intervals specifically flagged in this broader list of 98 x extreme outcomes:
(C1) The 12:40 dispatch interval (Aggregate Raw Off-Target +367MW)
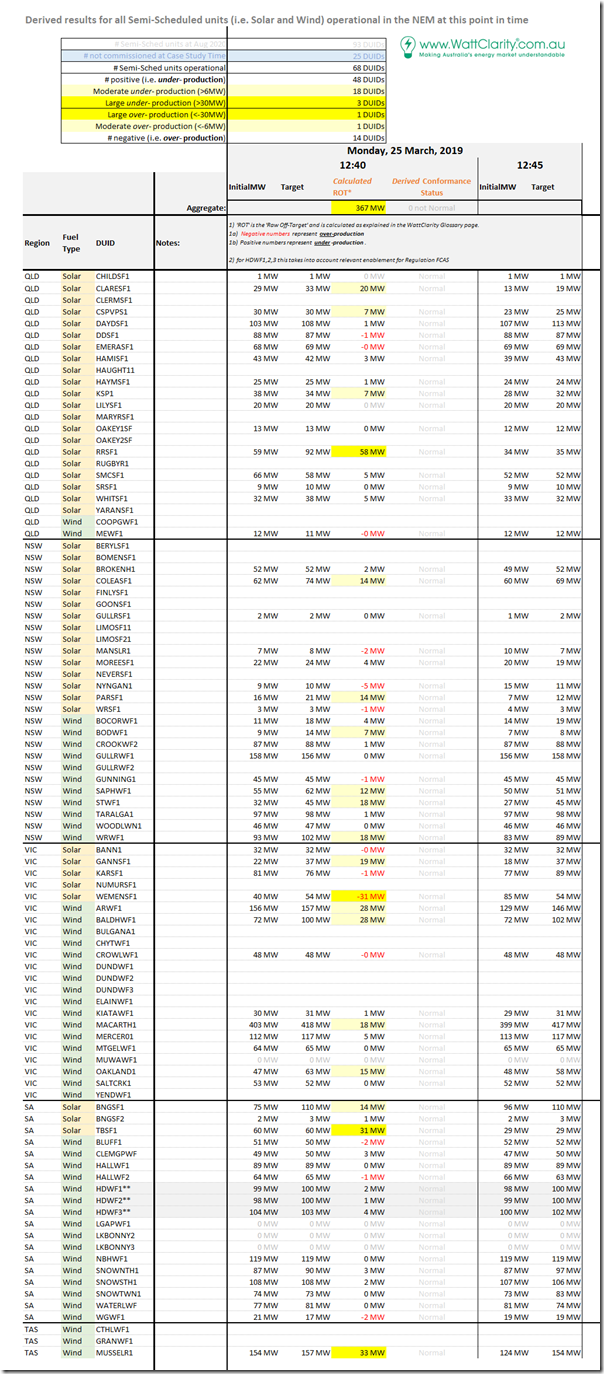
Here’s the same tabular framework of results for individual Raw Off-Target performance of all 68 x Semi-Scheduled units that were operational at the time:
In summary from this table, we can see the following:
1) Of the 68 DUIDs registered at the time, there are 342% the number under-performing (48 DUIDs) as there are over-performing (14 DUIDs).
2) Of the units highlighted as having Raw Off-Target greater than 6MW (a threshold that is one of the inputs in determining Conformance Status for a unit), we see the split is even more unbalanced:
(a) 18 DUIDs flagged as under-performing by at least 6MW (with 3 of these under-performing by more than 30MW); whilst
(b) Only 1 DUID flagged as over-performing by at least 6MW (with this one over-performing by more than 30MW).
… which, needless to say, is a very skewed ratio (and not the first time we have seen it, either).
One more reminder of how the commonly touted belief that I might paraphrase as ‘the unders and overs will average out’ just does not hold true, at least in many of these extreme events.
Once again we use the ‘Unit Dashboard’ widget in ez2view (and the ‘Time Travel’ powerful rewind functionality) to review what some of the core stats were for this point in time for each of the units flagged as having significant Raw Off-Target:
(C1a) A dispatch interval with Market Intervention
… however before we investigate individual unit performances, it’s worth noting that this dispatch interval (and also 13:00 below) were subject to Market Intervention. This was telegraphed in Market Notice 67869 to market participants, and more broadly, as captured in this snapshot from ez2view featuring 3 widgets:
As noted on the two copies of the ‘NEM Prices (beta)’ widget in this snapshot, Market Intervention results in two different sets of prices produced for all 45 Region-Commodity combinations, so participants need to be really careful which one they are referring to to make decisions!
In this case, we see that the prices don’t vary significantly – but sometimes we have seen that they are very different (and can lead to expensive mistakes!)
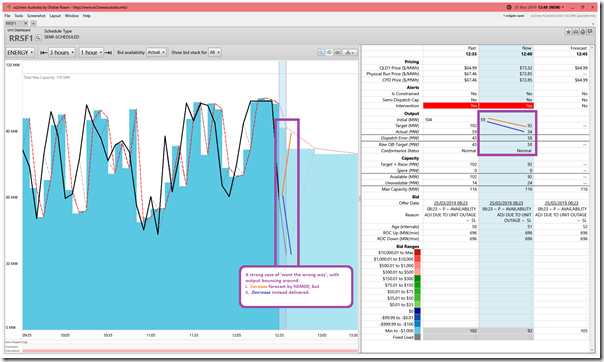
(C1b) Rugby Run Solar Farm (+58MW under-performance) in QLD Region
Here’s what RRSF1 looked like:
We see that the output has been bouncing up and down like a yoyo in the past 3 hours to this point – so it should be no surprise that this occasion sees an (albeit very large) case of ‘went the wrong way’ where:
i. NEMDE thought the unit would increase from 59MW to 92MW;
ii. But instead it reduced from 59MW to 34MW;
iii. Which meant, as a result, a Raw Off-Target figure as high as 58MW … or 50% of the (116MW) Max Capacity of the unit.
When we see instances like this, we see the underlying challenges that ASEFS is needing to try to address.
As noted before, the Conformance Status of the unit is still sitting at ‘Normal’ as the Semi-Dispatch Cap has not been flagged (requiring the operator to pay attention to Target). This difference to the approach taken to Scheduled plant stems from an assumption that the benefits outweigh the costs …. however I have questions about the scalability of the Semi-Scheduled category as it currently stands.
At this point in time (I have not checked specifically but) I believe is too early for self-forecasting to have been in use. We will have a very keen interest in assessing the degree to which self-forecasting is reducing the incidence of these extreme results when we crunch the numbers again for the Generator Statistical Digest 2020, especially because Jonathon Dyson had noted in his talk on Thursday that the take-up of self-forecasting for solar farms was considerably higher than it has been for wind farms (it’s seen as an easier problem to solve, so more potential vendors becoming involved to develop different IP).
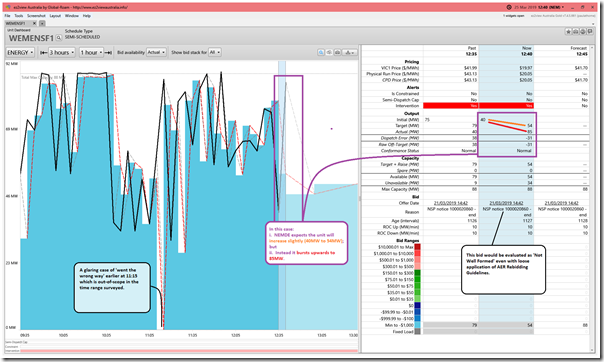
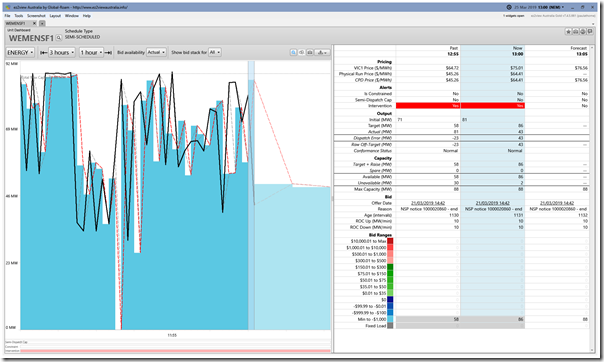
(C1c) Wemen Solar Farm (-31MW over-performance) in VIC Region
Here’s what WEMENSF1 looked like:
In this particular instance, we can be grateful for this single large over-performance, as otherwise the aggregate under-performance would have been even more extreme. However a insight growing clearer through these case studies is that these happy coincidences cannot be depended upon!
i. We see that the unit was expected to increase its output by NEMDE, just ended up being supercharged to exceed the Target by a large (i.e. 31MW) margin.
ii. Also jumping out to me was the glaring case of ‘went the wrong way’ earlier at 11:15
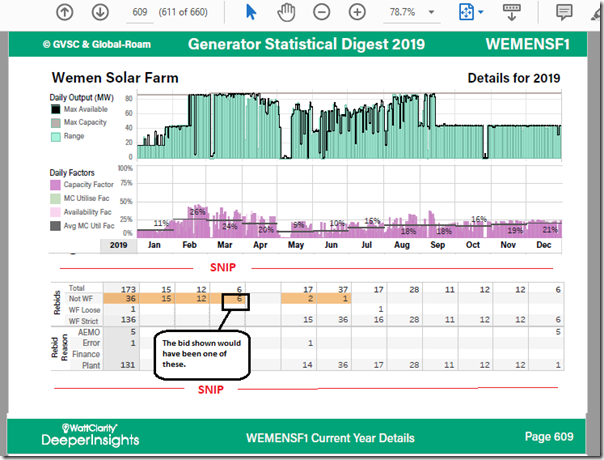
iii. Finally, the form of the rebid reason jumped out at me as well – would be been one evaluated as ‘Not Well Formed (loose)’ with the automated parsing of rebid reasons through 2019 across all Scheduled and Semi-Scheduled units as part of the Generator Statistical Digest 2019, shown here in the ‘B Page’:
On Thursday last week, Jonathon Dyson spoke about the importance of remaining ‘Compliant’ with respect to AER Guidelines and Market Rules. Great to see that the instances of bids being ‘Not Well Formed’ had ended from July 2019.
We’ll look at 2020 bids for the GSD2020.
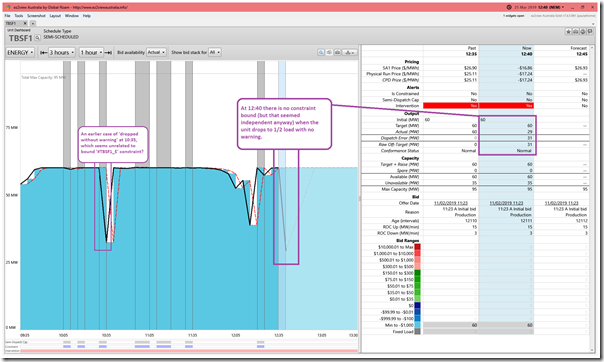
(C1d) Tailem Bend Solar Farm (+31MW under-performance) in SA Region
Here’s what TBSF1 looked like:
On this occasion the unit ‘drops without warning’:
i. NEMDE had expected the unit to continue sailing steady at 60MW, as it had been for much of the past 3 hours; but
ii. For reasons unknown, the unit drops from 60MW down to 29MW.
iii. It does not seem that the negative price in South Australia has anything to do with what happened here?
iv. Perhaps the plant was having some form of physical issues (we note an earlier case of this at 10:35).
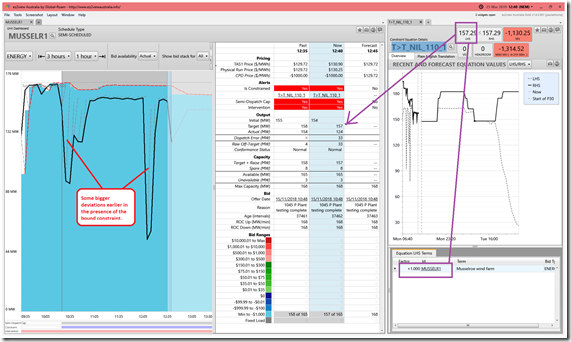
(C1e) Musselroe Wind Farm (+33MW under-performance) in TAS Region
This is the first time MUSSELR1 has appeared in any of these case studies, I believe:
The constraint ‘T>T_NIL_110_1’ is bound, seeking to put a cap on the output of the Wind Farm. We see the simple form of the Left-Hand Side (LHS) in this case is just 1 x Dispatch Target MUSSELR1.
The constraint drives the CPD Price down to –$1,000/MWh, but the volume is bid down there so all this does is limit the output to 157MW from an energy-constrained AvailGen computed by AWEFS of 165MW for the dispatch interval (with the calculation based on wind speed, number of turbines in service, etc because the Semi-Dispatch Cap flag status is on).
So in summary:
i. the constraint seeks to reduce the output slightly (i.e. 157MW of 165MW seen possible)
ii. but instead the unit drops from 154MW down to 124MW
iii. which results in the 33MW Raw Off-Target.
I noted above that this is the first time I remember Musselroe featuring in these Case Studies.
i. I wonder why this has been the case – and whether it’s the operation of AWEFS under this particular constraint that has revealed a challenge?
ii. Certainly there are some large deviations shown in the 3 hours beforehand! We can see these in the 3rd chart at the top.
(C2) The 13:00 dispatch interval (Aggregate Raw Off-Target +300MW)
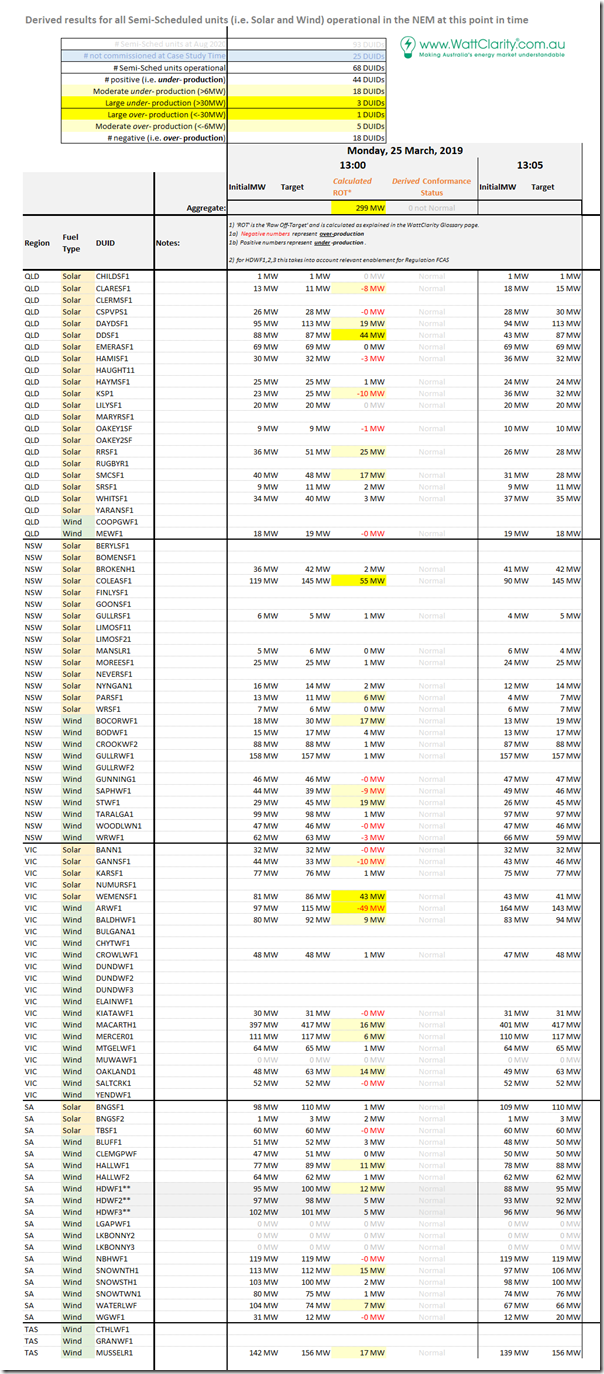
Here’s the same tabular framework for the second incident:
In summary from this table, we can see the following:
1) Of the 65 DUIDs registered at the time, there are 244% the number under-performing (44 DUIDs) as there are over-performing (18 DUIDs).
2) Of the units highlighted as having Raw Off-Target greater than 6MW (a threshold that is one of the inputs in determining Conformance Status for a unit), we see the split is even more unbalanced:
(a) 18 DUIDs flagged as under-performing by at least 6MW (with 3 of these under-performing by more than 30MW); whilst
(b) There were 5 DUIDs flagged as over-performing by at least 6MW (1 of which was over-performing by more than 30MW).
… also a very skewed ratio.
Once again we use the ‘Unit Dashboard’ widget in ez2view (and the ‘Time Travel’ powerful rewind functionality) to review what some of the core stats were for this point in time for each of the units flagged as having significant Raw Off-Target:
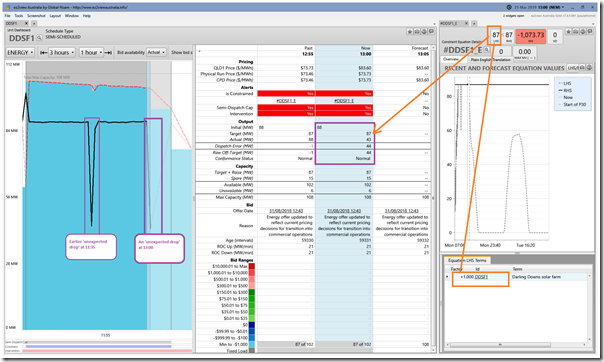
(C2a) Darling Downs Solar Farm (+44MW under-performance) in QLD Region
Here’s what DDSF1 looked like:
In this case, the bound ‘#DDSF1_E’ constraint is seeking to cap the output of the solar farm to no more than 87MW – which is where it has been sitting for much of the past 3 hours, except for:
i. An earlier case of ‘unexpected drop in output’ at 11:35; and
ii. This case of ‘unexpected drop in output’ at 13:00.
Note also (not annotated on the image) that this bid shown here would also have been evaluated as ‘Not Well Formed (loose)’ with the automated parsing of rebid reasons through 2019 across all Scheduled and Semi-Scheduled units as part of the Generator Statistical Digest 2019. No time to show the ‘B Page’ here…
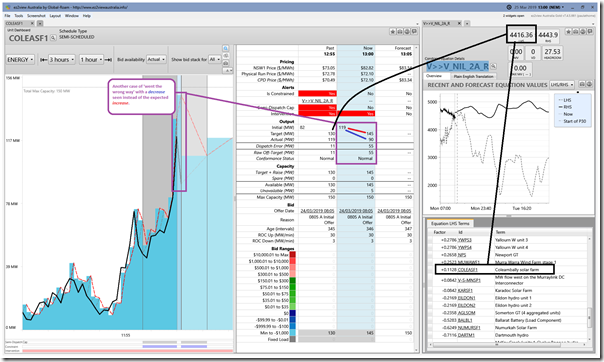
(C1b) Coleambally Solar Farm (+55MW under-performance) in NSW Region
Here’s what COLEASFSF1 looked like:
This is another case of ‘went the wrong way’ with:
i. NEMDE expecting that the output would increase from 119MW up to 145MW; but
ii. instead the output falling down to 90MW
iii. meaning a combined discrepancy of +55MW Raw Off-Target (i.e. under-performance).
In the prior dispatch interval the output had been slightly affected by the bound ‘V>>V_NIL_2A_R’ constraint. However we see the Factor was only +0.1128 so no real impact, especially with bid down at –$1,000/MWh.
(C1c) Wemen Solar Farm (+43MW under-performance) in VIC Region
WEMENSF1 also featured above at 12:40 in a case of ‘went the wrong way’. Here’s the snapshot 20 minutes later, with a higher deviation:
In this case, the deviation is an under-performance – just a reverse case of ‘went the wrong way’.
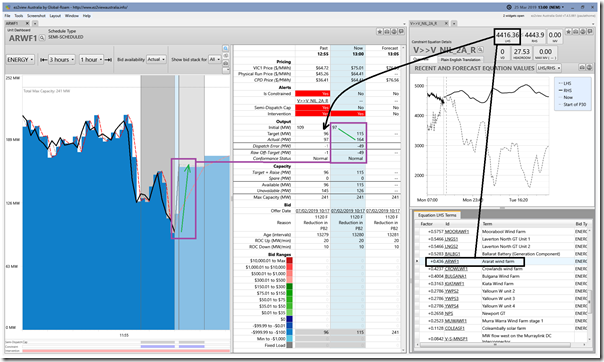
(C1d) Ararat Wind Farm (-49MW over-performance) in VIC Region
Here’s what ARWF1 looked like:
In this case, we see the Wind Farm coming out from under the ‘V>>V_NIL_2A_R’ in this dispatch interval, enabling the Target to suggest an increase in output from 97MW to 115MW. What actually happens is a turbo-boost on output to 164MW, resulting in a significant (-49MW) over-performance.
In this particular instance, we can be grateful for this single large over-performance, as otherwise the aggregate under-performance would have been even more extreme. However a insight growing clearer through these case studies is that these happy coincidences cannot be depended upon!
That’s all I have time for this evening in this 18th Case Study in the series.


![2019-03-25-at-12-40-ez2view-Intervention] 2019-03-25-at-12-40-ez2view-Intervention]](https://wattclarity.com.au/wp-content/uploads/2020/09/2019-03-25-at-12-40-ez2view-Intervention_thumb.png)
Unfortunately this raw annalysis does not explain the uderlying reasons for lack of generation e.g. low wind or cloud or was it that the full capacity of these generators was not commited and why steps were not taken to avoid the problem.
Alexander, you might be misinterpreting what these case studies are about.
These are not so much focused on lack of generation, but on the fact that there is an underperformance compared to what AEMO was expecting 5 minutes before in the dispatch target.
Whilst some instances might be due to challenges with fast-moving cloud, or fast fluctuations in wind, there are other factors as well – as the case studies are progressively revealing.