On Thursday 23rd February 2023 we emailed our Annual Newsletter to our distribution list. In that newsletter we noted that we’d share a couple of snippets from the 198-page GenInsights Quarterly Update for Q4 2022.
Since that time we’ve shared on WattClarity a couple excerpts from that report:
1) On Monday 27th February 2023 we published ‘Some revelations in GenInsights Q4 2022 about Self-Forecasting’ (pertaining to some Semi-Scheduled wind and solar farms).
2) On Monday 6th March 2023 we published ‘Unavailability of coal units hits 24% across calendar 2022’ (speaking to one other major challenge of this energy transition!).
3) This article today shares a third excerpt from GenInsights Q4 2022 … and relates to all Semi-Scheduled wind and solar farms
(A) Some background to Aggregate Raw Off-Target (AggROT)
For a number of years we’ve provided an explanation of the ‘Off-Target’ metric in this WattClarity Glossary Page. Given we have been increasingly extending the metric to be Aggregate Raw Off-Target (which we frequently abbreviate to AggROT) we’ve created its own description here in the WattClarity Glossary.
In Appendix 17 within GenInsights21 we utilised this metric to investigate the collective performance of both Coal Units, and also Wind and Solar … and have also included analysis in several articles on WattClarity.
(A1) Aggregate Raw Off-Target for Coal Units
For a period of time (and particularly with respect to calendar 2019) we published
1) On 5th May 2020 in the article ‘Balancing Supply and Demand … in the fast approaching NEM 2.0 world’ we:
(a) contrasted AggROT for ‘all wind’ against AggROT for ‘all coal’ using data from the GSD2019.
(b) we also identified several extreme events for both categories:
i. The biggest collective underperformance for ‘all wind’ through 2019 was at an AggROT of +375MW whilst the biggest collective under-performance from ‘all coal’ was at an AggROT of +709MW.
ii. The biggest collective overperformance for ‘all wind’ through 2019 was at an AggROT of -301MW whilst the biggest collective under-performance from ‘all coal’ was at an AggROT of -357MW.
2) More recently from GenInsights Quarterly Update for Q4 2022, we highlighted on 6th March 2023 that, whilst unavailability continues to climb for coal units, the incidence per calendar year of AggROT across all 44 coal units being above 300MW remains in the same band as has been the case for the past 20 years.
(a) Each year we see between 20 and 50 dispatch intervals in which AggROT across all the 44 x coal units is >+300MW (i.e. around the size of the smallest unit)
(b) The level in 2022 and 2021 was lower than in 2020, and towards the lower end of the range seen in the 20 year history.
(c) At least by this measure, coal units (as a whole) are not collectively underperforming by more than 300MW* any more than has been the case through NEM history.
* such as when a unit trips within a dispatch interval
… we understand that this conclusion might be a little different than what some readers might have been thinking based on commentary elsewhere.
(A2) Aggregate Raw Off-Target for Wind + Large Solar Units
With respect to the collective deviations from Target across all Wind and Large Solar Farms (i.e. the Semi-Scheduled ones, remembering this cannot be calculated for Non-Scheduled units) there have been a number of articles written, but worth specifically highlighting these three articles in 2020:
1) As noted above, the article ‘Balancing Supply and Demand … in the fast approaching NEM 2.0 world’ included results from GSD2019 for ‘all wind’ as well as ‘all coal’.
2) On 17th July 2020 we wrote ‘Semi-scheduled generation–what are the real issues?’.
3) On Friday 24th July 2020 we posted ’Striving to understand the underlying challenges with Semi-Scheduled generators (re AER Issues Paper)’ in which we included some headline results for analysis we’d extended to:
(a) be aggregated across all Semi-Scheduled DUIDs (i.e. all Large Solar and most Wind units); and
(b) looked at how results trended over >10 years that the Semi-Scheduled category.
4) Then on 27th July 2020 we wrote ‘Extrapolating from the trend of ‘Aggregated Raw Off-Target’ results, to yield some clues to what the future might hold … and one challenge for NEM 2.0’ …
… at the bottom of that article:
(a) we’d included a table listing a number of specific instances (from 2013 through until 2019) when AggROT for Wind and Large Solar had exceeded 300MW (in a positive or negative sense) – note that there were many more instances in 2019 than in any prior year.
(b) subsequently, a number of those instances were investigated with Case Studies linked back into that article.
Through 2021 a significant analytical exercise was conducted leading to the release of GenInsights21 on 15th December 2021.
1) As noted above, Appendix 17 included detailed analysis of the collective performance of Wind and Large Solar units.
2) In particular as Key Observation 13/22 in GenInsights21 we repeated the question ‘Is the Semi-Scheduled Category category sustainable or scalable?’ that we have been pondering about for a number of years.
… because we continue to ponder this question (and others may be as well) we thought it worthwhile sharing here today in its entirety.
Following from that, in her article ‘What does the future hold for Wind and Solar in the NEM – seen via GenInsights21?’ on 11th February 2022, Marcelle included some excerpts from GenInsights21, including some of the analysis of Aggregate Raw Off-Target for Wind and Solar units. Marcelle noted …
‘It’s expected that there will be some uncertainty in the output of wind and solar farms given the uncertain fuel inputs, and the NEM can manage small deviations through existing FCAS services, but larger deviations (especially above 300 MW) can be risky to power system security.’
… and …
‘In the last few years it’s clear that there are fewer intervals with very low off-target, and many more in the 100-200 MW range, plus increasing incidence of higher-deviation intervals.’
(B) The trend still remains the same
On Tuesday 14th February 2023 we* released GenInsights Quarterly Update for Q4 2022:
* noting again that this was a collaborative effort between some of us at Global-Roam Pty Ltd (the producers of WattClarity) and the analytical team at Greenview Strategic Consulting.
This 198-page report contained a 64-page Appendix 3 focused on several different analytical pieces in relation to Large-Scale Wind and Solar (i.e. we covered rooftop PV separately in Appendix 2 in the context of ‘Grid Demand’).
1) We’ve already published here ‘Some revelations in GenInsights Q4 2022 about Self-Forecasting’ that came from this same Appendix;
2) Today we look specifically at Aggregate Raw Off-Target statistics for Semi-Scheduled units.
Here are some results…
(B1) Growing incidence of large collective deviations
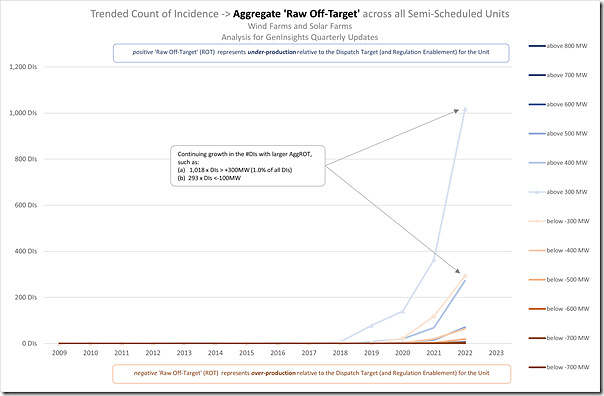
Let’s start by looking at the trended annual incidence of Aggregate Raw Off-Target being above 300MW in either direction:
We see in full-year calendar 2022 that:
1) In terms of collective under-performance 300MW of larger (i.e. AggROT >+300MW):
(a) There were 1,018 dispatch intervals where the collective under-performance across all wind and solar across the year…. which equates to an average of about 2.8 instances each and every day!
(b) Compare this with what was noted above about what was reported for AggROT >+300MW for the 44 x still operational coal units – where the annual incidence was below 25 for the year … which equates to an average of about 2.0 instances each month.
… we’re starting to see an increasing mismatch here, with the difference accelerating away (which is part of the reason for asking this question).
2) In terms of collective over-performance 300MW of larger (i.e. AggROT <-300MW):
(a) There were 293 dispatch intervals where the collective over-performance across all wind and solar across the year…. which equates to an average of about 0.8 instances each and every day!
(b) Compare this with what was noted above about what was reported for AggROT >+300MW for the 44 x still operational coal units – where the annual incidence was under 10 for the whole year … which equates to an average of under 1 instance each month.
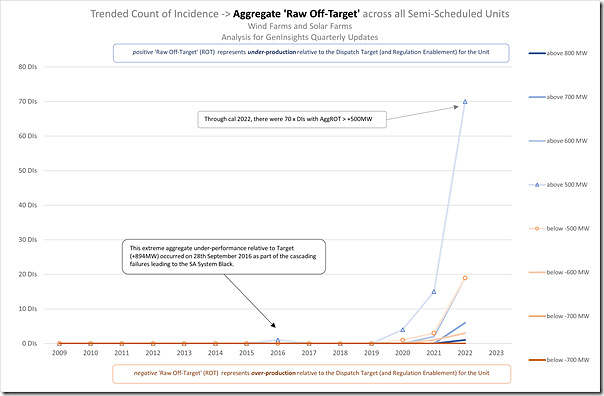
If we take a step up to larger deviations (i.e. above 500MW) then this is the trend:
Again comparing for calendar 2022:
1) In terms of collective under-performance 500MW of larger (i.e. AggROT >+500MW):
(a) There were 70 dispatch intervals where the collective under-performance across all wind and solar across the year…. which equates to an average of more than one instance each week through the year;
(b) Compare with an almost non-existent incidence of AggROT >+500MW for the 44 x still operational coal units.
2) In terms of collective over-performance 500MW of larger (i.e. AggROT <-500MW):
(a) There were 20 dispatch intervals where the collective under-performance across all wind and solar across the year…. which equates to more than one instance each month;
(b) Compare with an almost non-existent incidence of AggROT <-500MW for the 44 x still operational coal units.
(B2) Increasingly Large Extremes
With growing installed capacity of Wind and Large Solar across the NEM, unless something changes (part of the reason for asking that question), we look set to continue recording higher-and-higher incidence of large deviations, and larger and larger point extremes.
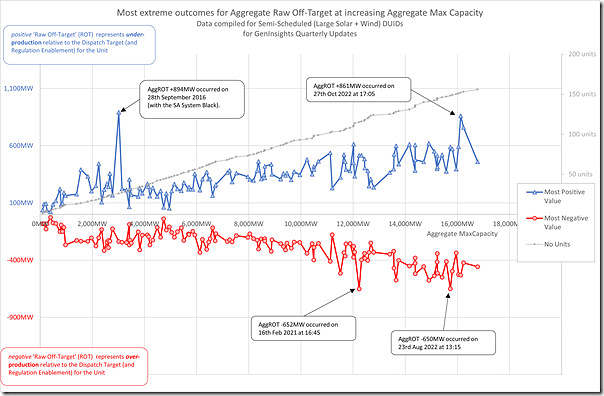
This is reflected in the following trend chart from the same report:
The way to read this chart is to understand that the x-axis (which shows installed capacity of Wind and Solar) is essentially a non-linear time axis … we’re moving from left to right through time as more and more capacity is installed.
For each additional slice in capacity (above 150 units now as shown on the y2 axis, and above 16,000MW of capacity) we see that the extremes are generally trending upwards on either side of the line.
(C) Two high points worth of further investigation
In the last trend above, some specific instances of extreme under-performance and over-performance are identified, as noted in the following table:
| Extreme Under-Performance (Positive AggROT) |
Extreme Over-Performance (Negative AggROT) |
|---|---|
|
Prior to calendar 2022, we see that the largest instance (by far) was the collective under-performance of +894MW that occurred on 28th September 2016 when several wind farms in South Australia tripped simultaneously (all due to protection settings) as a lead-in fault cascading to the SA System Black. On 6th August 2020 we posted this ‘Case Study of 16:20 on 28th September 2016 (aggregate Raw Off-Target +894MW for Semi-Scheduled units)’ about this incident. |
In terms of collective over-performance, the ‘largest ever’ incident (at least to date) occurred at 16:45 on 16th February 2021 at a level of –652MW. I’ve done a quick scan and can’t easily see that we’d previously prepared a Case Study about this event. |
|
Much more recently (at 17:05 on 27th October 2022) we see that there was an incident almost as large – being collective under-performance of +861MW. That it was almost as large as a lead-in event triggering the SA system black is significant , a sign of the significance of the progression that has made such extremes now almost ‘normal’ and ‘expected’ (though certainly not desired). However readers should keep in mind that this more recent event is (presumed to be*) different in two significant ways: 1) There are many more Wind and Large Solar Semi-Scheduled units now than there were in 2016, and presumably* this collective under-performance is spread across a broader area of units across the NEM (not just isolated to South Australia); and 2) Whilst the time step of the measurement is the same (i.e. what happens within a 5-minute dispatch interval), the collective failure of wind farms in SA on 28th September 2016 happened almost instantaneously, whereas it is presumed that* the ‘failure’ in the case of 27th October 2022 was much more gradual (though still within the dispatch interval). With respect to the * (presumptions), there’s a Case Study on this particular incident that will be published sequentially, with Part 1 of the Case Study now here … |
Demonstrating that the ‘largest ever’ record above is not long till it is superseded, on 23rd August 2022 at 13:15 we saw a collective over-performance almost as large (at –650MW across the NEM). A little bit later on we might be able to have a Case Study prepared about this one… |
That’s all for now … but we will continue to watch this metric (and ask this question)!


Leave a comment