Yesterday’s case studies all pertained to certain dispatch intervals during 2013 (on 4th July, 14th August, and 28th September).
1) Today I have skipped 2014 and 2015 (one instance each) to land on the early morning period of Tuesday 5th April 2016. This is the 6th dispatch interval with ‘extreme result’ flagged in the table of detailed results posted at the bottom of the article of 27th July 2020, which was posted partly in response to the AER Issues Paper relating to Semi-Scheduled units.
2) I’ll come back and look at the instances in 2014 and 2015 as time permits.
——————-
This case is much more complex than the first three Case Studies from 2013, and the main reason for this seems to be that there were negative prices in this dispatch interval, and through the 03:30 trading period. I won’t have time today to delve into all of the details, but this article should give you a flavour to the different considerations at various plant that combined to deliver a significant collective under-performance at this point in time.
In reading through this case study, keep in mind that the NEM-wide aggregate demand was only of the order of 17,000MW (being low point in the demand curve for an autumn night). Hence the collective under-production across a number of units, seemingly in response to negative prices, represented approximately 2% of NEM-wide demand at this time.
As I have noted before (like on 24th July), I am striving to understand how significantly this ‘problem’ will continue to grow, as the installed base of Semi-Scheduled capacity grows (and as the incidence of negative pricing continues to grow). Will Five Minute Settlement totally ‘solve’ this issue as some seem to believe?
(A) Summary results for Tuesday 5th April 2016 at 03:25
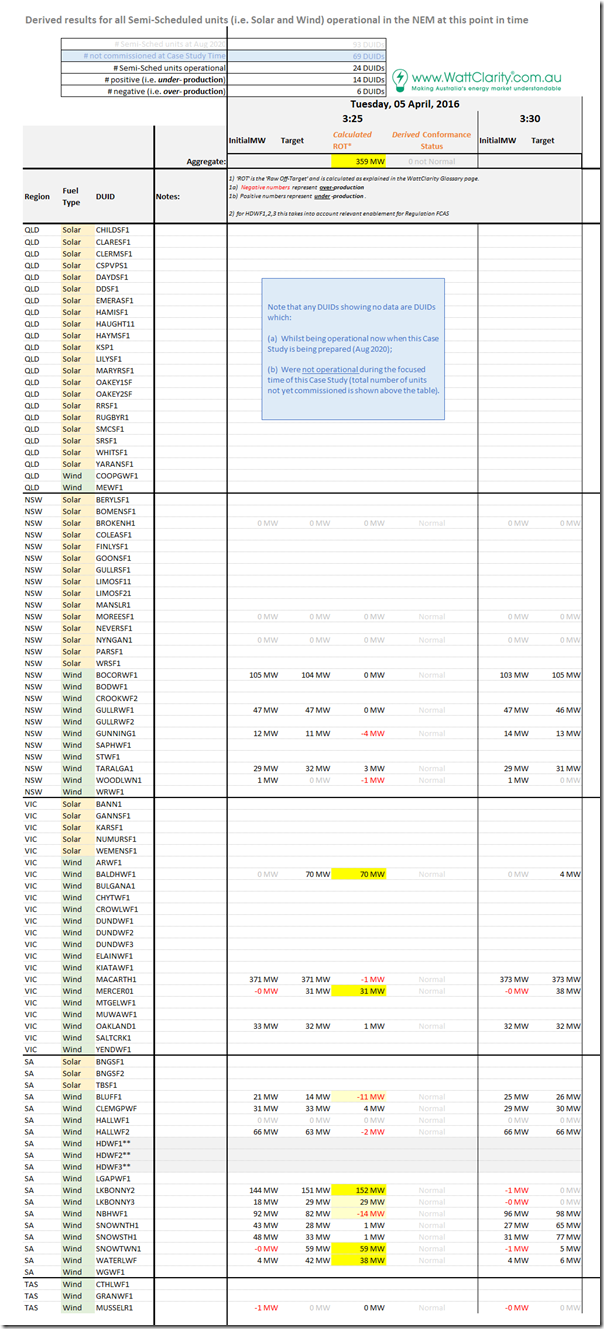
Again, we start with this summary table, highlighting the individual Raw Off-Target performance of all Semi-Scheduled units that were operational at the time:
Compared to the three instances during 2013:
1) We see an increase in the number of units operating – now 24 units, of which 3 are Solar Farms (not operating in the middle of the night, obviously);
2) In this particular instances, we see more than double the number of units under-performing (14) than over-performing (6);
3) Of these 24 units, we see:
3a) Significant under-performance flagged at 6 units (of the 14 in total) across both VIC and SA; and
3b) We also 2 unit over-performing in the same dispatch interval, though not to the same extent.
3c) Below we will look at all 8 of these units.
(B) Looking at particular DUIDs
Again we can show this specific dispatch interval clearly with ez2view, wound back a bit over 4 years ago through the powerful ‘Time Travel’ functionality. We’ll walk from top-to-bottom in the table above to look at the 8 x wind farms highlighted with significant deviations away from Target.
Please keep in mind that I’m trying to get through all of these Case Studies in a reasonable amount of time, and there are a fair number to do, so I don’t have time to explore each event as much as I would like. If you notice any errors, or misinterpretations in the following, please feel free to add a comment under the article to clarify/correct:
(B1) Bald Hills Wind Farm in VIC (+70MW = under-performing)
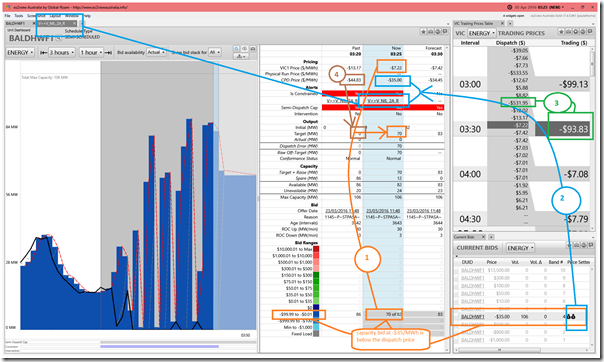
Here’s a snapshot for the Bald Hills Wind Farm, which is one of 2 VIC units flagged – along with 6 units in SA with significant deviations.
Because of the significance of the negative prices, I thought it best to use 3 widgets in the dashboard – not just the ‘Unit Dashboard’ widget to show a fuller picture. I’ve annotated this widget to highlight 4 observations that can be made below:
Observation #1) We see that the unit had offered all of its volume down at –$35/MWh. With the dispatch price in VIC resolving to –$7.22/MWh for this dispatch interval, this energy looks ‘cheap’ so NEMDE dispatches as much as it can take. Hence the dispatch target rises from 0MW the prior interval up to 70MW target for where to be at 03:25 (that’s a ramp up rate of 14MW per minute, which is well below the ROCUP rate of 30 MW/min offered in the bid … so you might wonder why not fully dispatched)
Observation #2) The reason for this is that the ‘V>>V_NIL_2A_R’ constraint equation is bound acting to ‘constrain down’ the output of the unit.
#2a) We see the effect of the constraint in the Connection Point Dispatch Price (i.e. the CPD Price),
#2b) And we also note that BALDHWF1 is flagged as one of the units involved in setting the price in Victoria (and also SA, it turns out).
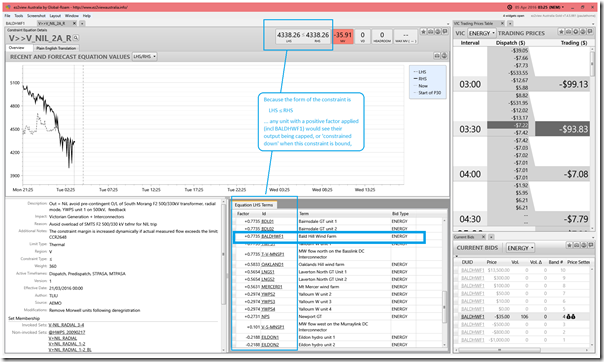
#2c) We can navigate over to that ‘Constraint Equation Details’ Widget by using the hyperlinking in the ez2view ‘browser to the NEM’ we’ve created, to confirm that this particular constraint would be acting to ‘constrain down’ (or at least cap) the output of a number of different units shown, including that of Bald Hills Wind Farm:
Observation #3) However we also note that pricing is much more complex for this dispatch interval because of the 5/30 Issue:
#3a) For the 03:25 dispatch interval, the –$7.22/MWh dispatch price is above the offered price for the energy at BALDHWF1 – so it would seem logical that the plant would generate to capture that value;
#3b) However we see the earlier –$531.95/MWh dispatch price for 03:10 means that the current ‘Estimated Trading Price for the Current Half Hour’ is down at –$93.83/MWh (which is well below what the unit could be inferred as implying is their ‘break even’ cost of –$35/MWh netting off LGC revenue);
#3c) So it might be (remembering this important caveat) that this unit does not actually want to generate in this dispatch interval, for what might be inferred to be a loss;
#3d) Noting that there may be alternative explanations/interpretations, this interpretation could be one explanation of why the unit does not dispatch anything, despite receiving a target of 70MW;
#3d) This interpretation maps with ‘Paradigm #2’ discussed here in relation to the AER Issues Paper;
#3e) I’d like to have more time to explore the specifics of what’s happened at each of the 8 units, including this one.
(i) However my time is constrained.
(ii) At the end of the day, my main interest is that this means an imbalance in the broader supply/demand balance of +70MW in the form of a Raw Off-Target value for the unit whatever the cause.
Observation #4) Interestingly, I’ve also flagged the prior dispatch interval, which shows that the unit received a Dispatch Target of 0MW because it’s CPD Price was (at –$44.83/MWh) below the price offered for its energy, so seen as too expensive in that dispatch interval.
#4a) In this dispatch interval it does not ‘have to’ (using ‘Paradigm #1’) generate, so avoids generating at a loss;
#4b) It’s also why it starts at 0MW in the next dispatch interval, and would need to ramp up to meet its target.
(B2) Mt Mercer Wind Farm in VIC (+31MW = under-performing)
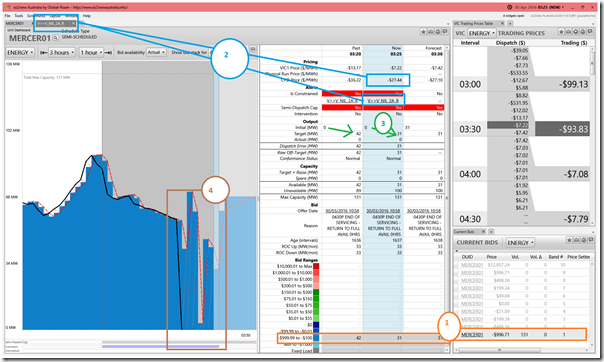
Moving on to Mt Mercer Wind Farm – which is also in VIC, and also under-performed significantly – we see a very similar situation:
Observation #1) In this case, the energy is bid down at –$996.71/MWh which is well below any of the dispatch prices in the trading period, so it’s logical that there should be a positive target received in each dispatch interval (including this one);
Observation #2) The same constraint is active, also seeking to ‘constrain down’ the output of the unit. However it’s CPD Price was miles above the price offered in the bid;
Observation #3) We can see that the target (i.e. 0MW to 31MW at 03:25) is quite slow ramping, given the bid ROCUP rate of 33MW/min;
Observation #4) We can see clearly that the unit dropped to 0MW output in the 02:50 dispatch interval, and has remained at that point (with no rebid to indicate technical issues);
Observation #5) This seems to be another participant operating with ‘Paradigm #2’ (discussed here in relation to the AER Issues Paper).
(B3) Hallett 5 (the Bluff) Wind Farm in SA (-11MW = over-performing)
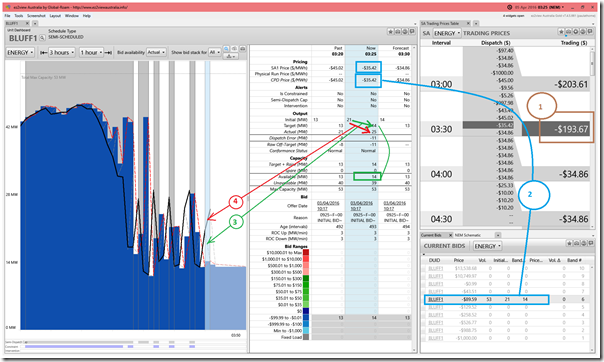
Moving into South Australia as we walk down the spreadsheet table above, we arrive at BLUFF1 wind farm:
I’ve noted on the image four observations:
Observation #1) Similar to the case in VIC, a low dispatch price at 03:10 (lower in SA than VIC) was driving the Estimated Trading Price for the 03:30 half hour down to –$193.67/MWh;
Observation #2) We see that this unit had offered it’s volume down at –$89.59/MWh, which is below the dispatch price in South Australia for 03:25 (and also the CPD Price given the lack of constraint action on this DUID and lack of Intervention more broadly);
Observation #3) However, despite their energy being cheaper, we see that the unit is dispatched down (from 21MW down to 14MW), which is because (for reasons unknown and unexplored) AWEFS thinks that the availability of the plant is only 14MW;
Observation #4) Despite what AWEFS thinks, however, the unit increases its output from 21MW to 25MW. This means an aggregate Raw Off-Target of –11MW (with the negative number representing an over-performance).
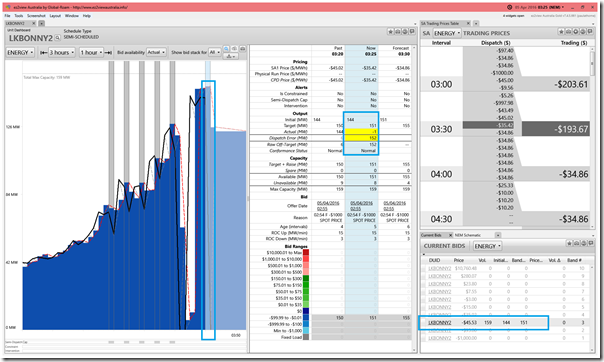
(B4) Lake Bonney 2 Wind Farm in SA (+152MW = under-performing)
Moving further south within South Australia to Lake Bonney 2 Wind Farm, we see the largest unit under-performance in this dispatch interval (+152MW):
Might be worth noting that some might see this as an example of ‘Paradigm #2’ in action in this dispatch interval – however I’m not so sure. I’ve not had time to check, but it seems to me that the Estimated Trading Price for the 03:30 period would have dropped well below their bid price when the 03:10 dispatch price was published at 03:05:20.
I wonder, if we hypothesise that the unit wanted to avoid the negatively prices trading period, why wait 15 minutes to switch off? This same question applies to some others above. Maybe there is some reason for the delay – or maybe there is some other explanation for why the unit tripped?
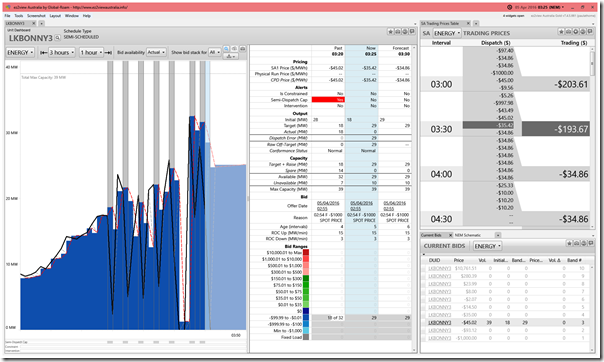
(B5) Lake Bonney 3 Wind Farm in SA (+29MW = under-performing)
Neighbouring Lake Bonney 3 also showed a significant level of under-performance in this dispatch interval:
In this case, the unit was dispatched up from 18MW to 29MW but went the other way, tripping to 0MW. Hence the net effect of a Raw Off-Target value of +29MW for the 03:25 dispatch interval.
Some readers might note that the 03:20 dispatch interval we’d seen the dispatch price in SA land where LKBONNY3 had offered all of its volume, hence the unit had been dispatched down in that interval. Maybe the see-saw change in output had triggered some form of plant problem, leading to the trip?
I’ve no time to explore further whether such a trip would be reflected in later rebidding.
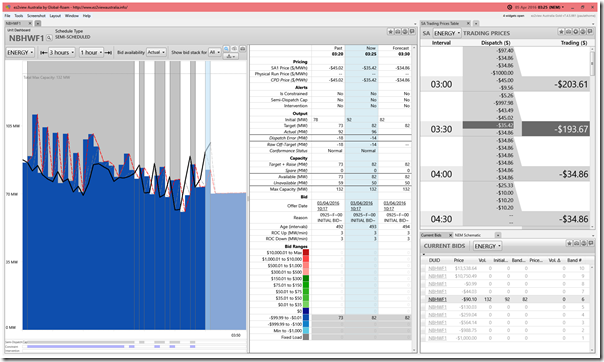
(B6) Hallett 4 (North Brown Hill) Wind Farm in SA (-14MW = over-performing)
Back up to the mid-north again and we see that NBHWF1 was the second of the two units to over-perform:
As was the case with neighbouring Hallett 5 (the Bluff) Wind Farm, AWEFS has an overly pessimistic sense of what the plant’s availability is – leading to the 14MW over-performance. I don’t have time to explore this common factor across the 2 nearby wind farms.
(B7) Snowtown 1 Wind Farm in SA (+59MW = under-performing)
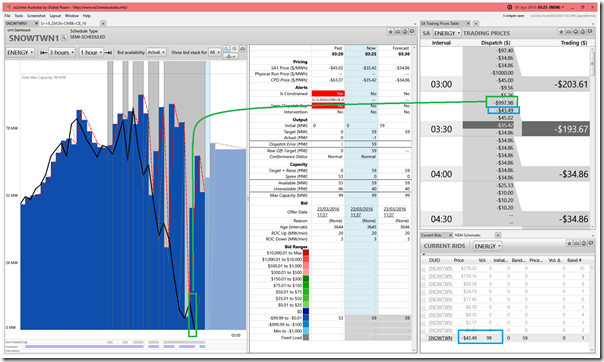
No time to analyse in detail here, but we see that Snowtown Wind Farm output was dispatched down to 0MW in the 03:10 dispatch interval as a result of how they had bid:
This was also the case in the 03:20 dispatch interval, when the ‘S>>X_DVCN+CNRB+CB_16’ constraint drove the unit’s CPD Price below the level of it’s bid (hence dispatch target of 0MW). The following dispatch interval, with the constraint not bound and the CPD price at –$35.42/MWh (i.e. above the –$45.02/MWh offered by the bid) the unit was given a target to rise to 59MW, but for unknown reasons was unable to pick itself off the floor.
(B8) Waterloo Wind Farm in SA (+38MW = under-performing)
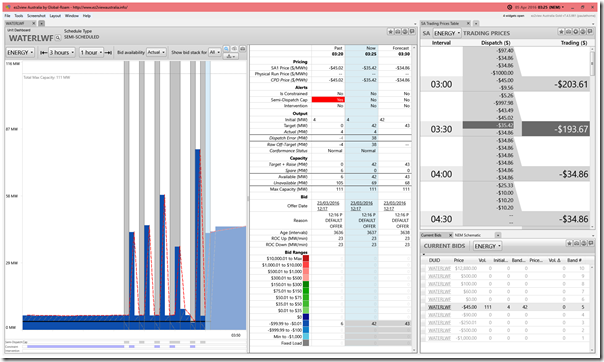
Finally we add in the same dashboard for Waterloo Wind Farm:
This is a strange one in that we see their output stuck at 4MW for the past 3 hours, independent of whatever the dispatch target was saying that it could do. Hence a dispatch target of 42MW at 03:25 meant a +38MW Raw Off-Target.
—————-
There is obviously more exploration that could be done for this particular dispatch interval, but I don’t have time to do that today…


Leave a comment