
As a PS to part 1, part 2 and part 3 on Sunday, I thought it would be useful to provide this tabulated documentation of (my calculation of) the ‘record minimum demand’ points for each region of the NEM – seems like something we’ll need to be referring back to increasingly frequently!
(A) AEMO’s forecast
On Saturday I’d noted AEMO’s forecast for low minimum demand points being reached on Sunday – and early in the day Sunday Mike Davidson shared more information about this forecast via LinkedIn:
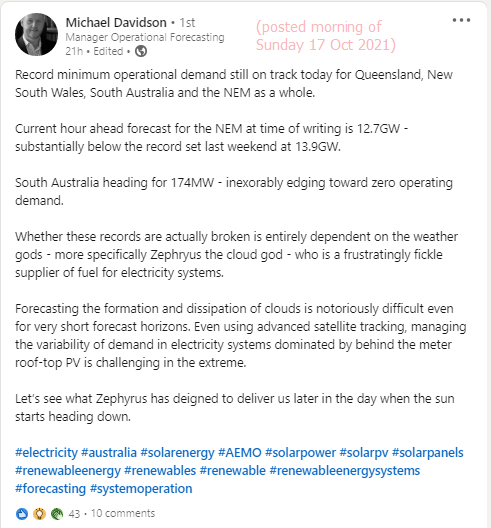
As it turned out, we did not quite get ‘there’ – and Mike’s later comment here on LinkedIn from Sunday night explains a bit more.
(B) Tabulated record of Minimum Demand Points
There are a number of measures used for electricity demand in the NEM, with two the most common. Here’s a record of the low points in each region (and NEM-wide) at the conclusion of Sunday 17th October 2021:
| Area | ‘Ordinary Time’ Record
prior to Sunday 17th October |
‘Extraordinary Time’
Extreme Low Point |
After the monster day of …
Sunday 17th October 2021 |
| NEM-wide |
On Sunday 3rd October 2021 (as noted in this second article on the day) there was a new record low point set for NEM-wide minimum demand. As noted in that article: 1) A low point for Scheduled Demand (13,273MW target for 10:55 dispatch interval) … which is down on the 13,509MW prior low point from 13:05 on 22nd August 2021. 2) A low point for Operational Demand (13,972MW measured in half-hour ending 11:00).
|
As a result of what happened on Sunday 17th October 2021 (as noted in today’s ‘Part 3’ article), we see that there was a new record set for ‘minimum demand’ on a NEM-wide basis: 1) A low point for Scheduled Demand (12,536MW target for 12:55 dispatch interval) … which eclipses the prior record. 2) A low point for Operational Demand (12,936MW measured in half-hour ending 13:00) … which eclipses the prior record.
|
|
| QLD Region |
On Sunday 3rd October 2021 (as noted in this first article on the day) there was a new . As note in that article: 1) the low-point for the ‘Total Demand’ figure published by AEMO was 3,672MW as target for the 11:10 dispatch/trading interval. 2) A low point for Operational Demand (3,784MW measured in half-hour ending 11:30). |
The Queensland demand dropped extra-ordinarily low on 25th May 2021 in the aftermath of the Callide C4 Catastrophe. The AEMO Incident Report on the event, published 8th October 2021, reveals that load shedding occurred 1) not just due to under-frequency load shedding (UFLS); 2) but also due to low voltage and other factors. As a result of this, the ‘Scheduled Demand’ level fell to 2,870MW in the early afternoon. |
The levels for QLD demand seen on Sunday 17th October were close, but did not break the standing record: 1) A low point for Scheduled Demand (3,751MW target for 11:10 dispatch interval). 2) A low point for Operational Demand (3,869MW measured in half-hour ending 11:00).
|
| NSW Region |
On Monday 4th October 2021 (a public holiday, and the day after the two records noted above) NSW set a new low-point record for minimum demand. As noted in that article: 1) the Scheduled Demand has dropped under the previous ‘low point in a long time’ with target ‘Total Demand’ reaching a low of 4,617MW for the 11:15 (NEM Time) dispatch interval. 2) When looking at the (AEMO’s more favoured) ‘Operational Demand’ measure, the new low point was 4,861MW in the half-hour ending 12:00 on the Monday. |
As a result of what happened on Sunday 17th October 2021 (as noted in today’s ‘Part 2’ article), we see that there was a new record set for ‘minimum demand’ for the NSW region: 1) A low point for Scheduled Demand (4,286MW target for 12:20 dispatch interval) … which eclipses the prior record. 2) A low point for Operational Demand (4,425MW measured in half-hour ending 13:00) … which eclipses the prior record.
|
|
| VIC Region |
It was an auspicious Christmas Day 2020 (as noted in this article) when Victoria set a low-point for minimum demand. As noted in that article: 1) The Scheduled Demand measured by target ‘Total Demand’ reached a low of 2,259MW for the 12:50 (NEM Time) dispatch interval. 2) When looking at the (AEMO’s more favoured) ‘Operational Demand’ measure, the new low point was 2,529MW in the half-hour ending 13:00 (NEM Time) on the Xmas Friday. |
The levels for VIC demand seen on Sunday 17th October were well away from the record, due to cloud cover for the day. Note the cloud cover mentioned in Mike’s comment here and by Sarah Lawley here.
|
|
| SA Region |
On 26th September 2021 (as noted in this article) we recorded a low point for Scheduled Demand in SA down at 184MW for the 13:20 dispatch interval (NEM Time). — In conjunction with this, the (AEMO’s more favoured) ‘Operational Demand’ measure was down at 236MW in for the half-hour ending 14:00 (NEM Time). |
The South Australian demand dropped extra-ordinarily low on 26th September 2016 in the process of the SA System Black. Immediately at the point of the system black event, the ‘Scheduled Demand’ level fell to only 5MW in the early evening. |
The levels for SA demand seen on Sunday 17th October were close, but did not break the standing record: 1) A low point for Scheduled Demand (198MW target for 12:30 dispatch interval). 2) A low point for Operational Demand (238MW measured in half-hour ending 13:30 … very close!).
|
| TAS Region |
I can’t recall publishing a single article about ‘minimum demand’ in Tasmania … as it’s a ‘mainland region affliction’ that it seems TAS has been somewhat immune against – due in part to the relatively low penetration of rooftop PV systems in the Apple Isle. However in the interests of completeness, I’ve did try to have a quick look at numbers in NEMreview v7 and see that there are a number of different dips to what appears to be ‘unnatural low points’: 1) Including the two lowest points noted in the next column… 2) … But not limited to those. I don’t have time today to try to comprehensively exclude all ‘unnatural low points’, so will just leave these records blank for now — BLANK, and to fill in later.
|
I did find this article published back on Monday 23rd February 2015 about a significant trip of Tasmanian demand. As a result of this trip (and after checking in NEMreview v7) I can see that: 1) The Scheduled Demand measured by target ‘Total Demand’ reached a low of 413MW for the 01:05 (NEM Time) dispatch interval on 23rd February 2015. 2) Noting that records for (AEMO’s more favoured) ‘Operational Demand’ measure don’t go back before 11th December 2014, the lowest points I can see were both 552MW … and occurred: (a) In the half hour ending 01:30 (NEM Time) on 23rd February 2015; but also (b) In the half hour ending 16:00 (NEM Time) on 21st December 2014 (which appears to be another occasion of ‘unnatural low point’ … at which point ‘Scheduled Demand’ was 543MW). |
The levels for demand seen in Tasmania on Sunday 17th October 2021 are well above ‘minimum ever’ measures. |
Clearly this is a pattern – at least on the mainland!
(C) Reminder about how demand is measured
It’s proven to be a very well read article since we put it together in April 2018 – but timely again to remind readers of these gory details of how demand is actually measured, and why there are different readings used for different purposes (e.g. ‘Scheduled Demand’ and ‘Operational Demand’).
As I have noted recently as well, the details are actually more complex than this (complicated further still by the addition of Negawatts created out of thin air with the creation of the Wholesale Demand Response Mechanism (a.k.a. the Centralised Negawatt Dispatch Mechanism) … so at some point we’ll post an updated and extended version of this explanation.
(D) Digging deeper (pun intended)
No doubt, as the bottom continues to fall out of the wholesale electricity market, we’ll continue to see these minimum demand points ratchet lower in future.
Major challenges ahead … and ones we’ve been exploring in several ways for GenInsights21 !
Exciting times!