Yesterday (Sunday 3rd October) it was Queensland’s turn … and also for whole-of-NEM demand.
Today, on a labour Day public holiday in NSW, we see the SMS pings continue, announcing that Scheduled Demand has dropped under the previous ‘low point in a long time’ with target ‘Total Demand’ reaching a low of 4,617MW for the 11:15 (NEM Time) dispatch interval …
—
AEMO had noted their expectation that these kinds of low points might occur over this long weekend.
(A) Long-range trend over NEM history
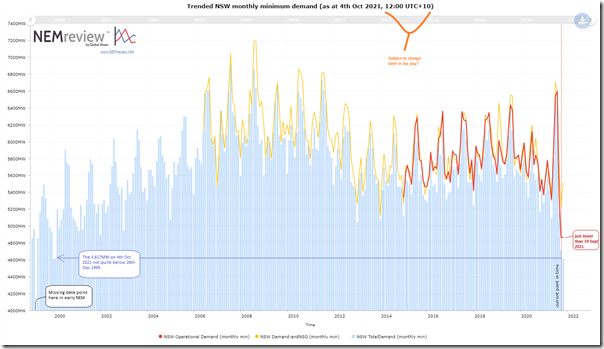
The NEM started back on 13th December 1998 … so omitting those couple weeks in December 1998 and starting a trend at 1st January 1999 we see this trend of the three main measures of ‘demand’ that the AEMO now uses up until 12:00 (NEM Time) on Monday 4th October 2021:
For those interested in the details, read through to some of the gory details of how these different demand measures come about.
(B) Those different measures of demand
Two quick notes, with respect to those different measures of demand…
(B1) Scheduled Demand not quite the ‘lowest in NEM history’
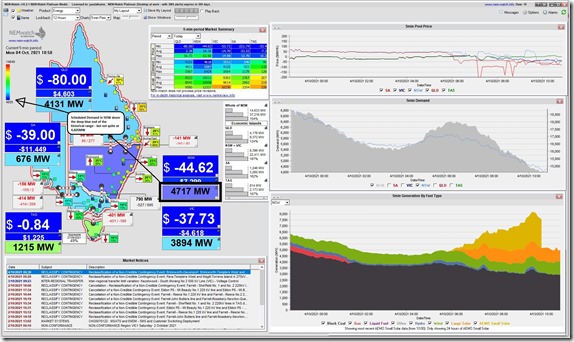
Here’s a snapshot of NEMwatch v10.2 at 10:50 – so just before the low point (of 4,617MW at 11:15) but instead showing 4,717MW twenty minutes earlier:
Only one of those measures in the chart above was published by AEMO (or NEMMCO, more precisely) back at the start of the NEM – and that was the ‘Total Demand’ measure (which is a proxy for what the AEMO now talks about as ‘Scheduled Demand’ …. but, ironically, is certainly not what a layperson might think of as ‘total demand’!).
For consistency purposes:
1) We’re currently continuing to use that measure in NEMwatch; and also
2) It’s useful to see a longer range of data in order to put what is currently happening in more context.
From the chart above we see the low point today is not quite down at the ‘record low’ level of 4,605MW early in the morning on 26th December 1999.
(B2) Operational Demand lowest on record (lower than 19th September 2021)
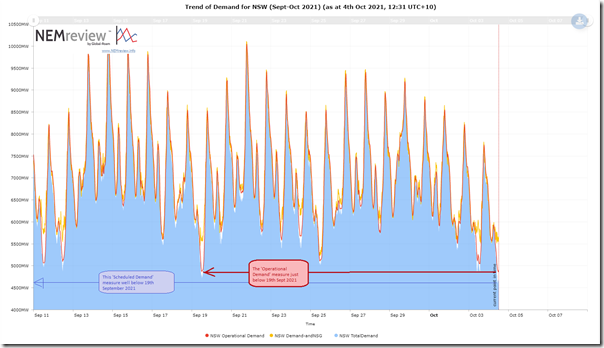
However it is worth noting that (with the AEMO’s newer measure of ‘Operational Demand’) it shows that the demand seen today is a little lower than the prior record on Sunday 19th September 2021, which Dan had documented in this article a couple weeks ago.
1) As it currently stands, the new low point appears to be 4,861MW in the half-hour ending 12:00
2) I presume AEMO will provide some record of this new low point later. They were pretty quick in confirming yesterday’s low points.
—
To provide a bit more context, here is a ‘zoomed in’ trend of the three measures shown here over the span of the past couple weeks … so encompassing the record on 11th Sept 2021 and then 19th Sept 2021.
No doubt the slide will continue, moving forward, given the seemingly insatiable appetite for people to install rooftop solar PV systems.


Leave a comment