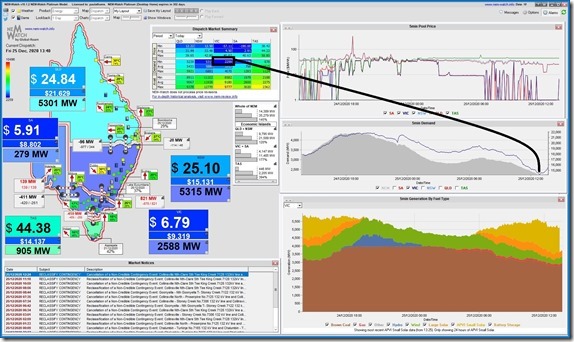
No time to post anything other than this snapshot from NEMwatch v10 (our entry-level market dashboard) highlighting that the VIC demand (measured by ‘TOTAL DEMAND’ in this case) dropped down as low as 2,259MW in the 12:50 dispatch interval on Christmas Day:
Separately, AEMO data shows the Operational Demand dropping as low as 2,529MW in the half-hour ending 13:00 (NEM time). With reference to this article from 29th August 2020 about a prior ‘lowest ever’ point for VIC demand we can see how the Grid Demand continues to fall further south.
* For those who forget the many different ways in which electricity demand is measured, here’s the detailed explanation.
The NEMwatch Fuel Mix chart highlights how rooftop PV was performing strongly, and (by virtue of this, and the low level of ‘Underlying Demand’) causing the VIC brown coal units to reduce load in the middle of the day.


I scanned the explainer and could not see the difference between Total Demand and Operational Demand. I had assumed Operational demand was the demand from the grid seen in Victoria. This includes net imports but not behind the meter generation.
If Victoria was exporting as it probably was, then Operational demand would be grid generation less net exports, battery charging and pumps while total demand would be Operational Demand + rooftop solar. So the question is how can Total demand be less than Operational demand