Our general level of busyness across the two contributing organisations (both us here at Global-Roam Pty Ltd and our collaborative partners at Greenview Strategic Consulting) means that completion of GenInsights Quarterly Update for Q1 2023 is running a bit behind our intended schedule.
We’re looking forward to having this released for subscribers as soon as possible.
In recent weeks I have had several conversations with different people about one particular aspect of the energy transition – with the conversation being particularly of interest given:
1) The closure of the three remaining units at Liddell through Q2 2023 (i.e. just after the 31st March cut-off date for most of the data in the Update for Q1 2023); and also
2) Looking forward to the ‘possibly as early as 2025’ mooted closure date for the larger Eraring Power Station, also in NSW.
In this coming week I’ll be attending the EUAA Annual Conference (Tue 16th and Wed 17th May) in Melbourne, and I’m sure it’s likely to be a topic of discussion there.
For all of these reasons (and more) I thought it would be worth posting two excerpts from the upcoming Update for Q1 2023 in order to help provide context to the conversation. Both come from Appendix 4 for Q1 2023:
(A) Requirement for peak ‘Aggregate Scheduled Target’
We started tracking ‘Aggregate Scheduled Target’ (AggSchedTarget) a number of years ago now, and in each quarter update some stats for what we’re seeing in the evolution of this metric.
1) As noted here in the WattClarity Glossary, this metric is the sum (for each dispatch interval) of the Target determined by NEMDE for all fully Scheduled units, regardless of technology type.
(a) Hence it includes the older thermal technology (coal, gas and liquid-fired), hydro and also batteries and negawatts.
(b) The one criteria is that the units must be fully dispatchable … so this does not take account:
i. Targets for Semi-Scheduled units (which don’t have to follow targets, and the target is more like a cap (and only when when SDC is true)); and
ii. Non-Scheduled units (which don’t even get given targets).
(c) Being fully dispatchable is just one component of the ‘keeping the lights on services’ we first wrote about in the GRC2018.
2) At an aggregate level a trend of this metric has been discussed earlier elsewhere.
(a) Such as in the presentation we gave in April 2022 to an audience organised by Smart Energy Council (see from ~26 minutes), drawing from Appendix 15 within GenInsights21.
(b) Also in the Smart Energy magazine for June 2022 (see p49/72).
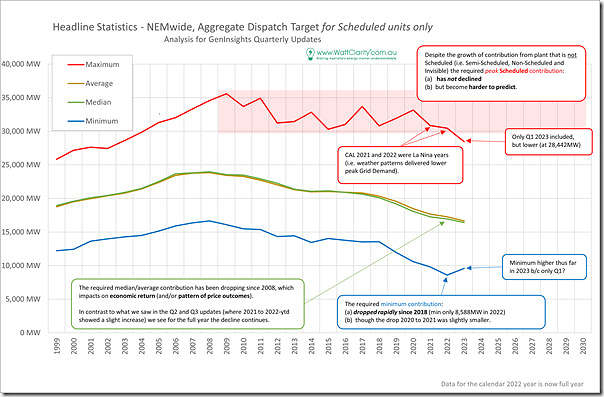
Fresh from the Update for Q1 2023, here’s the trend of the latest statistics:
As time has progressed since we first started tracking this data, the trend appears to continue as follows:
Trend 1 = the blue line at the bottom is the annual minimum level of AggShedTarget … and this has been dropping rapidly since 2018.
(a) readers should note that this is not quite the same as declining ‘minimum demand’, but shares a similar cause.
(b) this is low, and rapidly getting lower…. which points to challenges for other ‘keeping the lights on services’.
Trend 2 = in the middle we see that the average and median levels have been falling since around 2008
(a) which speaks to the steadily lower volume of energy being required of the Scheduled Plant that needs to remain in the system.
(b) … and hence the increased difficulty of making a commercial return for these plant especially if ‘high capex and low opex’ (like coal units and CCGT).
Trend 3 = at the top of the chart, however, is the red line, which is the annual maximum level of AggSchedTarget, which:
(a) remains stubbornly high; but
(b) is becoming increasingly difficult to predict due to the increased weather dependency of the grid at various levels.
PS1 on Monday 15th May 2023: Worth highlighting Allan’s comment on LinkedIn here with respect to one of the labels added to the chart above. For convenience we’ve copied in the text of Allan’s comment:
“Good article and some great charts but I can’t see any justification for the statement that “the required peak Scheduled contribution … has not declined”. Surely if you ran a regression on the data since the late naughties it would show a statistically significant downtrend?”
That identifies one additional piece of analysis that can be included in the report.
The key take-aways here are that:
Take-away #1) (in broad terms) the range of dispatch date to date* highlights that it almost does not matter how much wind and solar is added to the grid – there will continue to be a requirement for a large amount of installed dispatchable capacity (not too far under peak Operational Demand ) to be able to supply on occasions ‘when the wind does not blow and sun does not shine’.
* note that one thing that might potentially change this to some extent might be when we start to see results for increasing diversity of wind farms across Queensland … however that’s a strong ‘might’, as other analysis we’ve performed (such as Appendix 27 within GenInsights21) suggests that this is unlikely.
Take-away #2) The economics of (and operational regimes for) this plant are increasingly challenging, especially for legacy assets.
B) Waterfall diagram of ‘Aggregate Scheduled Capacity’
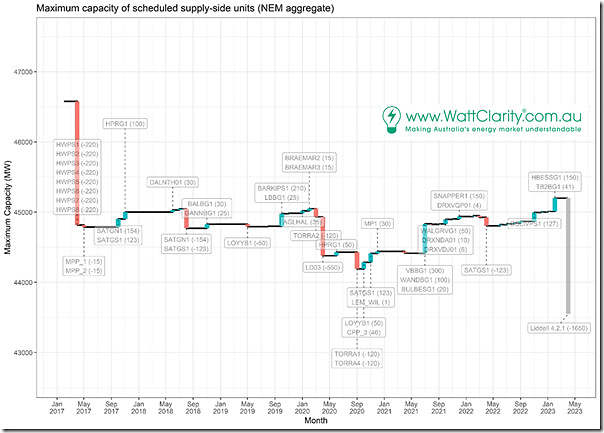
With the retirement of Liddell very topical as we were working through the Update for Q1 2023, and (after reflecting more on the implications of the above) we wondered how we stand in the NEM now, with respect to aggregate installed capacity for fully dispatchable plant.
Remembering these complexities of even choosing the most appropriate measure of installed capacity, and how the answer might be different for different question and technologies, we chose to focus on ‘Maximum Capacity’ for all of the fully scheduled units – both old and new.
Starting at January 2017 (i.e. prior to the closure of Hazelwood) we put together this ‘waterfall chart’ and will endeavour to keep it updated in every GenInsights Quarterly Update from this point forwards:
A couple quick points:
Take-away #3) Even prior to the closure of the last remaining 3 units at Liddell, in the 6 years since the retirement of Hazelwood, we have not replaced that magnitude of installed capacity with other dispatchable plant of any type.
(a) Adding on the Liddell closure takes us further into ‘deficit’ when measured against January 2017 levels.
(b) In aggregate at the end of the chart period (included in the Update for Q1 2023) the deficit is of the order of 3,000MW.
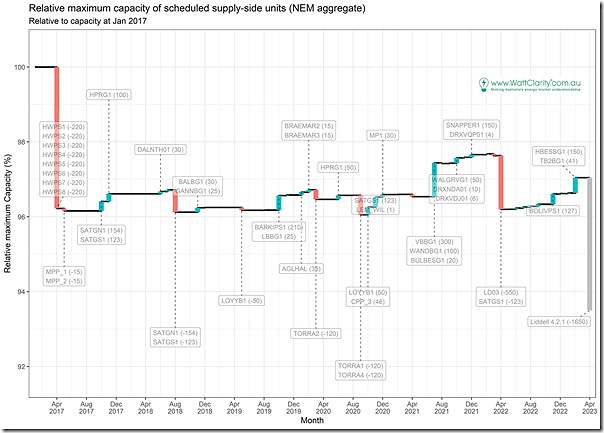
(c) Here’s the same chart in percentage terms, based on 100% at the start of 2017 prior to the closure of Hazelwood:
(d) From this chart we see the deficit is in excess of 6% of the entire installed capacity base of fully dispatchable assets installed at the start of 2017.
Take-away #4) Way back when we published the GRC2018 we wrote ‘the level of risk in the NEM is escalating’ (in Theme 2 within Part 2 of the 180-page analytical component) in the years since that time the waterfall charts above show that that level of risk (at least in terms of fully dispatchable capacity) has not been successfully addressed, and looks like it has further increased.


Thanks to the author for demonstrating that not only is the grid being structurally weakened by Heywood and subsequent closures and additions, but that this has always been the expected outcome.
This knowledge is essential if we are to have informed discussions about our energy future. Thanks for wording it in non-technical language with minimum jargon.
My take-away: Dunkelflaute is getting progressively worse and our defences against it are progressively weakening.
Lunch time Sunday in Victoria 24 MW wind and at 8.40 am on Monday 2,028 MW of wind ie a swing of 2,000 MW in wind output in less than 24 hours. This is not the way to run an industrialised economy or maintain reasonable living standards. And did anyone notice Battery Of the Nation in Tasmania in AEMO’s database has now been reduced to 1,500 MW which just happens to match Marinus Link (Stage 1, 2a and 3a was removed). With all the Snowy 2.0 cost overruns and delays where is all the long duration storage coming from?
I suggest that this issue was compounded or perhaps even primarily caused by poor investment confidence over the past 10 years. Now with the confidence turned upwards with new targets and incentives, it takes 7+ years to developed PHES projects while it takes 2+ years for solar and wind projects. We did need Snowy II to come on by 2026 but we didn’t need all that capacity at this point. Seems like we will need many more higher capacity battery storage projects between now until 2029?
Dunkelflautes are not getting worse, they just become a serious matter when conventional power capacity runs down to the point where wind power matters, as in Britain and Germany.
Hardly a surprise surely. The real elephant in the room is how (who?) is this going to be paid for. All of the modelling I have seen says you cannot sensibly build enough storage to get through the quite common, seasonal, wind and solar droughts that occur in the NEM (and indeed here in the west also). To attempt to overbuild wind and solar to compensate simply sees these become dispatched generators and hence they no longer have the privilege of free spilling to market. This will make network curtailments look like a picnic. They can’t (won’t) take market risk on this (project becomes unbankable) so who does? Simply their LRMC becomes much higher based on what a proponent reasonably thinks they can get to market. Ditto storage. Unless storage gets some sort of capacity payment (that has to be funded) then their whole business case will assume frequent extreme energy market swings to get an arbitrage. High risk, so who invests? But I thought all this renewable stuff was going to be cheaper? The higher the renewables penetration the less dispatchable generation survives and with the current mindset (that the only answer is more renewables) the overbuild will become worse, capacity factors decline and the system levelised costs go stupid. I suppose it all stops when you get to VOLL. Reminds me of a wise engineering lecturer that once taught me “in real life there is no such thing as the infinite busbar” – we can’t just keep doing this and somehow assume it will all hang together! Trouble is it is up to proponents to decide if they have a commercially viable project and I challenge the rigor going into some of the analysis sitting behind these. Wasted money is wasted money and it doesn’t really matter if it is public or private – it is opportunity lost.
Paul, Thank you for the great waterfall plot.
How far into the future could it be reliably extrapolated?
Kuri Kuri, so 375MW in 12 months time and another 375MW in 18 months, still 2500MW short.
Rafe: Dunkelflautes, well at least wind speed, will get worse with Climate Change! Ref: https://e360.yale.edu/features/global-stilling-is-climate-change-slowing-the-worlds-wind
There are a few concerns here about investor risk and some suggestions that the business case for storage is somehow different when it is not.
In the NEM, the business case for generation (including storage) of all types ultimately relies on favourable spot prices. What favourable spot prices look like is different for generators fuelled exogenously (eg coal, gas) than for those fuelled endogenously (ie battery/PHES or similar). To invest, a business case for the former wants spot prices to be high on average if they run all the time (coal) or many short periods of high price spikes for peaking units. This is well understood.
What appears to concern people is that the business case for the latter relies on spot prices to be highly variable – this might seem new (even though PHES has been around for decades?) but the indicator of profitability (future spot prices) is the same. In all cases, generation (and storage) investment business cases rely on forecasts/expectations of future spot prices as they determine which technology is likely to be most profitable.
In relation to the comment above “* note that one thing that might potentially change this to some extent might be when we start to see results for increasing diversity of wind farms across Queensland … however that’s a strong ‘might’, as other analysis we’ve performed (such as Appendix 27 within GenInsights21) suggests that this is unlikely.”
On April Fools day this year there was zero wind in Queensland for 3 hours and on 2nd April zero wind for 5 hours. Queensland wind farms are located from Mt Emerald west of Cairns to Coopers Gap west of Toowoomba. Therefore from the north to the south of Queensland there was no wind. Chemical batteries generally last for 2 to 4 hours and in the situation of no wind across a state could be discharged quicker. Then there is the instance of 204 MW wind output for the 5 states in the NEM which means even diversity of wind farm location across the NEM does not solve problem of not enough generation to meet demand. PS 1st and 2nd April 2023 was a weekend but in the future short and long wind droughts will occur during the working week and that severely impacts our economy, jobs and food security.