
“What in your opinion were the major impacts of the French Revolution?” – questioner
“It is too early to say.” – Zhou Enlai, Premier of the People’s Republic of China 1954-1976
This famous – but possibly misreported – exchange occurred during Richard Nixon’s groundbreaking visit to China in 1968.
Were Zhou Enlai to be reincarnated as a NEM observer in 2023, he would almost certainly say the same thing about the closure of Liddell Power Station. In this short post I’ll be slightly less circumspect than Zhou, but I will stick mostly to facts rather than offering opinions.
What I’ll focus on are changes in spot prices and supply levels by energy source immediately before and after Liddell’s shutdown, and in comparison with a corresponding period in 2022. I’ve used three timeframes to compare outcomes:
- The three-week period culminating in Liddell’s last week of operation: 10 April to 30 April 2023 (“preclose”)
- The two subsequent weeks: 1 May to 14 May 2023 (“postclose”)
- The whole corresponding five-week period a year ago: 11 April to 15 May 2022 (“pcp22”)
These periods are much too limited to draw firm conclusions of course, but we have only two weeks’ data for the post-Liddell era, and using longer pre-closure periods might risk unrelated seasonal factors influencing the results (in particular changing levels of demand and sunshine hours).
The sixty-four dollar question
That question would be about price impacts of course, so here they are for each NEM region:
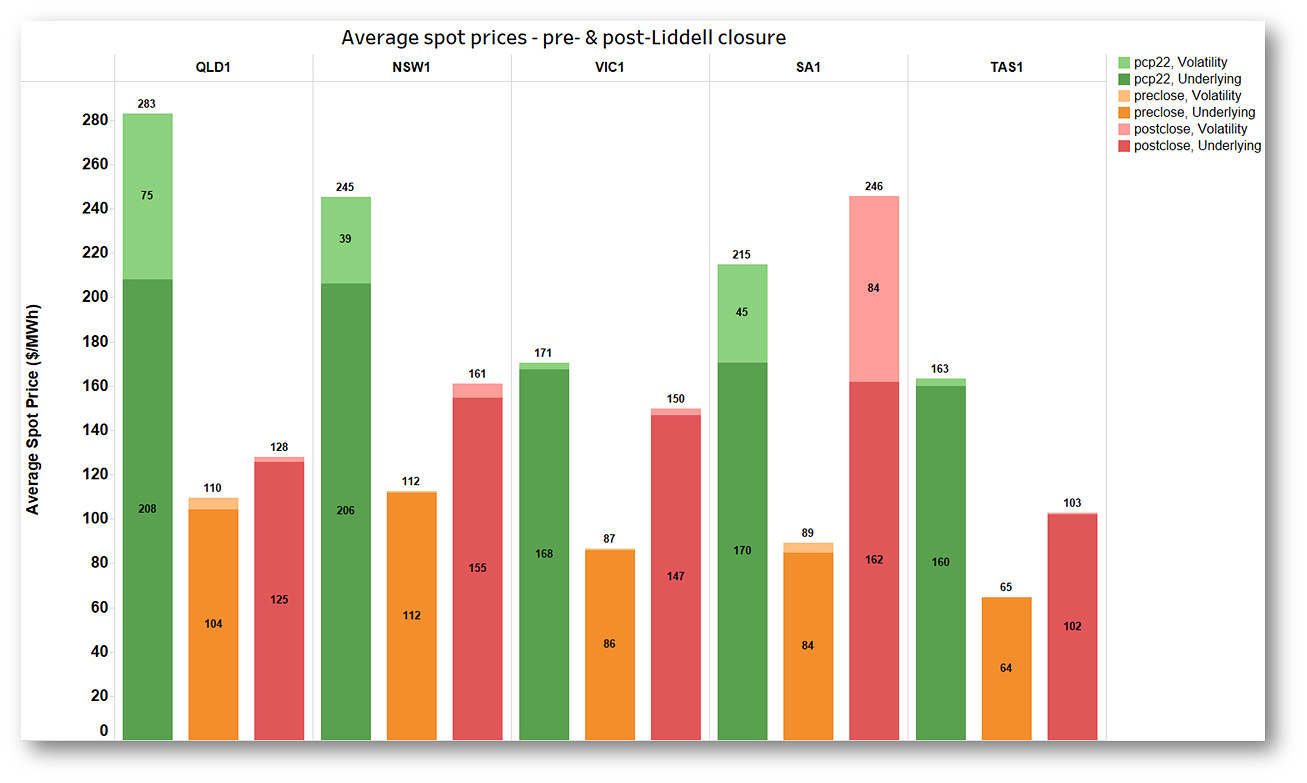 I’ve split average spot price into “underlying” and “volatility” components, where the latter is the contribution to the average from the excess part of any spot price beyond $300/MWh, and the underlying component is the balance (ie the average of spot prices capped at $300/MWh).
Spot prices rose significantly in all regions in the wake of Liddell’s closure but a little unexpectedly the largest increases in both absolute and percentage terms were in South Australia and Victoria, rather than Liddell’s home state of New South Wales, or in Queensland. The volatility breakdown clearly shows that South Australian prices post-closure have been affected by price spikes in that region (note these spikes also impact the underlying average). This is one of those confounding factors which almost certainly have nothing to do with Liddell closure. Outages and flow restrictions on the Heywood interconnector between Victoria and South Australia were the likely culprit here.
Another factor dragging southern mainland prices closer to averages in the northern regions may be the easing of constraints on the Victoria – New South Wales (VNI) interconnector following adjustments by AEMO and with seasonally falling levels of utility solar output in south-western New South Wales and north-western Victoria.
Relative to the corresponding weeks in 2022, prices in 2023 both before and after Liddell closure were significantly lower for the northern states in 2023. Hopefully this means we are not in for a repeat of the extreme price outcomes caused by coal-fired generation outages and spiralling gas prices in Q2 2022.
While Liddell’s closure certainly coincides with a significant change in spot prices before and after closure, before leaping to too many conclusions, it’s worth considering a second cut of the price chart above, where I’ve split the corresponding 2022 five-week period into three-week (“pcp22_1”) and two-week (“pcp22_2”) blocks matching the 2023 pre- and post-closure periods:
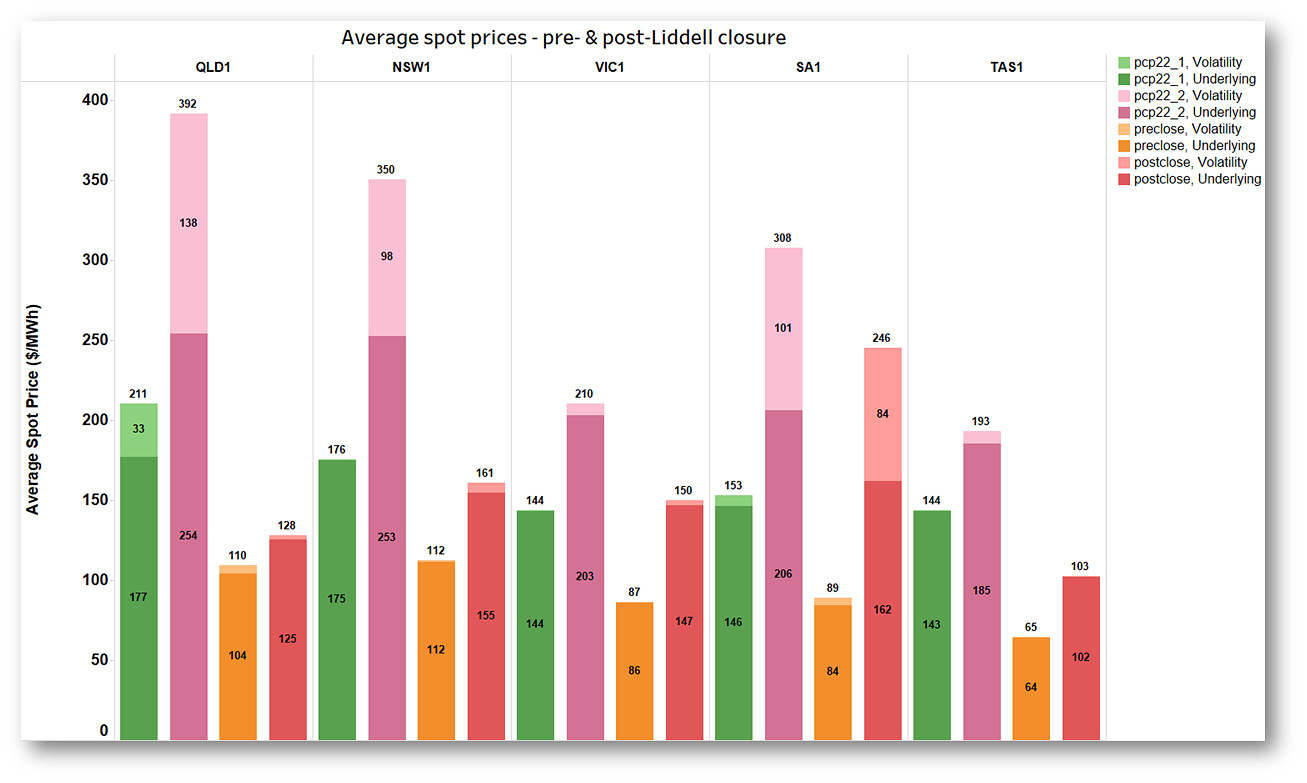 In 2022 the price increases between the end of April and early May periods were far larger in the northern NEM regions than over the corresponding weeks in 2023. This simply goes to show that trying to attribute price changes over such short periods to any individual factor is a fool’s errand.
Swings and roundabouts
Turning to supply levels and shares from different generation sources, here’s the regional breakdown of average generation output by energy source and type for the three periods:
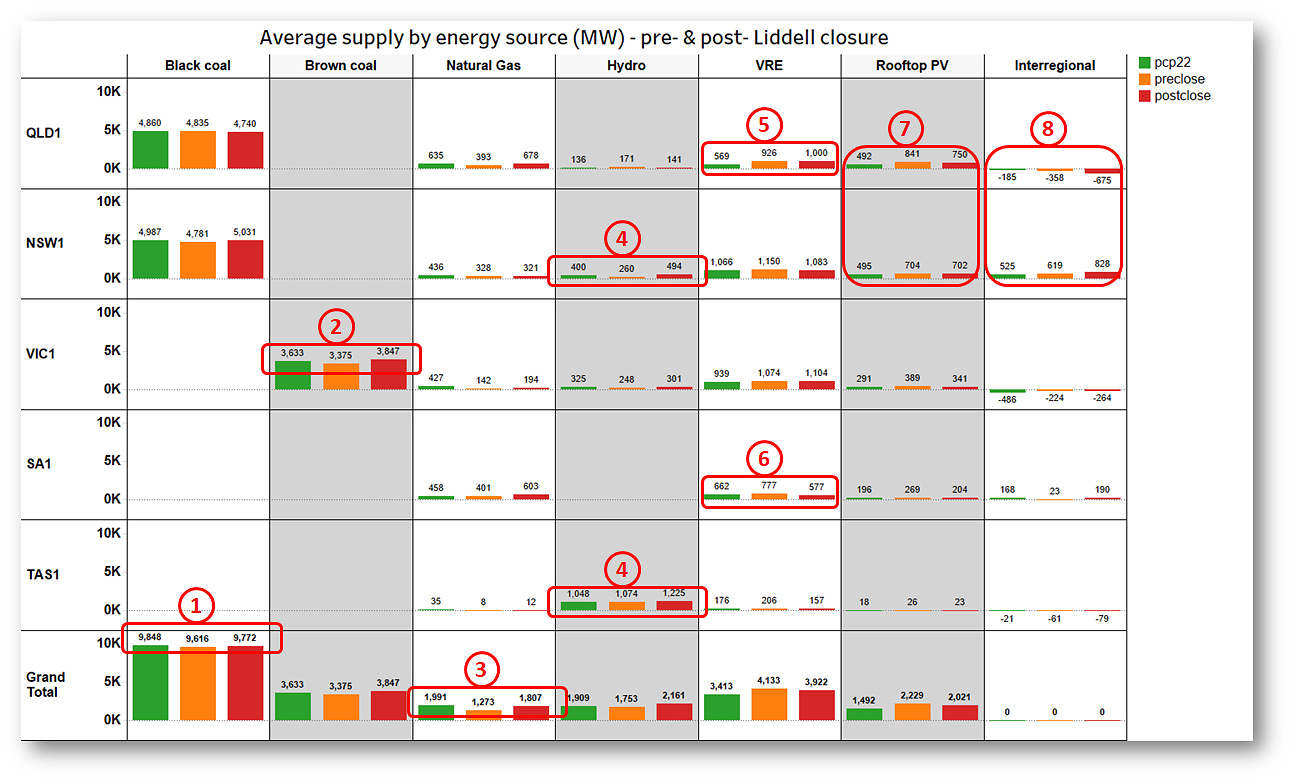 There’s probably too much information here but I’ve picked out the following observations:
- Despite Liddell’s shutdown, aggregate black coal output increased in the post-closure period, driven by a net 250 MW increase in New South Wales. Total NEM black coal-fired output post-closure was only marginally down on the 2022 April – May comparison period.
- Brown coal output in Victoria increased by even more, probably a combination of higher prices and a couple of Yallourn units returning from outages which affected pre-closure average output.
- Gas fired output increased significantly post-closure, but remained lower than levels for the 2022 comparison period. Increases in Queensland and South Australia accounted for most of the change.
- Hydro output in New South Wales and Tasmania increased significantly post-closure.
- VRE (Variable Renewable Energy, ie large scale solar and wind) output was up strongly in Queensland on levels of a year ago.
- Conversely, South Australian VRE output was well down in the two weeks after Liddell closure – probably another factor driving the outsized price increase in that region.
- There was strong rooftop PV output growth in the northern NEM regions relative to 2022 – together with Queensland’s large scale VRE growth this was probably a factor moderating price increases in those northern regions.
- Interregional exports from Queensland to New South Wales grew significantly post-closure and were also up on last year’s levels. Conversely Victoria exported less in total than a year ago, with its exports swinging away from New South Wales and towards South Australia in the post-Liddell closure period – with relative price differences probably accounting for some of this shift.
Don’t forget about demand!
Finally, implied but not shown on the supply chart are the net demand changes for the different periods and regions. This is important to keep in mind when comparing supply and price changes across periods: for the two weeks post-closure, average NEM-wide demand was 1,150 MW or 5% higher than in the prior three weeks, and 1,240 MW higher than in the 2022 comparison period. Both these changes were larger than the net effect of Liddell’s retirement (900 – 950 MW), so would have played a very significant role in driving the supply and price changes discussed above. But in Queensland (which likes to be different) demand in the post-closure period actually fell nearly 200 MW!
Like Zhou Enlai, I’ll now wait a little bit longer to form any further opinions on what Liddell’s shutdown might mean.
=================================================================================================
About our Guest Author
 |
Allan O’Neil has worked in Australia’s wholesale energy markets since their creation in the mid-1990’s, in trading, risk management, forecasting and analytical roles with major NEM electricity and gas retail and generation companies.
He is now an independent energy markets consultant, working with clients on projects across a spectrum of wholesale, retail, electricity and gas issues. You can view Allan’s LinkedIn profile here. Allan will be occasionally reviewing market events here on WattClarity Allan has also begun providing an on-site educational service covering how spot prices are set in the NEM, and other important aspects of the physical electricity market – further details here. |
Allan great analysis. I believe it’s not going to be good ending.
“Heard about the guy who fell off a skyscraper? On his way down past each floor, he kept saying to reassure himself: So far so good… so far so good… so far so good. How you fall doesn’t matter. It’s how you land!” 🙂