Returning from my (virtual) sojourn in the highly-stressed Texas electricity market today, this is a short article highlighting the accelerating rise in negative prices in the NEM.
For a number of years we’ve been focusing specifically on Q2 periods (i.e. because they have traditionally been a more ‘boring’ one) in order to understand changing underlying patterns of pricing – this was last done for Q2 2020 here.
However a spike in discussions recently suggested to me that a short article covering the whole year would be widely useful.
Looking at the whole year, the picture is striking:
(A) Trend in annual incidence
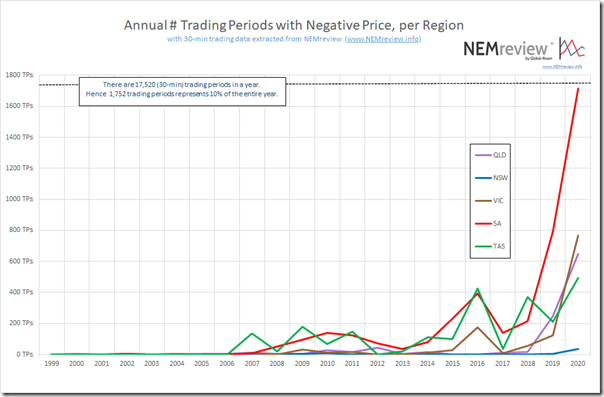
Let’s start with a simple trend over time of the annual incidence across all regions (leaving off the defunct Snowy Region from earlier years):
As we can see from the chart with data extracted from NEMreview, SA trading periods were in negative territory for 10% of the time (almost exactly) through the whole of 2020.
Three other regions (QLD, VIC and TAS) were clustered around 2.5-4.5% of the time.
NSW has shifted up a little, but it’s barely visible on comparative scale.
(B) Looking by Time of Day
Where it becomes more interesting is when we look at patterns by time-of-day and see differences between regions that perhaps were not so apparent when just letting a NEMwatch dashboard run in the background:
(B1) QLD Region
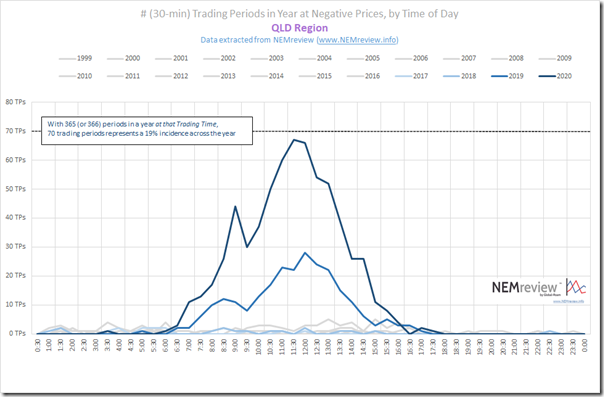
Starting at the top of the NEM, we see that there has been a sharp uptick in negative prices in QLD in sunlight hours (particularly the middle of the day) … but not at any other time:
Almost 20% of all trading periods at 11:30 and 12:00 were below $0/MWh in calendar 2020 … more than double the incidence in 2019. This is primarily because of the boom in rooftop PV in the QLD region eating away at Grid Demand in the middle of the day … but there’s also a large whack of Large Solar plant operating, and (as Allan discussed here and then here) there are reasons why coal plant in QLD might also be bidding negative as well at that time.
In his article on 12th February, Nick Bartels used the GSD2020 and earlier GSD2019 to illustrate how some of the coal plant in QLD are adjusting to these new realities to provide greater flexibility to the market as a result … but that will only go so far.
(B2) NSW Region
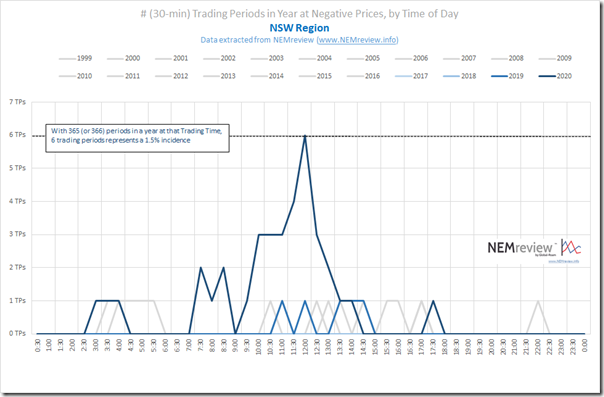
Across the border into NSW and we see that this region has (until the end of 2020, at least) remained someone immune from the contagion:
But that won’t last forever.
(B3) VIC Region
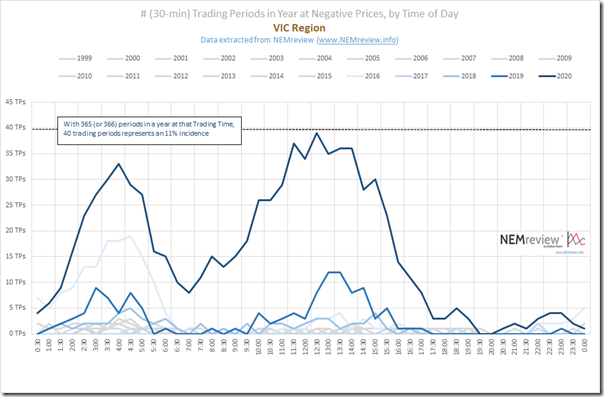
The pattern in Victoria surprised me when I saw it:
I mean, I’d obviously seen a high incidence of negative prices during the day (as had been watching the NEMwatch dashboard out of the corner of my eye whilst working on other things) – but it was the significant spike in negative prices in the early hours of the morning that I was not as aware of! For some reason I mustn’t have been watching NEMwatch as closely then.
Without digging into the data, I would guess that this would be the result of a combination of more wind production in the south (compared to QLD) coupled with lower underlying consumption at those points in time (compared to the middle of the day).
It does, however, point out how it makes it increasingly challenging for any new entrant to build more capacity (wind or solar) and make a return in the VIC Region. Without considering the seasons of the pricing patterns, there might also be questions there for the viability of energy arbitrage through storage?
(B4) SA Region
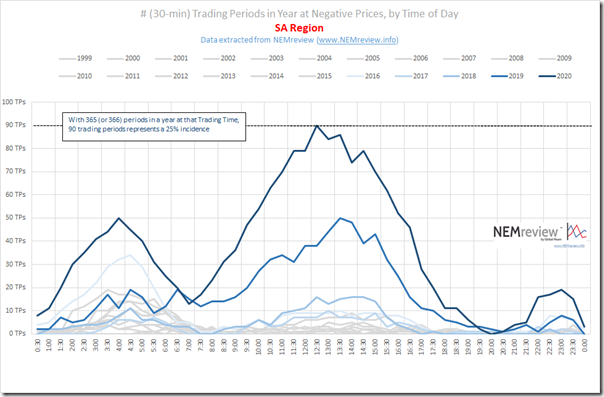
The pattern for South Australia is like Victoria on steroids:
South Australia, through 2020, saw both:
1) More negative priced trading periods in the middle of the day than Queensland, the next highest (because of ‘too much’ solar, primarily); but also
2) More negative priced trading periods in the early hours of the morning than Victoria, the next highest (because of ‘too much’ wind)
No wonder VWA Prices for Wind Farms in South Australia are looking pretty rotten, in comparative terms. Talk about a challenging place to build more of anything!
For those who think that the synchronous condensers are the ‘magic wand’ to bring back good returns – I have not done the numbers, but suspect that the benefit they will unlock (in terms of allowing more non-synchronous generation to operate) will prove very fleeting, as the juggernaut of rooftop PV will keep rolling on and mow down returns for Semi-Scheduled assets.
(B5) TAS Region
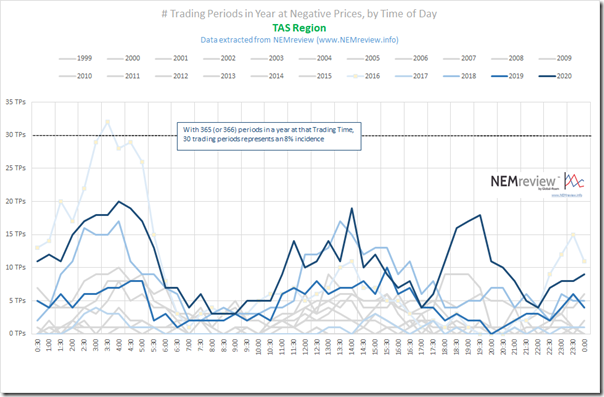
One look at the Tassie region reinforces that it has its own unique dynamics that are a result of the size, the (relatively) flat demand curve, the mix of generation type (and largely single owner), the (relative) of Basslink and so on:
In the case of TAS we see the pattern of negative incidence in 2020 has not run away from that of prior years … however experience would still suggest ‘Project Developer Beware!’ in making a decision on entering the TAS Region.
The sharp escalation in the incidence of negative pricing in all regions of the NEM (but less so in NSW, for now) is one of the reasons why the trend in monthly time-weighted average prices has dropped in 2020.
Whilst others might celebrate what the reduction in wholesale prices coming down means for retail prices and so on, I have some concerns about the boom/bust element of pricing outcomes that might be being built into forward price path by the way in which this energy transition is being encouraged and managed. Unless (or, rather, until) something changes* I expect that this trend in negative prices to accelerate further in 2021 and into 20222 … with all sorts of unintended consequences potentially resulting.
* When we talk about ‘something changing’, if the objective is to reduce emissions rapidly, then the closure of coal will be the way to achieve that.
Kerry Schott is quoted (e.g. in AFR and Australian) as saying that coal plant are hurting – but also as saying that they will just exit of their own accord.
Whilst exits will undoubtedly happen (something we will explore, in some detail, in the GRC2020 update), without more focus placed on that as the actual objective, it is quite possible that the exits will be jarring for the market (despite attempts in the ‘Notice of Closure’ regime).


The outcomes for 2020 have been compounded across the board by Covid impacts on demand.
The prices in QLD were negative much of the time due to QLD > NSW interconnector being restricted during day light hours during low demand periods. Typically there is some work on the lines, but 2020 saw an increase due to the upgrades on the interconnector and related equipment. Some of the activities of the FF plant in QLD needs to be questioned as there are times when more units should be taken off line, even if it means a bit more use of gas. It will be interesting to see the impact of 1GW of wind generation capacity is online.
NSW won’t see many negative prices until it has more VRE. I doubt this threshold will be reached in the next two years.
The ACCC should be investigating the predatory pricing of some of the coal generators. Just because it is difficult or costly for them to ramp their plant, doesn’t mean it is legal to force the prices negative due to excess supply. This is particularly the case in Victoria and QLD where the coal generators have significant market power to fall under this section of the Australian Competition Law.
Craig your last para does not make any sense. Why is it not legal for coal generators to bid negative? Why would it be in their interests to force prices negative? if it’s not legal for them, why is it legal for wind and solar generators to do it? the point of negative prices is to signal excess supply, so sounds like the market working as it’s supposed to. also why would QLD generating companies run less coal and more gas when gas is more expensive?
Anyway good luck getting the ACCC to do anything about the state owned generators in QLD…i mean they’d probably quite like to but ACCC can’t always do a lot about the actions of publicly owned businesses.
Predatory pricing has to do with market power. There aren’t any wind farm operators with enough market share to be able to dominate the market. This is not the case with AGL in Victoria and the QLD government owned generators in QLD. If you do a search for predatory pricing and Woolworths you will see there was a successful case run by the former Trade Practices Commission under the former Trade Practices Act. The current Australian Competition Law has been strengthen in regard to predatory pricing.
Generally the ACCC will only take action if it is in the media or has a large impact on consumers. These cases certainly fit the latter as the dominant generators can make it unprofitable for small VRE to produce power. This discourages further investment in VRE and would extend the time that the coal plants are operated for.
Why run gas? If the QLD Government owned generators shut down a coal fired unit in the low demand and high VRE output months, then most of the time there would be no or very little need to operate the fossil gas plants. Now it might be cheaper for the QLD Government to run excess coal plant and push the VRE generators out of the market, but it isn’t fair, legal, in the long term interests of Queenslanders both in terms of the wholesale electricity rates or the climate.
I fully understand that predatory pricing cases are complex and difficult. The Woolworths one run through the courts, including all the way to the High Court, over a ten year period.
Well, the Queensland government who own the coal power stations there have set a renewable energy target of 50% and set up a new company CleanCo to invest in VRE, and write PPAs with VRE to help them get there. So i’m still not sure why you think they are trying to discourage VRE.
AGL have a single coal plant in Victoria, so they are in no way “dominant”. perhaps you meant to type NSW where they have two…although they are closing one in the next couple of years which is odd behaviour for a “dominant” player.
There are multiple layers of ongoing monitoring of behaviour in the NEM. the AER and the ACCC both have roles in this regard. So it’s not like no-one is looking.
When there’s a lot of VRE, i.e. when the prices are negative, no-one has market power and anyone who bids below 0 is only doing so because they are desperate to be dispatched. VRE do it because they still earn via their PPA, coal plant do it because they can’t afford to go offline and have to restart. That being “costly or difficult” is a perfectly good reason.
I don’t imagine i’m going to change your mind, but just in case anyone else is reading…
Negative prices are ‘predatory’? First I’ve ever heard it explained that way.
Wind and solar are still supported above market rates by PPAs (just ask AGL) and the RET. these generators almost all bid negative just to get dispatched. With governments underwriting RE the market is oversupplied during the day when the overpaid rooftop solar is in full flight.
Currently there is only investment in generation that runs when there is wind and sun. So the energy-only market indicates oversupply during these periods.
Until governments remove the incentives causing oversupply when there’s wind and sun, there will be no investment in anything else.
Perhaps a capacity market would change things, but I’m doubtful. I think we are destined for blackouts
Adelaide, Melbourne, California, Texas, who’s next – Germany, UK?