
We’ve already progressively discussed a number of other factors leading to the ‘anything but boring’ price outcomes seen in Q2 2021 – and on Monday 16th August I summarised a number of these contributing factors in this article.
As noted in that article, the AER’s Wholesale Markets Quarterly highlighted one example where low wind production was one factor that contributed to price volatility on 17th May and 18th May:
“Wind conditions across South Australia and Victoria are often similar but it is less common for the same wind conditions to cover NSW as well. However on 17 and 18 May, calm conditions saw wind generation fall across all 3 regions at the same time. At its lowest point only 320 MW was generated out of a possible 6,500 MW of capacity. The lack of low priced wind capacity was one of several factors that contributed to prices rising above $5,000/MWh in the 3 regions. The other factors included unavailable baseload generation due to outages and high demand.”
However, having watched a high percentage of the volatile periods unfold through the quarter, one of the things that had struck me was what seemed to be a relatively high degree of correlation between high prices and low wind production – i.e. more than just on 17th May and 18th May.
1) It seemed to be the case (because these price spikes occurred most often during evening peak in demand), that the wind harvest had been consistently low when demand had been high.
If this were to be the case, not only would it be interesting from the perspective of Q2 2021 – but it would also highlight more systemic questions to be grappled with as the energy transition continues to roll along.
2) I wondered whether this was statistically the case in reality – or whether my memory had been playing tricks on me (i.e. because I’d paid most attention when prices were high – not necessarily all of the time when demand was high at evening peaks).
So I started to dig into the data, more statistically, and found that the story was more complex than what it had seemed to be in my spot-checking process throughout the quarter.
(A) Looking NEM-wide
In this statistical review, looking at the degree of correlation (or anti-correlation) between wind production and operational demand, it was logical to start on a NEM-wide basis…
(A1) Correlation between NEM-wide Wind Capability and NEM-wide Operational Demand
Remembering that wind farm output can be artificially supressed on occasions (such as when prices are negative, or when constraints are applied – though remembering Marcelle’s caution that estimating the actual curtailment is more difficult than it might initially seem) I reasoned that it would be better to look at a correlation between aggregate Energy-Constrained Availability across all wind farms against Operational Demand.
That’s what the following correlation plot shows for the ~26,260 dispatch intervals through the quarter (using ‘Demand and Non-Sched Gen’ as an approximation for Operational Demand, because AEMO does not publish this on a 5-minute basis):

In the top right of the chart, we see some instances where wind capability almost the maximum at the time when the NEM-wide demand was also quite high. We also see (in the bottom right) instances of low wind production at other times of high demand.
More fundamentally, there did not seem to be too many instances where NEM-wide operational demand was higher than 29,000MW.
(A2) Categorising the numbers
The above scatter plot provides an overview – but we really need to ‘chunk up’ the numbers in order to properly make sense of them – which is what I have done in the following distribution chart:

Across the x-axis are buckets of operational demand instances in 1,000MW lots – from the lowest demand seen in the quarter (15,958 MW – at 12:55 on 2nd April 2021) up to the highest demand seen in the quarter (31,842MW – at 17:55 on 9th June 2021, which was 15 minutes after this snapshot was taken).
For each of these 1,000MW slices of demand, we’ve categorised the aggregate wind farm availability in 500MW buckets and stacked them together.
This clearly shows that the there’s a bias towards higher NEM-wide wind capability at times of higher NEM-wide operational demand:
1) Which is a great thing to see;
2) But it also puzzled me…
(B) Looking just at NSW+QLD
… I wondered why (and how) it was that these statistics conveyed the opposite of what I had thought I was seeing as the quarter evolved. After a bit of head scratching, I recognised that:
1) I had been looking on an individual region basis, and that
2) because the prices had spiked more often in QLD and NSW, I had more frequently (just) been looking in those two regions, and seeing low wind output patterns happening frequently – coincident with high prices (and evening peak in demand).
So I reran the data aggregation process …
(B1) Distribution of instances, just for NSW+QLD
In re-running the numbers, I just looked at QLD+NSW together – and what was revealed was much more like what I had been expecting:

So in summary:
1) Just looking at NSW+QLD, it’s clear that wind capability was consistently low when demand was high (i.e. just inside NSW+QLD)
2) This coincided with (and indeed was one factor contributing to) price volatility in those two regions.
(B2) Distribution of price instances in NSW
There’s an implicit assumption in the above that the periods of high ‘NSW+QLD’ Operational Demand coincided with the times of highest prices … so (having been ‘once bitten’ on a NEM-wide basis above) I thought it necessary to re-run the distribution function, but look at instances of (still 30-minute) Trading Prices in NSW against NSW+QLD Operational Demand:
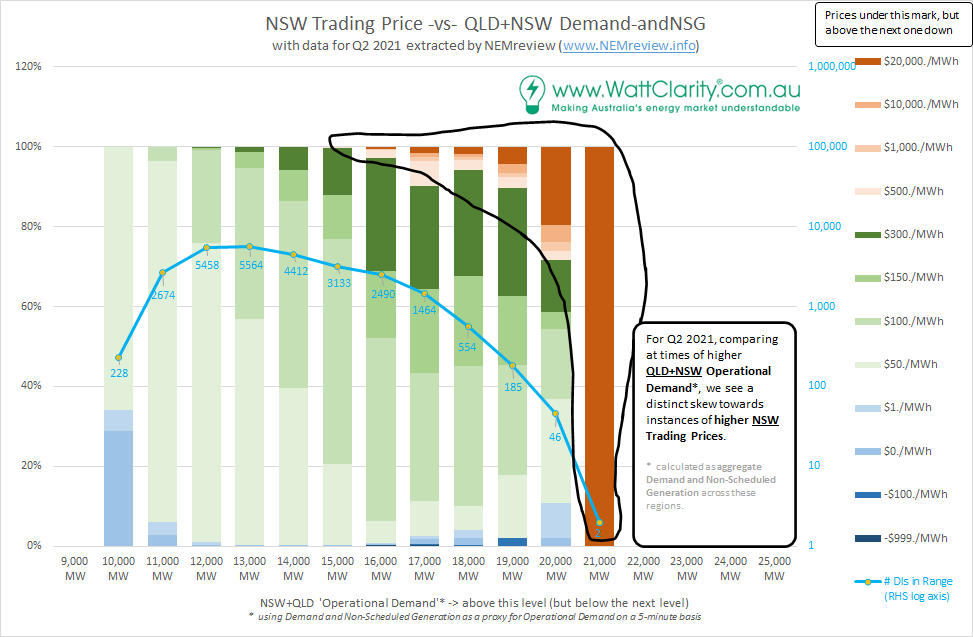
We can clearly see that the instances of higher prices were skewed towards instances of higher NSW+QLD Operational Demand, which is what I had been assuming (but nice to confirm, anyway).
(B3) Distribution of price instances in QLD
For completeness, here’s also the same distribution – but using Trading Prices in QLD instead of Trading Prices in NSW:
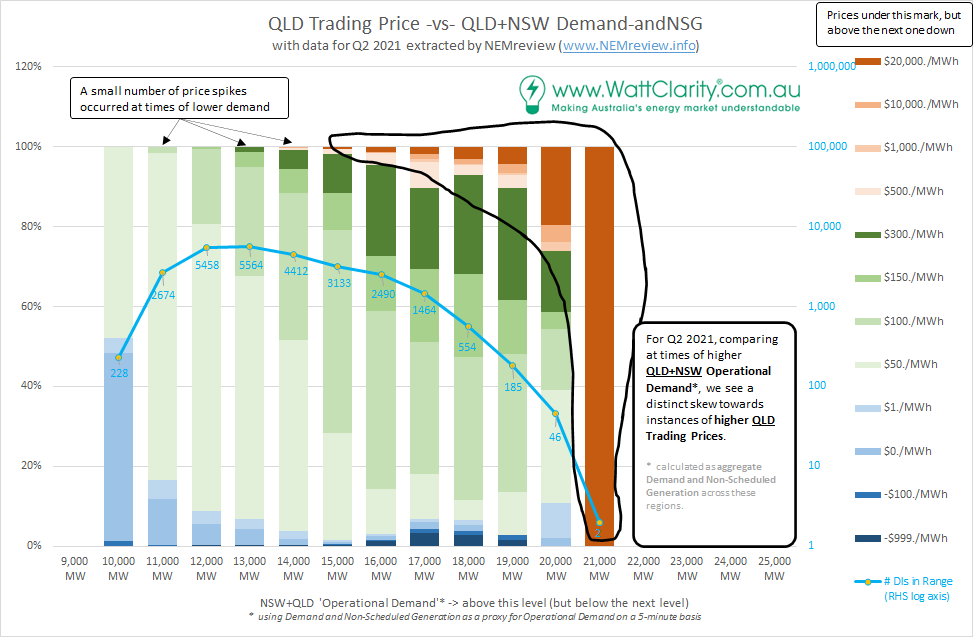
It’s no surprise, really, that the overall pattern is quite similar – with two differences standing out:
1) There are a small number of instances of high prices at times of lower demand, which would be (at least in part) due to what happened through the afternoon of Tuesday 25th May 2021 following the Callide C4 Catastrophe.
2) There are also many more instances of negative prices seen for the QLD region – which is also not a surprise, as it’s a pattern that has been persisting for a while.
(C) Looking just at VIC+SA+TAS
Taking the analysis a step further, it was then no surprise to see a strong correlation seen across VIC+SA+TAS with high wind capability seen primarily during periods of high operational demand:

As noted above (and in this summary of contributing factors) it was constraints on the VIC-NSW transfers that prevented this southern wind resource from placing downwards pressure on price spikes experienced in QLD and NSW.
1) I did not look specifically, but this suggests that there were a number of instances where prices were low in VIC, SA and TAS whilst spiking in QLD and NSW at times of peak demand.
2) This real-world example is a good reminder of the critical need to consider transmission development in any modelling study of high penetration renewables grids. To not take this into account risks leading the reader to some grossly incorrect conclusions.
| Timely, then, that the AEMC announced its ‘Review into delivering major long-term energy Transmission Projects’ last week on Thursday 19th August 2021! |
(D) Delving further into Wind Correlation
I’ve noted this before, but worth noting again in the context of this article – as part of GenInsights21 (which we continue to develop) we’ve completed a detailed long-range assessment of the degree of wind farm output correlation on a NEM-wide basis, assuming a future full deployment at many sites right across the NEM. We’re looking forward to sharing more of what we have uncovered there, with the publication* of GenInsights21.
* regarding a publication ETA, we had been expecting to publish this during Q3 2021 – but that is looking doubtful given our focus has primarily been on a range of other initiatives (principal amongst them being preparations for Five Minute Settlement, which has been consuming much of our focus in recent months).
Hi Paul: Two years ago I prepared a report for a State Government and highlighted the issue of what I called strategic energy capacity when %VRE exceeds ~ 90%. Also the fact that wind energy provides greater value than solar energy because it generates after dark – but still there are times of low supply. The 200 page report was about challenges for the power system transitioning to 2050.
The other thing I pointed out (relating to this article) is is that economic transmission capacity will still provide significant constraints in Australia with a large network (km) to be able to share VRE capacity across the distances. Simply the fact that 1000km of DDCT 330kV transmission line costs over $2.5Bn (800MW per circuit). Even if you take $2.5Bn/1600MW the unit cost is about $1.5M per MW. Hence you can build local wind and solar excess capacity at less cost. Strategic energy capacity would also be less than this taking into account it is say 96% reliable compared with remote generation from distant VRE which may also be low hence less reliable – your data will provide me some insight into this level of reliability over the quarter for consideration of this future issue.
Many thanks for such great articles in WattClarity!!