
With NEM constraints being flavour of the month on WattClarity, this post was prompted by notice of some forthcoming changes to key system strength constraints in South Australia.
In it I’ll attempt to explain:
- The current approach to managing system strength in South Australia which in addition to constraints involves frequent direction of generators (a form of market intervention) by AEMO, and why it has been necessary.
- Some of the impacts of this approach on generators in South Australia, starting with observations by AEMO in its most recent Quarterly Energy Dynamics report and then using December 2020 market data for more detail.
- How things may change with the imminent installation of synchronous condensers on the South Australian grid.
What is this “System Strength”?
If you read daily press clippings about the NEM then a) you probably work in the industry (or don’t really have a life), and b) you are probably aware of regular references in the last few years to AEMO having to increasingly frequently intervene in the market “to keep the lights on” or “to keep the system stable”.
More casual readers of those articles might get the impression of a power system continually on the verge of collapse, with AEMO control room staff frantically pulling various levers or pushing big red buttons to stave off imminent blackouts on a weekly or daily basis.
That would be overstating things just a tad. The term “intervene” needs context; in recent years by far the most frequent form of intervention has been AEMO requiring – usually well ahead of time – certain large generators in South Australia to stay online through periods when they would otherwise go offline (“decommit”) because forecast market prices are too low for economic running.
AEMO wants these generators to stay online to bolster a physical property of the power grid known as “system strength”. Unlike energy or ancillary services (frequency control), the NEM market design does not remunerate generators for provision of this property, so they have no commercial incentive to provide it when energy and FCAS prices are not high enough to keep them online.
In fact – and unlike certain other unpriced services, such as inertia – it’s not even straightforward to define or precisely quantify what system strength is and how much a given generator contributes. It’s very roughly like a person’s ability on the dancefloor – most obvious when it’s lacking.
AEMO does provide a slightly more technical definition along the following lines:
System strength reflects the sensitivity of power system variables to disturbances. It indicates inherent local system robustness, with respect to properties other than inertia.
System strength affects the stability and dynamics of generating systems’ control systems, and the ability of the power system to both:
-
- Remain stable under normal conditions, and
- Return to steady-state conditions following a disturbance (such as a fault).
Large synchronous machines (hydro, gas, and coal generation, and synchronous condensers) inherently contribute to system strength.
Non-synchronous generation (batteries, wind, and solar photovoltaic (PV) generation) does not presently provide inherent contribution to system strength.
How is it managed?
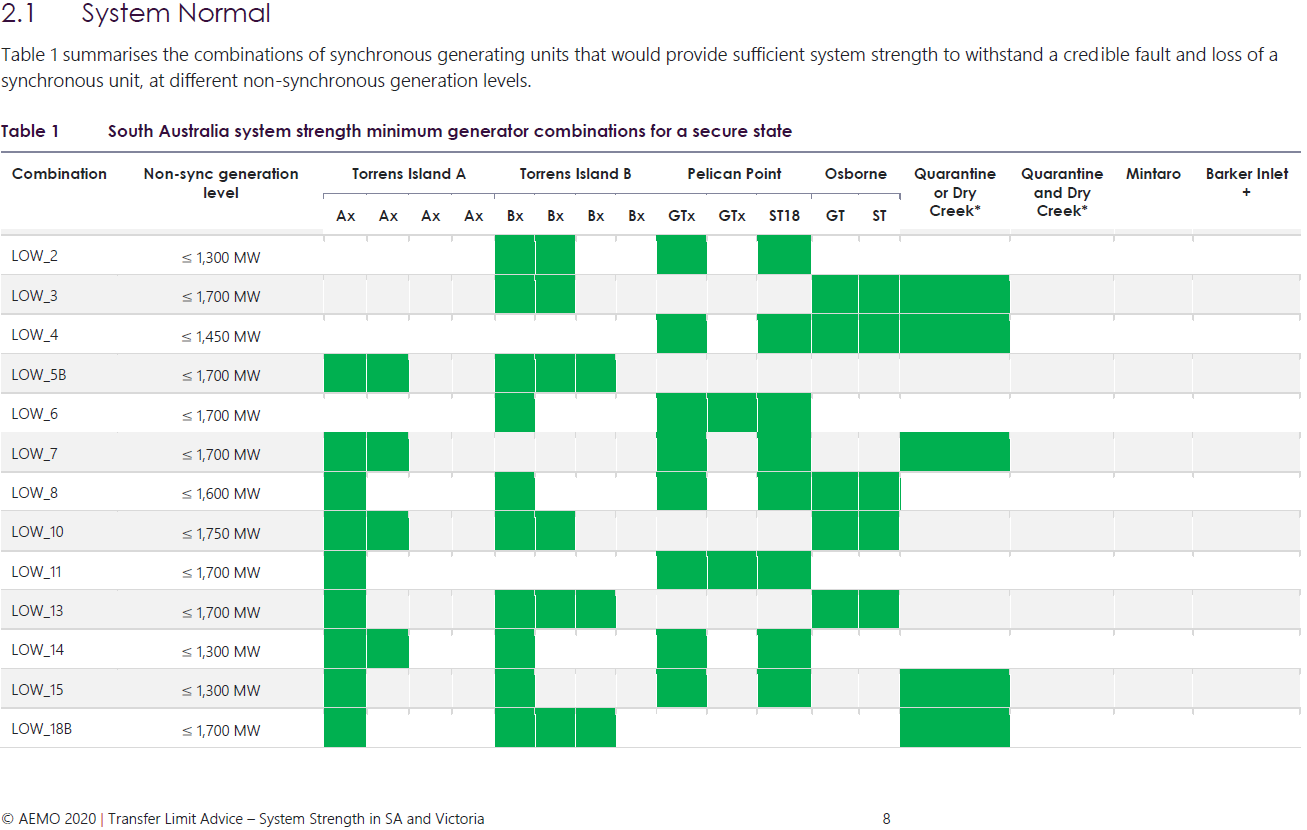
Whichever type of definition you prefer, the bottom line is that AEMO has studied things in great detail in South Australia (as well as certain other parts of the NEM), concluding that maintenance of system security in that region – robustness against possible but unpredictable events like trips of transmission lines or generators – requires certain minimum combinations of South Australia’s larger synchronous generators to be online at all times. Dozens of possible combinations have been identified by AEMO’s studies, to illustrate that here are about a quarter of them from AEMO’s most recent full tabulation:
If forecast market prices aren’t high enough and too many of those generators have signalled their intention to decommit (through the predispatch and STPASA forecasting processes), then AEMO intervenes and issues formal instructions – known as Directions – to one or more selected generators to remain online.
So where do Constraints fit in?
Alongside these minimum synchronous conditions, AEMO’s studies also identify maximum levels of large non-synchronous generation output which are consistent with system security. These maximum levels vary according to the combination of synchronous generators online (and appear in the second column of the table above). To enforce these maximum output levels, AEMO uses two system normal constraints on aggregate non-synchronous output in South Australia. “System normal” means that the constraints are always active (“invoked” in NEM parlance), with the constraint limits (“Right Hand Side” terms) varying according to which combination of synchronous generators are running.
Two interesting points here:
- For anyone wondering why the minimum combinations of synchronous generation can’t also be managed through constraints rather than intervention – one major reason is that the minimum conditions are based on discrete binary variables: certain generators being online or offline. Their actual output levels when online don’t really matter to system strength. Market dispatch is run by a linear program – NEMDE – which can’t handle constraints based on discrete variables, only on continuous ones like unit output. So AEMO has to enforce the minimum combinations by intervening.
- Were it not for that issue, the febrile discussion around “AEMO interventions to keep the lights on” might disappear – but the underlying impacts on dispatch patterns would be similar. In a sense a “constraint” is just a more codified form of “intervention” – or vice versa.
There’s also a point about compensation. When AEMO intervenes and directs generators to run, they are entitled under the market rules to some form of compensation in addition to or instead of payment for their energy at the spot price. But constrained generators aren’t compensated for any impacts of those constraints. So constraints on the synchronous generators might not be effective anyway – they could continue to bid as unavailable, forcing AEMO to intervene – and compensate them for doing so.
How did it come to this?
For much of the NEM’s history, this form of intervention wasn’t required because almost all of the NEM’s generators were synchronous machines inherently supporting system strength. But the growth of non-synchronous generation – both large scale renewables and small-scale PV – has decoupled the provision of energy and system strength. A bit like the dancefloor being infiltrated by very eager but not especially skilled dancers.
The original designers of the NEM didn’t foresee this particular issue arising and didn’t provide any market mechanisms to create incentives for providing system strength. The difficulties in even quantifying this capability also mean that practical market mechanisms would be hard to design. For other system services of this ilk, such as voltage control, there were existing non-market mechanisms allowing AEMO to procure services as required, but nothing for system strength. So AEMO intervention became the stopgap approach to bridge this gap.
In the background, work went on to establish a less ad-hoc and more economic approach to ensuring adequate provision of system strength. The upshot of that work is that the South Australian transmission provider ElectraNet is in the final stages of procuring and installing four synchronous condensers – a technology which has been around the industry for many decades, essentially very large and specialized high voltage electric motors – to be installed at various locations on the SA grid, which will provide system strength (as well as inertia), allowing relaxation of at least some of the current minimum requirements for synchronous generators to remain online.
Recent Impacts
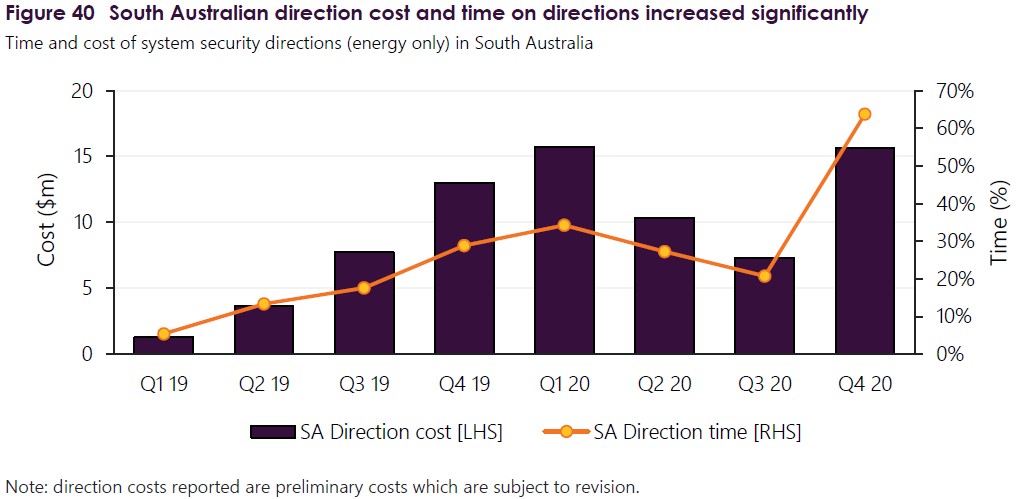
AEMO’s recently released Quarterly Energy Dynamics report for Q4 2020 provides a useful overview of some key impacts of security directions in South Australia – the chart below shows the quarterly compensation costs, and proportion of time active, for directions in that region; outside Q1 2020 where some directions were due to the special circumstances of the region being islanded for a long period, almost all of this would have related to the system strength regime discussed above.
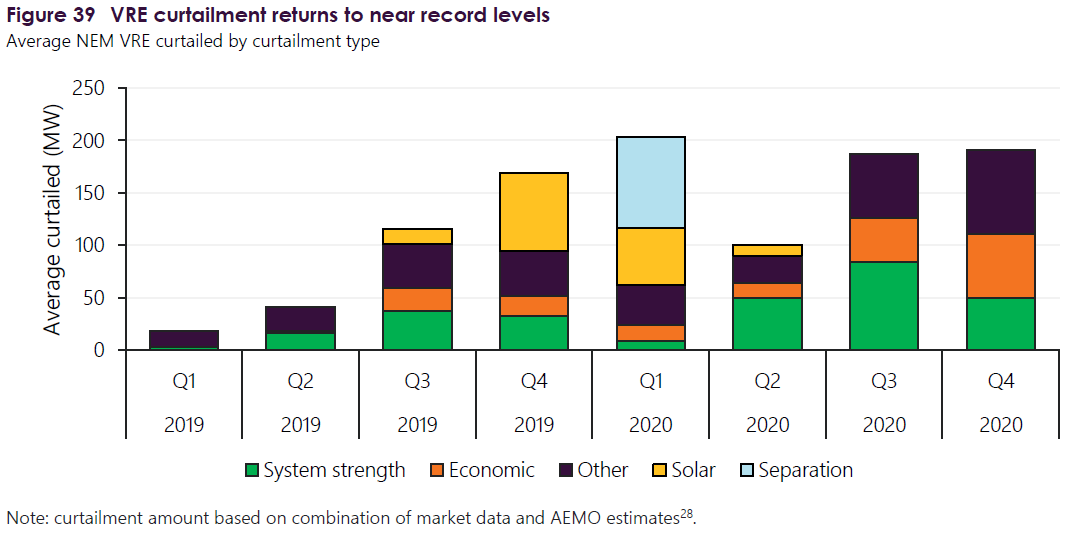
Another chart in AEMO’s QED report shows the level of “VRE curtailment” – reductions in large scale wind and solar output across the NEM due to various factors, including system strength constraints. While this chart covers all NEM regions and all forms of curtailment, most of the system strength-related reductions would relate to South Australian wind and solar generators:
To analyze in a bit more depth, here are some results specific to South Australia based on five minute dispatch data for December 2020. The first chart shows generation directed to run at Pelican Point and Torrens Island:
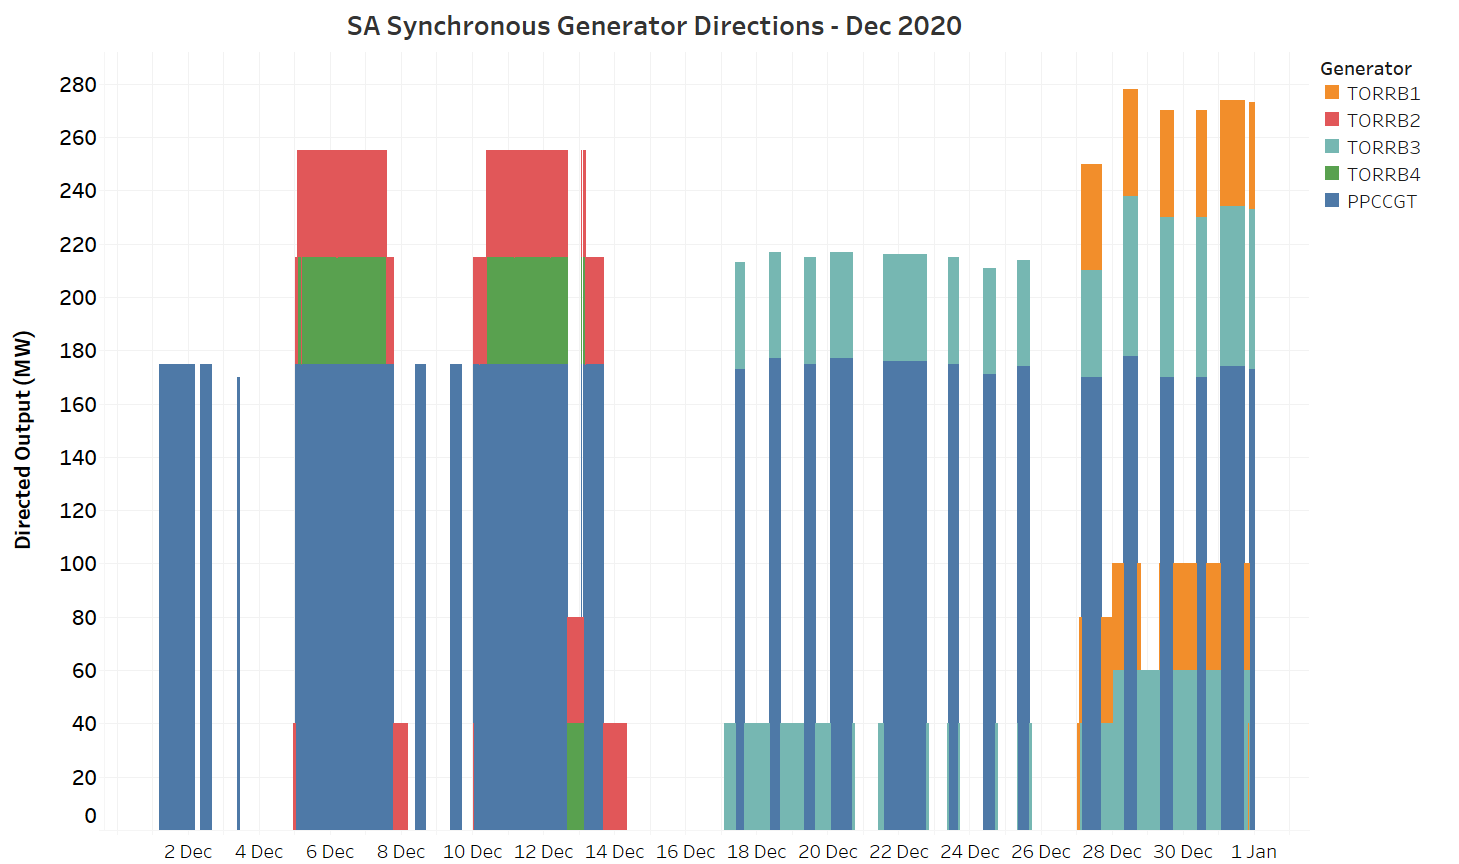
To be clear, these are not the only times that these units were running in December – only the periods where AEMO directions required them to stay online. These amounted to slightly more than 2/3 of the dispatch intervals in December. To put this in context the next chart shows the total level of synchronous generation over the month, overlaid on the directed running:
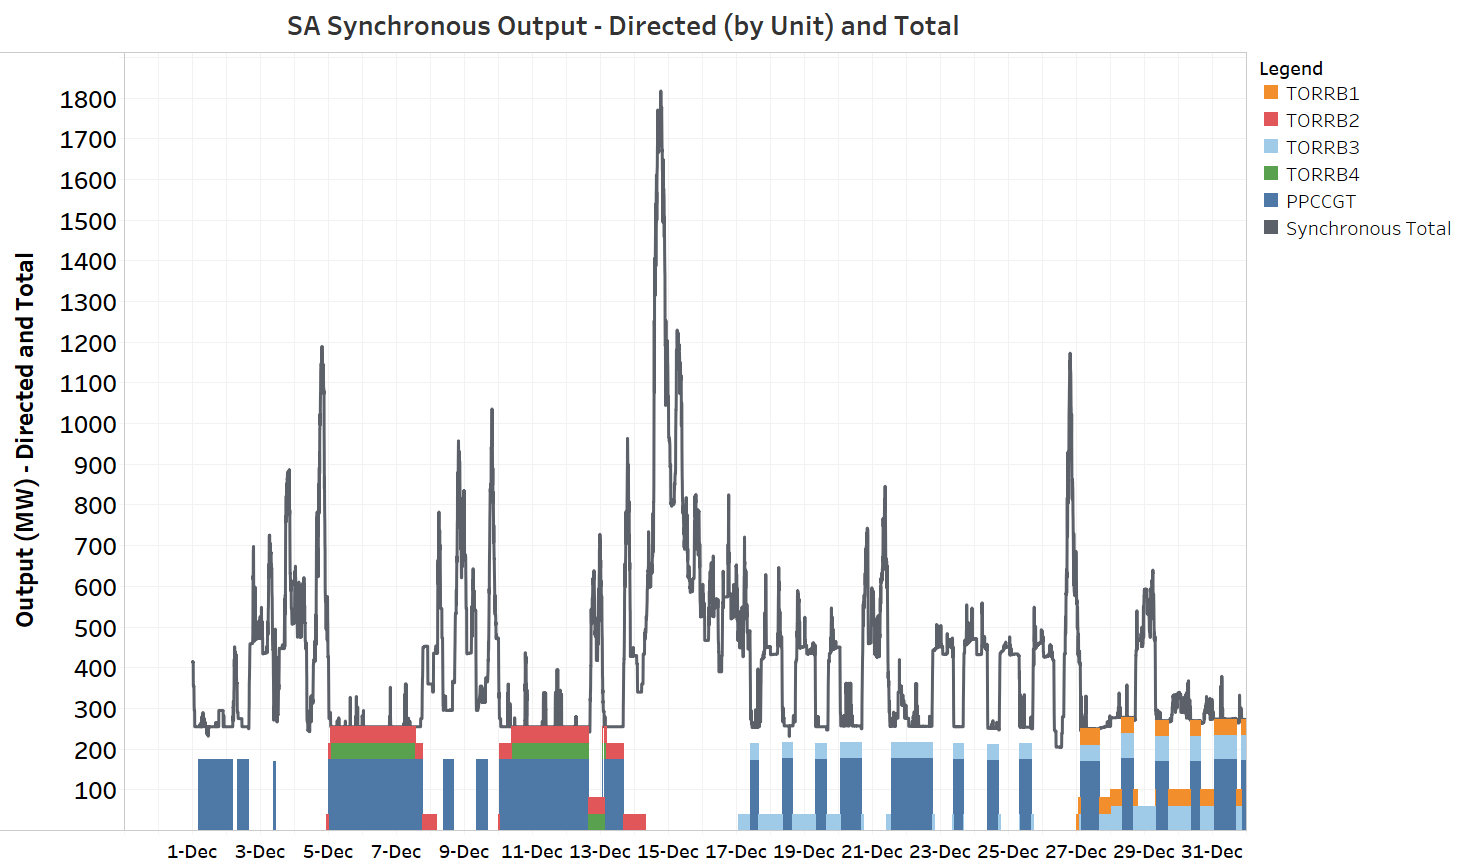
This chart highlights the role of directions in maintaining minimum dispatch of synchronous generators. In periods like 5th – 7th December (or 10th – 12th) the only synchronous units online continuously were the directed generators. However in periods like 14th – 16th – a period of higher demand, lower renewable output, and stronger prices – much more synchronous generation self-dispatched and directions were unnecessary. It’s also noteworthy that in the second half of the month, directions were used frequently to keep synchronous units online during daylight hours, when they would otherwise have gone offline due to strong rooftop solar output reducing grid demand and suppressing spot prices.
In energy terms, output due to these directions accounted for around 30% of total synchronous production during December, and just under 10% of total large scale generation in South Australia.
So much for directions – what about constraints?
What about the impact of system strength constraints on South Australia’s semi-scheduled renewable generators? The next chart shows aggregate output from semi-scheduled generators subject to the key limiting constraint, “S_NIL_STRENGTH_1”. I’ve added aggregate non-scheduled generation to the semi-scheduled total here (because the constraint effectively caps the sum of these components to fixed limits, which are in turn dependent on the combination of synchronous units online).
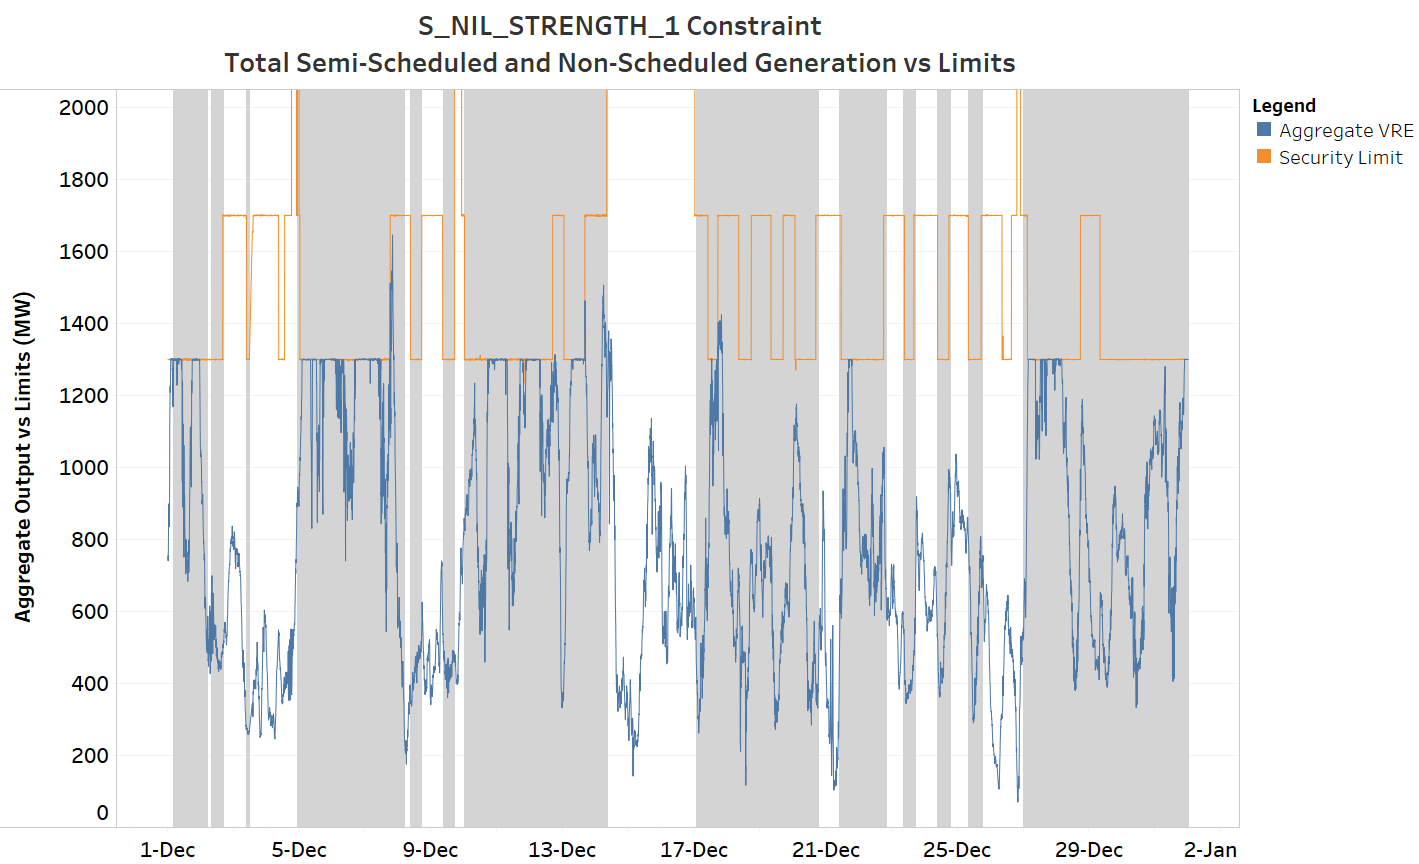
Shading indicates periods during which directions were in place for synchronous units. From this chart it’s clear how the constraint caps aggregate non-synchronous generation in some periods, particularly when the constraint limit is at its lower value of 1300 MW, corresponding to particular minimal combinations of synchronous units. Comparing aggregate output levels in this chart to the preceding one also makes clear how much more energy – despite curtailment – was supplied by the non-synchronous renewable generators during December – about twice as much as from synchronous generators, and that’s before accounting for production from rooftop solar.
So how much of the energy potentially available from these renewable generators was curtailed by this constraint? This is a little tricky to calculate for a number of reasons (see Marcelle Gannon’s excellent WattClarity article explaining why). However in the chart below I’ve estimated semi-scheduled generation curtailment due to the system strength constraint, as well as other curtailment – the main driver for the latter being economic “self-curtailment” during periods of strongly negative spot prices.
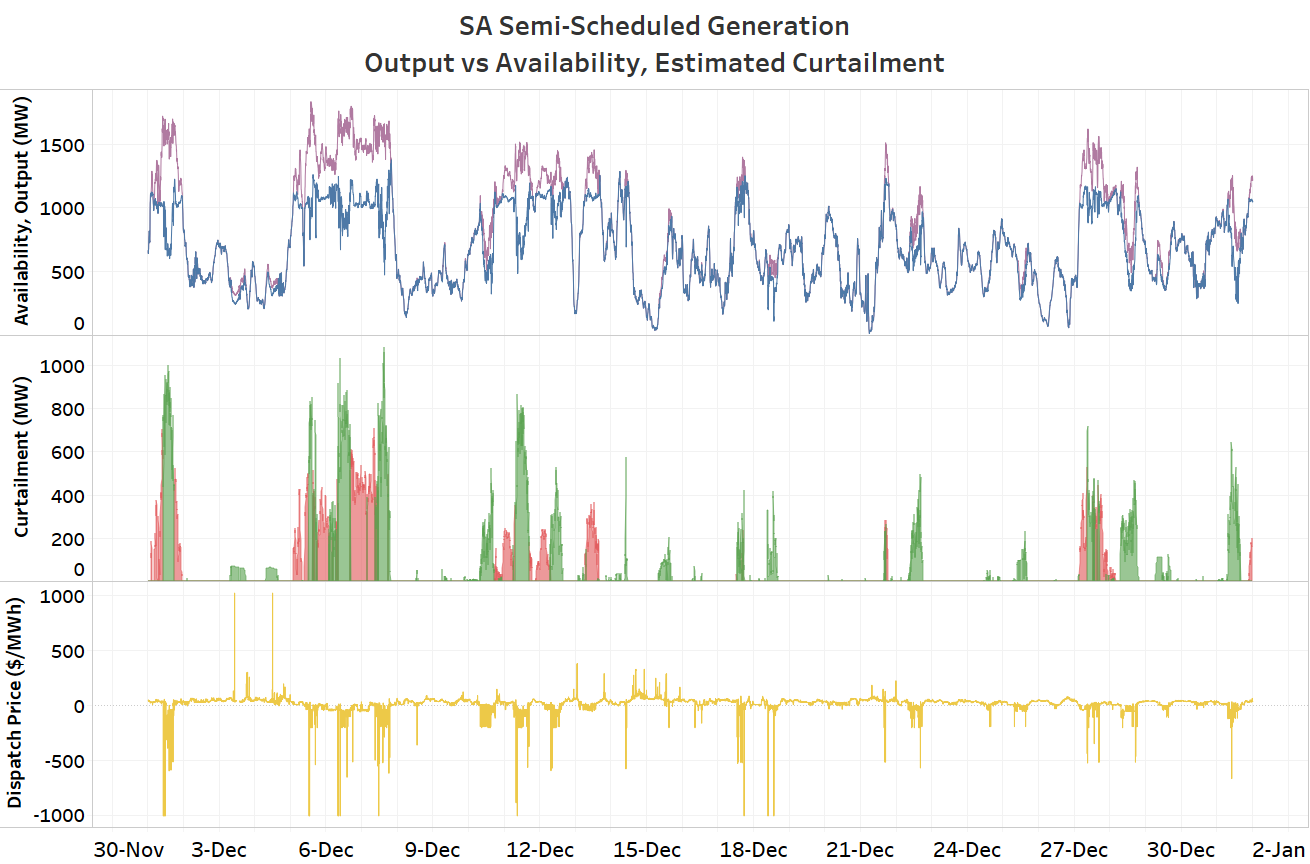
Curtailment corresponds to output (blue in the upper panel) being lower than availability (purple) (and in the underlying data the semi-dispatch flag being active, requiring a semi-scheduled generator to limit its output to no more than the dispatch target issued by NEMDE). Total curtailment observed was about 12% of potential output from these semi-scheduled generators. Curtailment corresponding to the system strength constraint binding is highlighted in red in the centre panel, while curtailment at times when this constraint was not binding is shown in green. The latter actually accounts for over 60% of the curtailment observed in December – ie of the 12% total curtailment, just under 5% was due to the system strength constraint binding and over 7% for other reasons; inspection of the chart also shows that most of this “other” curtailment aligns with periods of strongly negative dispatch price. This finding broadly aligns with AEMO’s observations for the NEM as a whole in the Q4 QED report.
Enter the Syncons
While not being the largest source – at least in recent months – curtailment due to the system strength constraint is still quite material for South Australian renewable generators, and they will be wondering how this might change when Electranet’s first two synchronous condensers are commissioned at Davenport (near the former location of the now-demolished Northern Power Station).
AEMO’s updated limits advice document provides some clues:
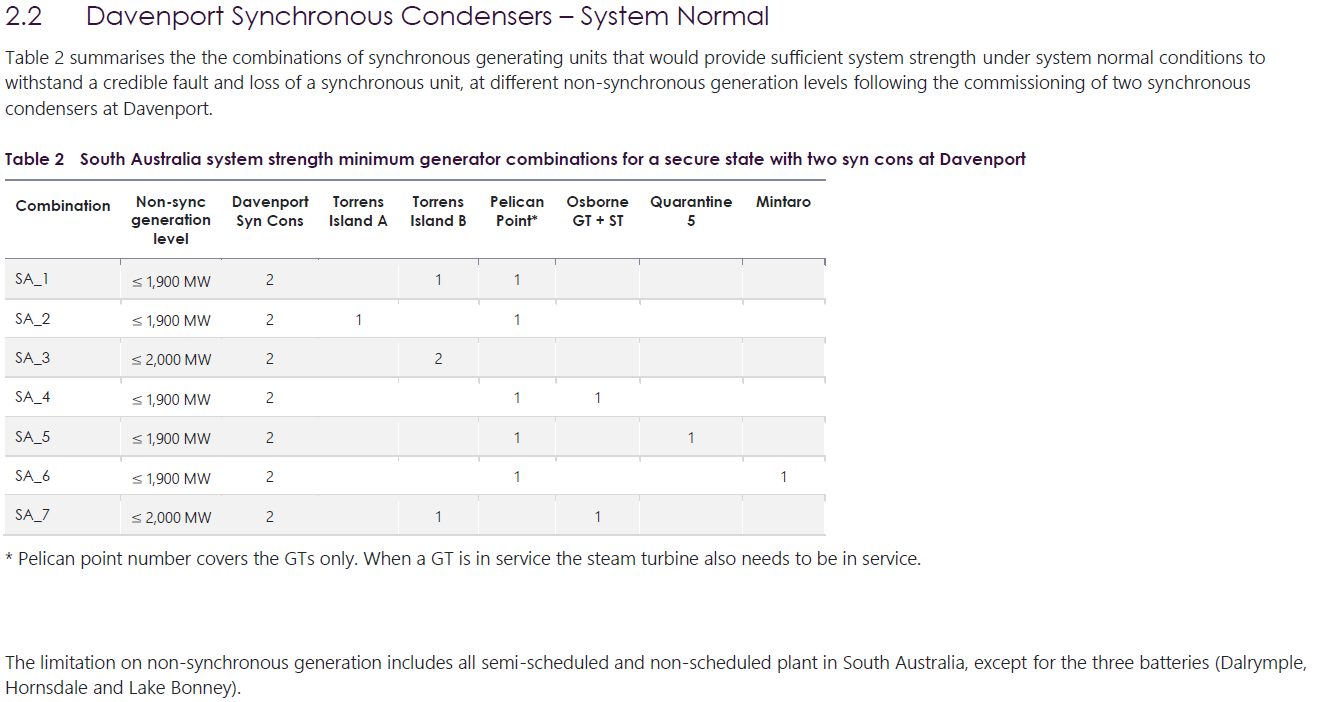
The first key point here is that the limits on total non-synchronous generation – under “system normal” conditions, when there are no relevant transmission outages that might tighten the system security envelope, move to relatively high levels of 1,900-2,000 MW, compared to current limits of 1,300-1,700 MW very frequently observed in December (and in many other months). This makes it seem very likely that after commissioning of the syncons – and assuming that these devices run more or less continuously – the updated system strength constraint will bind much less frequently than seen recently. (At least until additional renewable generation is commissioned in South Australia.)
What about “other” curtailment? This is a bit less obvious, but eyeballing the new minimum synchronous generator combinations in the above table, we can see that there are some combinations requiring significantly lower total output from synchronous units than previously. In particular combination “SA_3” requires only two Torrens Island B units online, or around 80 MW at minimum generation levels. Compare this to the ~250 MW levels recently observed under the current minimum combinations (because Pelican Point with a mingen of around 170 MW is very often one of the synchronous generators directed on): a secondary impact of the new combinations may be that with less synchronous generation forced to run, spot prices in South Australia might not be suppressed quite as frequently to the large negative levels observed recently. This in turn may result in less “economic curtailment” of renewable generation, along with the expected lower levels of curtailment due to increased system strength limits.
Finally, what about impacts on average spot prices? Fewer periods of strongly negative prices would tend to raise the average (which was only $17/MWh in December!), but on the other hand less “capping” of renewable output when the system strength constraint binds would usually tend to lower spot prices, all other things being equal. I’ll leave the question of overall impact to another day, and probably to another analyst – if the last few years have shown anything it’s that NEM price forecasting deserves its reputation as a mug’s game.
About our Guest Author
 |
Allan O’Neil has worked in Australia’s wholesale energy markets since their creation in the mid-1990’s, in trading, risk management, forecasting and analytical roles with major NEM electricity and gas retail and generation companies.
He is now an independent energy markets consultant, working with clients on projects across a spectrum of wholesale, retail, electricity and gas issues. You can view Allan’s LinkedIn profile here. Allan will be sporadically reviewing market events here on WattClarity Allan has also begun providing an on-site educational service covering how spot prices are set in the NEM, and other important aspects of the physical electricity market – further details here. |
SA’s grid is getting even more complicated. And that’s saying something.
The system strength shortfall declared in 2017 was supposedly addressed by the synchronous condensers, but there was a further inertia shortfall declared in 2020.
SA shortfall 2017: https://aemo.com.au/-/media/files/electricity/nem/planning_and_forecasting/ntndp/2017/second_update_to_the_2016_ntndp.pdf?la=en&hash=A9EE910B7DA3C1D88927871630C02B48
SA shortfall 2020
https://www.aemo.com.au/-/media/files/electricity/nem/planning_and_forecasting/Operability/2020/2020-System-Strength-and-Inertia-Report
Separate but related to the shortage of synchronous generation in SA, is the imminent closure of Torrens Island A which is prominent in the combinations of minimum synchronous generator. Then there is the likely cancellation, or at least delay, of the EnergyConnect transmission link to Wagga, and the inability to shut off excess rooftop solar. Tough place to be in energy politics.
I wonder which heavy industry, reliant on large amounts of electricity, is considering South Australia as a potential investment location? I guess there will always be government subsidised, unprofitable, low capacity factor, hydrogen to clap about.
How much does the cost of SA’s upgrades count towards the rest of the NEM’s bills?
Any idea of the effects of the current constraints on the Heywood interconnecter due to be repaired late June?
With no where to go, negative prices are inevitable
Disappointed these Syncons are taking so long. Originally instal was late Jan and now we are out to late April
I must be a bit behind but haven’t come across the acronym VRE before and my search (Ctrl+F) only finds one mention in this article with no real explanation “”VRE curtailment” – reductions in large scale wind and solar output across the NEM due to various factors, including system strength constraints” doesn’t really explain what it is nor where the acronym comes from. I would appreciate an explainer greater than is given under Figure 40 please.
Shane
“VRE” = Variable Renewable Energy. Basically shorthand for wind and solar generators whose output is variable with incident wind or sunlight. Large scale VRE generators in the NEM generally require capability to control output downwards – curtail – when instructed by AEMO.