
Last week I published this analysis of large thermals (mostly in QLD) using the Generator Statistical Digest 2020 and the prior release.
On Friday 12th February, Paul McArdle posted more about the pain being experienced at AGL Energy, this time focusing on the 12 large coal-fired units in the AGL Energy fleet – Liddell (4 units), Bayswater (4 units) and Loy Yang A (4 units). We thought that might be a good segue for me to utilise the same type of approach (and again reference the GSD2020 and prior GSD2019) in analysing the same information for the AGL assets given the huge amount of commentary in the media and other social media outlets.
The main information that I looked at in my article last week was the operating range as shown by the green vertical bars on the first chart on the ‘B’ page of the GSD. These bars represent the upper and lower operating load of the unit for each day of the year (i.e. there are 365 bars side-by-side). I also referred to other parameters that stood out in the GSD which told the story of how these units have been affected by the recent gradual decline of spot prices in the NEM.
In terms of the operating load range for Bayswater and Liddell, both have not noticeably changed over the past two years. I will not include the charts for all 12 units except the examples below for Bayswater 1 and Liddell 4.
The operating range for Bayswater Units in general extended from full availability (660MW) down to approximately 350 MW for all units throughout 2019 and 2020; and for Liddell, the operating range extended from 420 MW down to approximately 270 MW. While Liddell Units have a registered capacity of 500 MW, none of them seem to have been capable of anything more than 420 MW for the last two years. There may be variations of the operating ranges from what I’ve stated above depending on which part of the charts you focus in on, but the main point of the observation is that there doesn’t appear to be a marked improvement to the operating load range or significant decrease in minimum load over the past two years at either Bayswater or Liddell.
We suspect they have lowered the pressure in the boiler at Liddell to prevent tube leaks as part of the operating management regime, thereby limiting it to around 420MW. Whilst this would be a completely normal and typical practise, it would indicate a preservation regime is in place which is understandable given the age of the plant.
Here’s BW01 for calendar 2019 from the GSD2019:

Here’s the same unit (BW01) for calendar 2020 from the follow-on GSD2020:

Here’s LD04 for calendar 2019 from the GSD2019:

Here’s the same unit (LD04) for calendar 2020 from the follow-on GSD2020:

I mentioned that Liddell Units were never available for more than 420 MW, but the flexibility was at times restricted in the lower load range as well, as can be seen for LD01 from April to September 2020 in the chart below. There are a variety of plant issues (e.g. pulverisers, fabric filters or control system related) that could not only limit its maximum capability but also prevent cycling in load.

Looking closer at Liddell
Liddell Units have a lot of outages.
- This is probably well known for anyone regularly watching the NEM.
- In 2019 there were a total of 18 separate outages across the four Units – in 2020 this rose to a total of 28.
Liddell unit 1
The average capacity factor for Liddell 1 in 2020 was 42%, a sharp decline on the year before where it was 59% (green outline).
-
- 59% for Liddell is actually ‘not too bad’ (tone – mild sarcastic),
- it is the best the Unit has achieved in the ten years between 2011 and 2020.
I’m quoting average yearly capacity factor instead of Availability as the GSD doesn’t provide numerical annual availability figures, but no matter, we can still get a picture of performance for the purposes of our discussion. This is the excerpt from the ‘A’ Page for LD01, with a few pieces of information highlighted, and discussed below:

1) For the years between 2011 and 2018 the monthly availability factor (the light pink bars) for most months are quite a bit higher than the monthly capacity factor (dark pink bars), as highlighted in the first red arrow – which suggests that during those years Liddell chose not to make use of all their available capacity (i.e. they were happy to set price rather than take it).
2) The second red arrow points to a lower occurrence of light pink bars representing availability factor dropping more in line with capacity factor (i.e. the unit was struggling to generate what it did through 2019 and 2020).
3) It’s now interesting to look at the price setting table at the bottom of Page ‘A’ for Liddell 1, highlighted by the blue outline. The unit was a regular price setter when the price was between $0/MWh and $150/MWh from 2011 to 2016, but then hardly set price at all the following years bar a few hours at prices less than zero in 20019 and 2020. We can see (in the ‘Volume Bid in Price Bands’ chart above) the change in bidding behaviour that brought that change about.
Liddell unit 2
Liddell 2 average capacity factor for 2020 was 29%, down from 56% in 2019. There were a total of eight unit outages on this unit in 2020, the last one almost 3 months duration which accounts for such a low capacity factor.

Liddell unit 3
Unit 3 average capacity factor also took a drop from the year before, 46% vs 63%, with a total of nine separate unit outages in 2020. The unit was more reliable in 2019, with only three outages.

Observation about Bayswater
What I notice about Bayswater is that they also have multiple outages per Unit per year.
Without the addition of the MT DUID Availability information, it has been difficult to know precisely if this was planned or forced (other than trips).
- I have not spent the time going through rebid reasons, but I suspect most are forced.
- In fact, Unit 3 had three outages, and Unit 4 had four outages in 2020, surely an indicator of reduced reliability over the years.
Another article could be written about average availability over the long term, and would be also be interesting. I know others have already delved into this area (such as Allan O’Neil).
Side thought; we talk about availability, but I once worked in a team that preferred the term ‘Reliability’ rather than ‘Availability’. A measure of Reliability was considered more fitting because a planned overhaul would then not impact reliability statistics. Reliability was only impacted by forced outages like Unit trips and tube leaks etc.
Here’s the ‘B’ Page excerpt for BW03 for calendar 2020:

Looking at Loy Yang A
Moving south into Victoria for the other big units in the AGL fleet – the Loy Yang A operating load range has changed over the last two years. This can be seen by first looking at 2019 daily output chart on the ‘B’ page for LYA1 and comparing with the same chart for 2020.

Unit loads came down to around 400 MW or a little below on average every few days (just eyeballing it), but from about mid-April 2020 these started occurring more frequently below 400 MW and is particularly evident in November and December 2020 where reduced loads were often down to 300 MW.

Now the resolution of the chart in the GSD is on a daily basis and shows only the maximum availability (the black line) on the day rather than any variation through the day. Using the time travel feature in ez2view to look at a 20 day period in April 2019 I’ve been able to see that all the load reductions were also associated with reduced availability, that is, the lower loads were due to plant issues, rather than operational choice:

I checked another 20 day period ending 30 June 2019, and again all reductions in load are driven by reduced plant availability (not illustrated here).
A third 20-day period ending 16 December shows a variety of reductions for different reasons:
- A couple of reduced availability events (green circle)
- Fuel supply failure Volume reductions for coal conservation (Red arrows)
- And Rebids to higher volume with A as the rebid type and citing changes in market conditions in the reasons (yellow arrows)

As mentioned, it was April 2020 that saw more load reductions occurring, and the next 20 day period shown below shows no significant periods of reduced availability, but does show some changes in volume across price bands (Red outlines) and a 20 MW volume (Orange outline) that is bid across all Units at a price band above $90.

This 20 MW looks to be in Loy Yang’s Initial offers and might have been an initial attempt to prevent negative prices in the region with giving up too much volume. The last two red outlined decreases in load result from rebids made responding to market conditions, citing changes to AEMO prices, either in dispatch or pre-dispatch:

The first red outline was a reduction included with the Initial offer for that day. So it appears that from this time onwards, Loy Yang A are responding to and preparing for negative spot prices.
Dealing with negative prices
The table below shows the increasing occurrences of negative Dispatch prices across the NEM over the past three years.

While negative prices are not new to South Australia, they are more common in all regions, although so far New South Wales are still fairly insulated from them (coincidentally, as I was finalising this article, Paul posted this article on ‘the accelerating rise of Negative Prices in the NEM’). It’s certainly of interest.
This last 20 day period from ez2view shows the first 3 weeks in December 2020 for LYA1:

On the days of the 5 and 6 December where negative prices was the spot market outcome in Victoria, LYA1 rebid in response.
- Heavy patches of red in the bid stack is showing volume rebid above $10,000/MWh.
- The first rebid for the 5 December was made the day before at 1343 hrs and is shown below.
- Note the amount of volume bid to above $10,000/MWh.
- This was in expectation of the low prices in pre-dispatch for the 5 December.

Capacity Factors
While looking at the data for this paper I looked at how capacity factors across Liddell, Bayswater and Loy Yang A all compared. The table below shows capacity factors taken directly from the ‘A’ Page of the GSD2020 for each of the Units and plotted in a spreadsheet.
Click on the table to open larger image if numbers are difficult to read
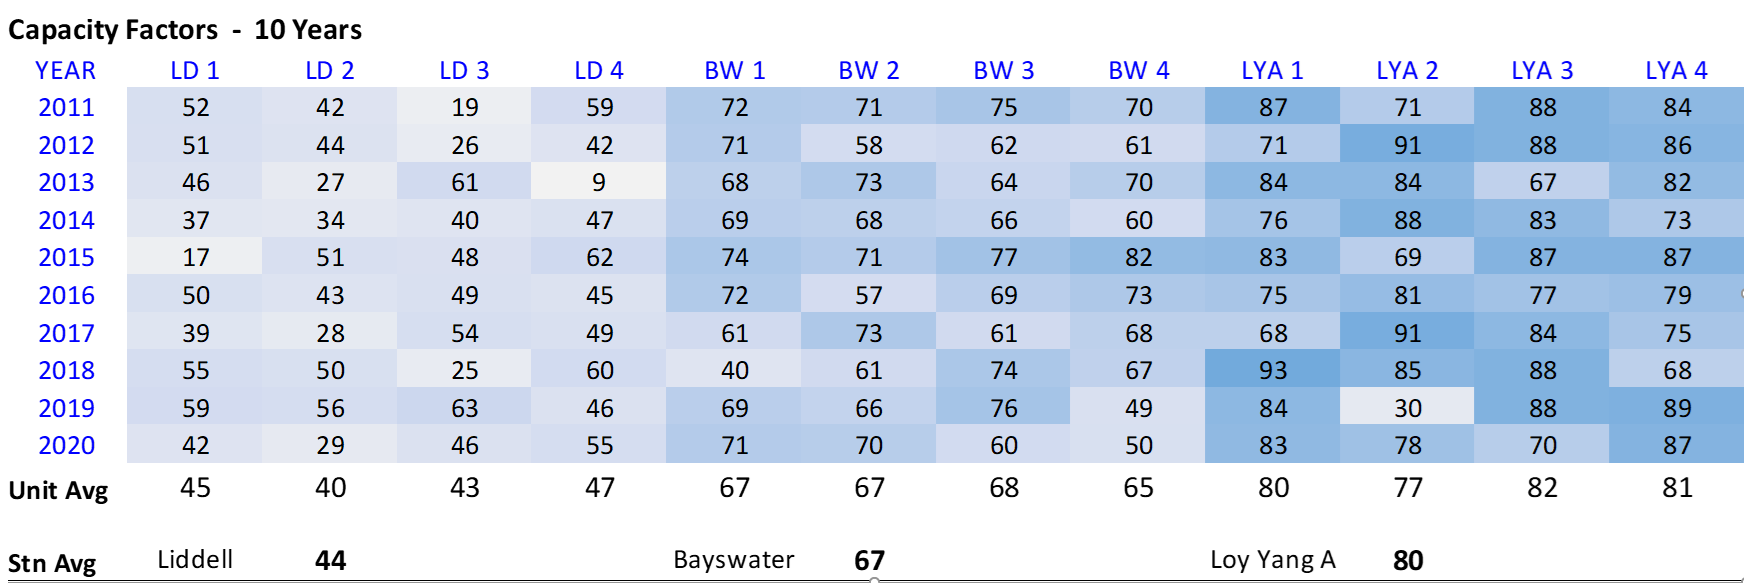
This table shows what we would probably suspect but confirms there is a clear distinction between the three stations, with
- Liddell the least utilised,
- Loy Yang A the most utilised, and
- Bayswater squarely in the middle.
It would be good to tabulate the availability factors as well, but that can be for another day.
I also averaged the Unit capacity factors for each Station across each year and plotted on a chart:

The results are more interesting, with a slight decline over the last 10 years for Bayswater and Loy Yang A, but a trend upwards for Liddell. Maybe there is some life left in Liddell !!
About our Guest Author
|
|
Nick Bartels is a Senior Consultant at Greenview Strategic Consulting.
Greenview Strategic Consulting was formed to provide specialist market advice to energy, government and community organisations in the complex domain of energy and critical infrastructure. You can find Nick on LinkedIn here. |

Leave a comment