As discussed through numerous articles, the price outcomes seen through Q2 2021 were ‘anything but boring’…. (indeed, Carl Daley called them ‘biggest price shock in history’).
Four weeks ago (Mon 16th August) we listed (some of) the factors that contributed to these price outcomes – and then followed up 8 days later with the exploration about how low wind was another significant factor (though perhaps one not discussed as broadly in other forums). Through all of this, though, we’ve not directly discussed what was perhaps the two most significant contributing factors that delivered the price outcomes that we experience through that period.
(A) The shape of prices by time of day
These factors are particularly evident when viewing average prices through the quarter on a time-of-day basis.
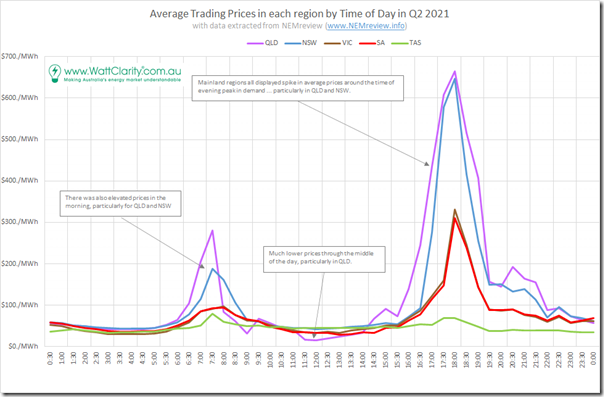
Extracting data from NEMreview, we’ve produced the following summary of trading prices:
Remember that Q2 2021 is before the commencement of Five Minute Settlement, so we need to look at outcomes for 30-minute trading prices.
—
From this we can clearly see:
1) A pronounced spike in prices around the time of winter evening peak in Underlying Demand :
(a) Remembering that May was also colder than in some other years, so the winter shape in demand arrived somewhat earlier than in other years.
(b) These evening price spikes are sometimes a feature of this time of year … but an average up above $600/MWh for QLD and NSW was certainly higher than would normally be expected (due to some of these factors).
2) There’s also a higher average for a couple trading periods in the morning for QLD and NSW
3) Finally, we see a lower price through the middle of the day … particularly QLD in this quarter.
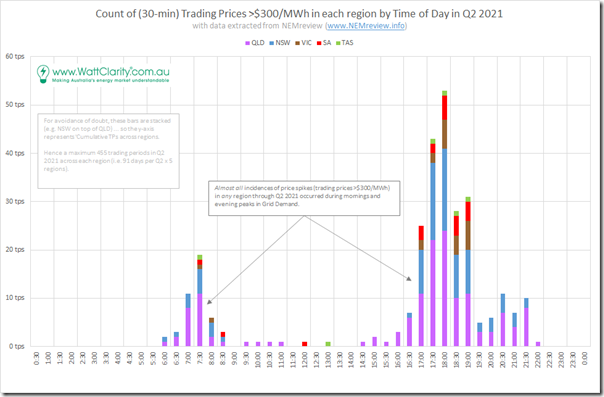
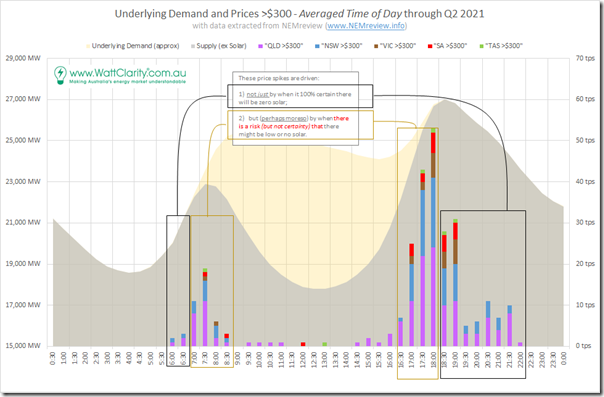
Still looking on a time-of-day basis, we can see the reason for the high prices during evening peak in demand when we count the incidence of prices spiking >$300/MWh:
Readers should note that the bars are stacked in this chart (i.e. incidence for NSW on top of incidence for QLD).
—
Aligned with the higher average for morning and (especially) evening peak in demand is a pronounced incidence of 30-minute trading price outcomes above $300/MWh for those particular half hour periods.
(B) Two significant contributing factors
(B1) Underlying demand
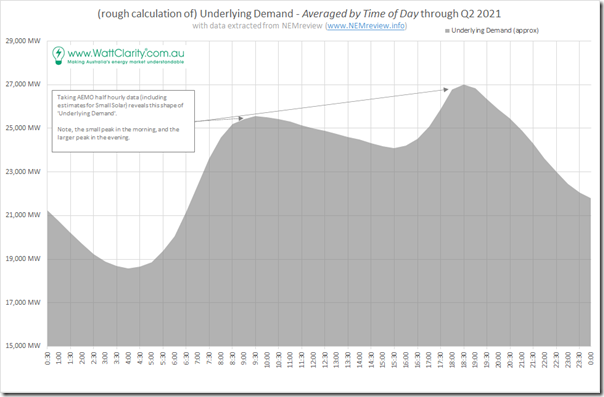
Exploring the ‘two significant factors’ noted above, we start first with this view of an approximation of Underlying Demand – on a NEM-wide basis, and averaged by time of day:
There is a pronounced peak in evening through this period, centred on the half-hour ending 18:30 (NEM time).
1) This is different than the shape of Underlying Demand seen through summer periods.
2) It’s been a reasonably frequent occurrence to see winter prices to be higher at these evening peak times over the past 20+ years of NEM history.
There’s also a smaller peak in Underlying Demand in the morning.
(B2) The shape of solar
What has been increasingly exacerbating the effect of this shape has been the rise, and rise of solar PV … of all three general sizes (Small Solar, Medium Solar and Large Solar).
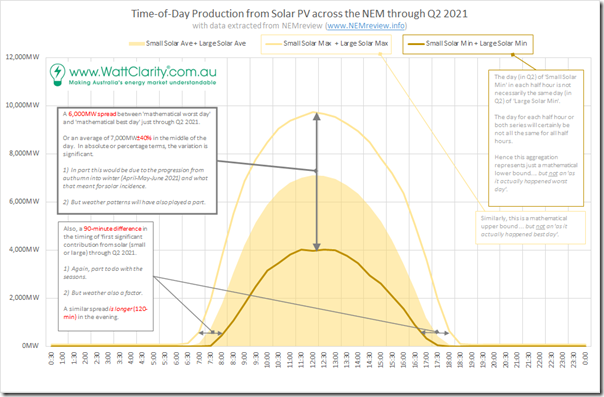
Keeping in mind the invisibility of Medium Solar (and the opacity of Small Solar) the following curve was drawn using AEMO data for Small Solar and Large Solar through Q2 2021 by time of day:
As noted on the chart, the Average shape is an ‘actual’ shape (i.e. as it actually occurred through Q2 2021) but the Maximum and Minimum bounds are more mathematical constructs and not actual ‘as it happened’ results. However they will suffice for illustrating both:
1) The overall shape of production; and
2) The extent of the variability – both in terms of:
(a) Spread of outcomes at peak times (i.e. in the middle of the day); and
(b) Variability of start and end times through the 91-day span of Q2 2021.
It appears to be (as you will see below) that the variability of start and end times is more important in terms of impacting on the price outcomes for Q2 2021.
(B3) The compounding effect
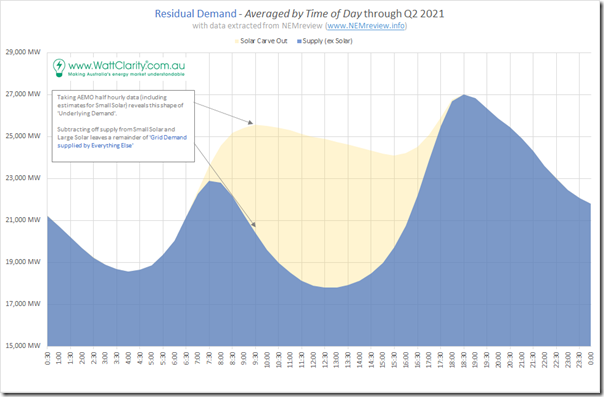
Taking the two effects together, we end up with a resultant shape of supply from ‘everything else but solar’ in the following time of day chart:
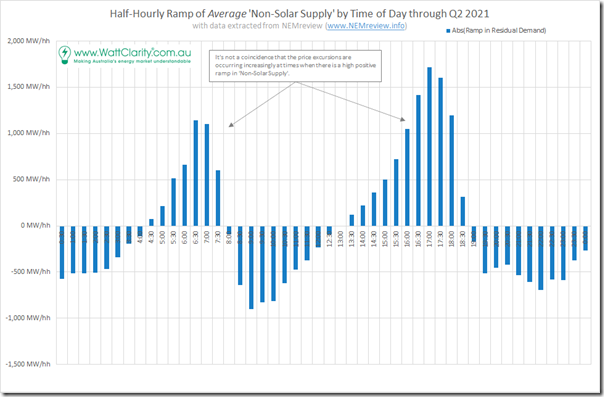
What’s particularly important, here, is to understand the resultant (high) ramp rate required for that ‘non solar’ supply:
It seems like that it’s a combination of both:
1) This ramp in absolute terms, and
2) Some uncertainty surrounding this ramp on a day-to-day basis,
… that has a significant impact on the price outcomes in the market.
(B3a) Pattern of High Prices
Overlaying the stacked distribution of price outcomes on the ‘Residual Demand’ curve above we see the strong correlation:
The challenges inherent in the increased ramp rates required for residual supply are one of a number of lines of enquiry still to be explored as part of the GenInsights21 update for release in another month or two.
(B3a) Pattern of Low Price
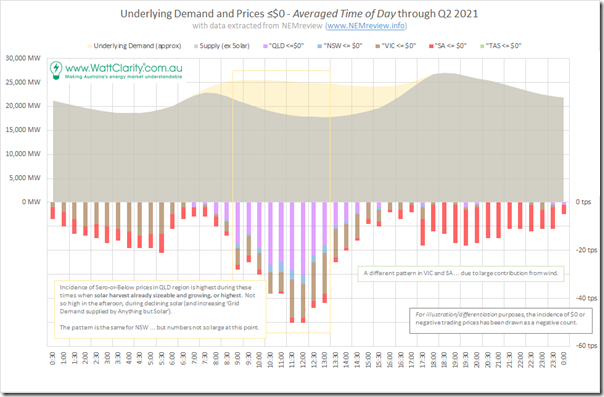
Out of interest, I have replaced the price incidences >$300/MWh with incidences ≤$0/MWh on the same basis:
The higher share of wind generation in VIC and SA delivers a different pattern here (as discussed on other occasions such as here on 17th February 2021 with data to 31st December 2020).
But for QLD, in particular, it is clearly solar dominated, leading to the lower average prices through Q2 2021 in the middle of the day shown in the first chart at the top of this article.
—
No time to comment further on this one.


Be the first to comment on "The volatility seen through Q2 2021 was also a product of timing of solar production"