… in the new world of rising renewables and lower spot prices.
This article is looking at the large thermals particularly in Queensland and South Australia, to see if there are any changes in operating and loading patterns over the last two years.
- I am using the newly released GSD2020, and comparing to the earlier GSD2019.
- I’ve chosen these two regions as these are the ones most affected in recent years by the increasing rise of renewable generation in the form of large solar and wind generation.
- But the NEM price outcomes are also the result of increasing levels of rooftop generation, which (whilst not covered in the GSD) should not be ignored.
I first noticed the Queensland spot prices changing in the middle of the day back in 2019, and have had an interest ever since. Since then prices have regularly gone negative with the right conditions (ie low demand, plenty of generation from the large solar plants on sunny days, as well as rooftop solar, and the usual dispatch of thermal generators including the ones that were once called “base load”).
These large thermals (I call them large thermals, rather than base loaders – and in this terminology I include Coal fired units, Combined Cycle Gas Turbines, or any large fossil fuelled fired generator that typically runs more often than not) usually have a short run marginal price matching or close to their fuel price, and depending on the power station may be between $10/MWh to $50/MWh.
On days when prices are low for hours on end, how do the larger thermals respond given the price their getting for their generation is lower than the cost of generating. Typically, they will reduce output as much as possible to reduce financial losses. Most are not able to switch off because they take some time to start again, as well as being a very costly exercise to do so. Gas turbines are more flexible in this regard, able to stop and start better than a coal fired Unit (by better I mean quicker and with less start-up cost), so in a market environment of sustained lower prices we can expect to see these gas units to cycle before the coal units*.
*Remembering back to when I started in the industry, Swanbank A Units (6 x 68 MW) entered a two cycle operation in the late 1990’s to early 2000’s (where they were synchronised ready for the morning peak at 0700 hrs, and taken off each night at around 2200 hrs). They operated in this way until their decommissioning in 2005.
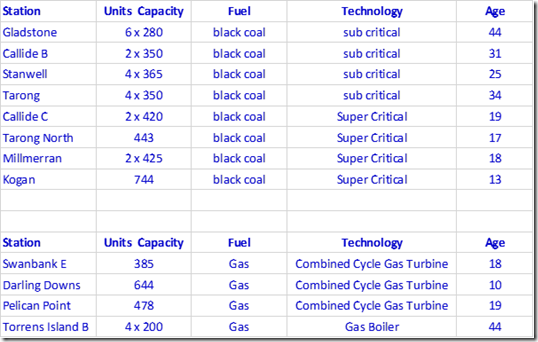
I’ve chosen to look at the following stations which include all the coal fired power stations in Queensland, and the larger gas fired stations in Queensland and South Australia.
Capacity figures quoted are the unit’s Registered Capacity (which can be, for units like these, lower than the Maximum Capacity because of an ability to operate with ‘overload’). This article was originally meant to only look at minimum loads of each of the stations, but I couldn’t help commenting on some other observations.
Stanwell Coal-Fired Power Station
Stanwell station consists of 4 x 350MW units supplied by Hitachi and first commissioned in the 1990’s. These 4 units were the last of a set of 10 units supplied by Hitachi to the Queensland Electricity Commission beginning the early 1980’s with Tarong Station (4 units – of which two discussed below) and then Callide B (2 units – see more below) in a ‘bulk purchase discount’ type of arrangement – both in terms of fees paid to Hitachi, but also collective learning making operations costs lower.
I’ve selected three of the four units below:
Stanwell Unit 1
In the first of 2019 Stanwell 1 minimum load was just over 200 MW. There appears to be attempt to occasionally test lower limits in March, April and May before a planned outage during July and August, but given the Max available also dropped briefly in April suggests there were plant issues on the unit, and the lower load was not planned. The red rectangle shows post overhaul commissioning activities. But after these were completed it appears the Unit explores lower loads just under 200 MW and even down to 100 MW in December 2019 with no decrease in Maximum Availability.
Throughout 2020 there are numerous occasions where the unit loads to 100 MW although for some of these periods there was decreased Availability, but on many other occasions there weren’t.
Stanwell Unit 2
Through 2020, Stanwell Unit 2 has loading down to lower loads more than in 2019.
Here we can see a change from June 2020 where minimum load changes from 180 MW down to 100 MW.
Stanwell Unit 3
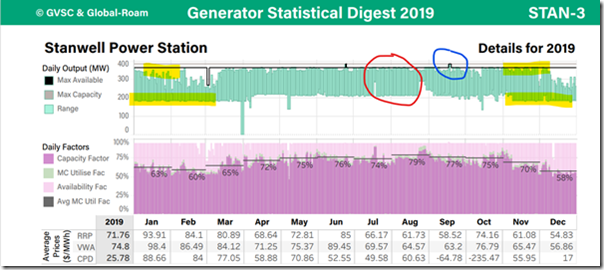
Stanwell 3 is similar to the other Stanwell Units where it has a broad range of loading capability from 200 MW up to the maximum available which on these units is 365 MW (red circle); as opposed to 350 MW on Tarong and Callide Units. However, there were some months that the upper load range wasn’t fully utilised, these were in January, February and December, but almost every day of the year the lower load of 200 MW was utilised.
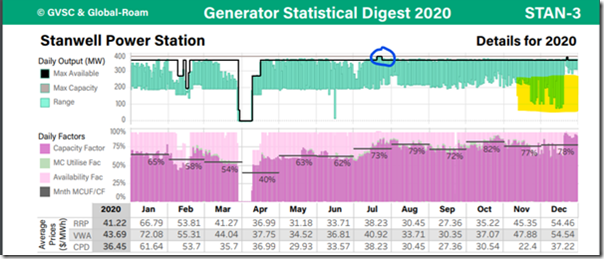
Another thing that is noted in this slide (blue circle) is occasional excursions above Registered Capacity (at 365MW) up to Maximum Capacity (at 385MW) for the unit.
For most of 2020 the load range doesn’t change too much until November where the lower load range drops further to 100 MW, and then even lower in December. This is significant in that this is below the original design for these units which is 140 MW. What’s also significant is that the upper load is still 365 MW, although I’m certain that this new change in load range involves a fairly significant change to operations, both plant and personnel.
Darling Downs CCGT
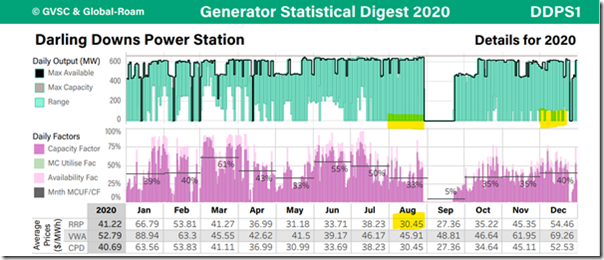
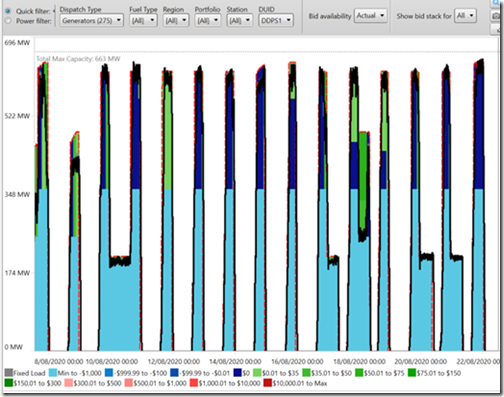
Darling Downs CCGT in recent years has regularly cycled down to 0MW on a daily basis such as in August 2020 (just before its Outage in September).
This cycling for 600+MW thermal unit is unusual and in contrast to how Pelican Point in South Australia operates – we wouldn’t expect to see this kind of operation if prices were above a thermal generators SRMC:
But as the screen shot from the GSD2020 shows, In August the Average RRP was $30.45/MWh, one of the lower months in the year (however Darling Downs managed a VWA Price of $45.91/MWh by choosing the higher priced times of the day to generate).
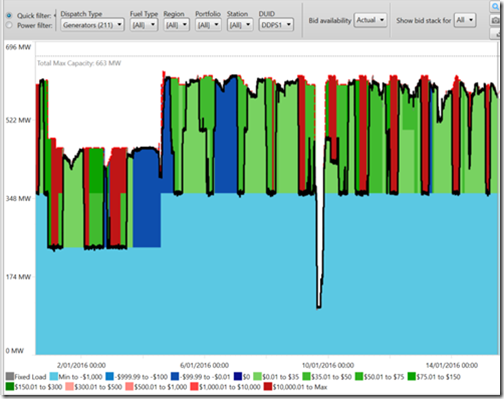
The bid stack below shows Darling Downs running profile capture from ez2view for a two week period back in January 2016 (i.e. several years beforehand) where it would typically stay on line for weeks at a time (ie no cycling). But back then daytime prices were positive through the day:
Below is another screen shot capture of the bid stack in August 2020, now showing daily cycling of Darling Downs CCGT:
By now daytime spot prices are often negative, and the cycling is to avoid those times when its uneconomic to dispatch.
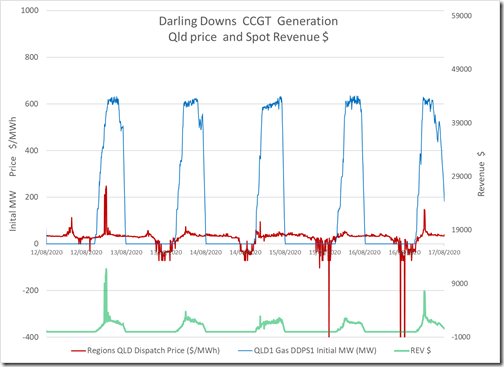
Another plot of Initial MW and dispatch price during a five day period in August 2020 shows how Darling Downs avoids the lower priced (negative) periods, which are now in the middle of the day rather than overnight. Instead, the unit starts in mid to late afternoon and runs until around midnight thereby achieving the best possible revenue and $VWA Price. This is essentially two shifting a station that is designed for running 24×7 (or base load using old terminology).
Swanbank E (gas-fired) CCGT
Swanbank E (now operated by CleanCo) ran continuously over the first 3 months of the 2020 year.
- January to March of each year is termed the first quarter and is normally where most generators aim to be available to generate.
- The reason for this is the weather is hot, electricity demand is high, spot prices are normally high, and financial hedge positions are high.
- Summer 2019-20 featured many high demand and high priced periods.
During the first quarter we see that Swanbank E daily load variations ranged from 120 MW up to its maximum availability of 360 MW. The focus here is its minimum load.
After March 2019 the unit remained out of service for most of the year bar some brief appearances in May and June, and then in December (image from GSD2019 for Swanbank E not shown here). But in 2020 Swanbank E generates a lot more than it did in 2019 achieving a Capacity factor of 41% across the year as opposed to 19% in 2019.
From March 2020 onwards minimum load levels are down to 95 MW, a distinct change from January and February where minimum loads were up around 140 MW. For the rest of the year the unit regularly achieves minimum loads down to 95 MW.
Callide B Coal-Fired Power Station
The Callide B units were commissioned in between Tarong A and Stanwell.
Callide B Unit 1
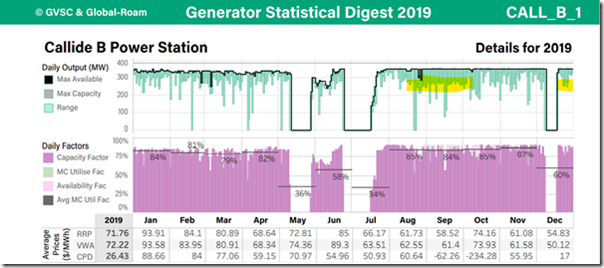
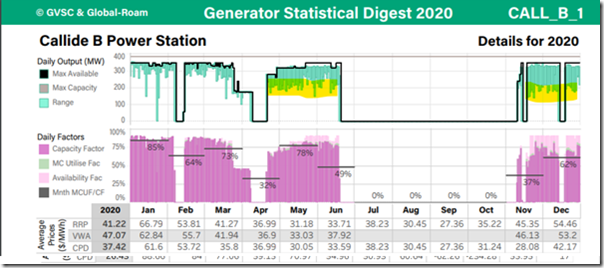
Callide B1 maintained fairly high Capacity Factors during 2019, consistently in the mid eighties from August to November, and while minimum loads varied somewhat it was generally around 250 MW.
In 2020 we notice that minimum loads are often below 200 MW:
Also, of interest is the VWA Price being very close to the average RRP each month, and even less in some cases, ie Feb, Jul and Dec. This suggests the unit generating at low prices a good proportion of the time.
Callide B Unit 2
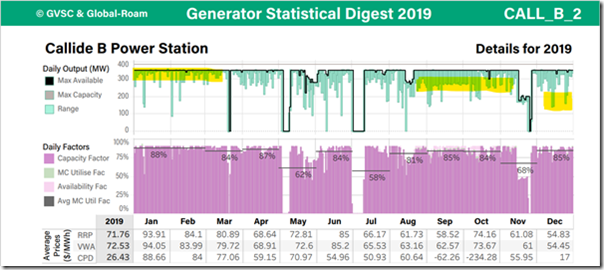
Callide B2 showed little variation in load range at the start of 2019 (looking back this is the case with Unit 1 as well), staying above 300 MW most of the time. Throughout the year there are the occasional drop to 200 MW or less, but these are not consistent nor have a regular pattern, and at times are accompanied with reduced maximum availability which suggest plant issues for the lower loads. Later in the year from September a regular pattern emerges of loading to 250 MW as did Unit 1 at the time.
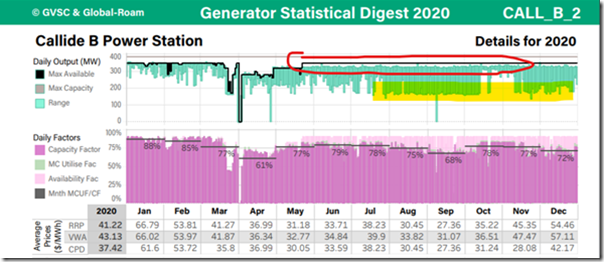
In 2020 from June the unit is often loading below 200 MW, but upper load range is less than the maximum available which could suggest they are achieving the lower minimum loads by reducing the number of pulverisers (i.e. mills) that are in service.
Tarong Coal-Fired Power Station
I’ve selected two of the four coal units at Tarong:
Tarong Unit 1
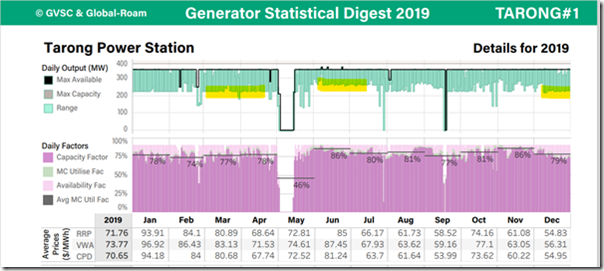
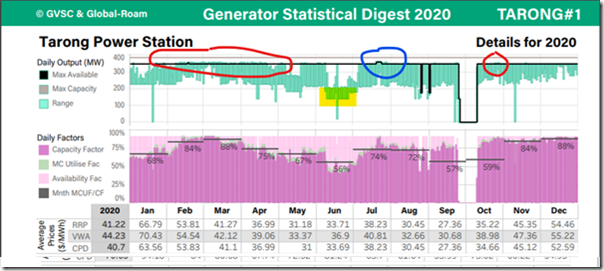
Tarong operating range in 2019 was from 220 to 350 MW, and although at times the lower range was higher as seen in during June and July, for the most part it seems the unit was comfortable loading down to 220 MW:
In 2020 the upper range exceeded the maximum available (red circle) such as in February to April, and in July bid the maximum available to match (blue circle).
In June it can be seen the lower operating range reduced to 140 MW, although during this time the upper range was only around 200 MW (yellow highlight).
Tarong 3
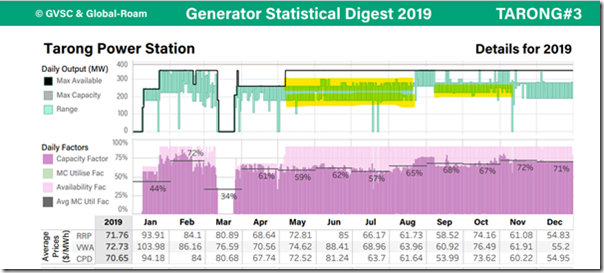
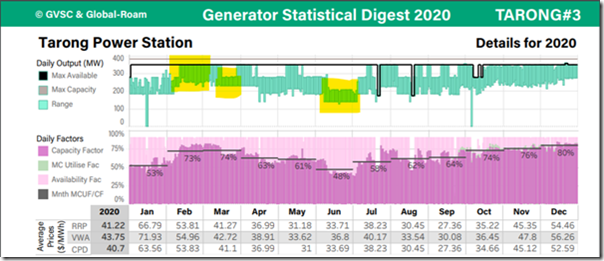
Tarong 3 shows a narrower operating band when compared with other Units at Stanwell and Callide) of between 180 and 260 MW between May and mid August and an even narrower band in September and October. I’ve not investigated further, and wonder if there were plant issues that made it difficult to operate outside this range?
In any case, in 2020 there doesn’t seem much difference in its range.
Tarong North (coal-fired) power station
Tarong North is a single unit station (like Kogan Creek), but is on the site next door to the four unit Tarong power Station. It has a super-critical boiler meaning it operates at higher temperatures and pressures than does a sub-critical unit, which should translate into greater thermal efficiencies based on thermodynamics (hence lower emissions, as well).
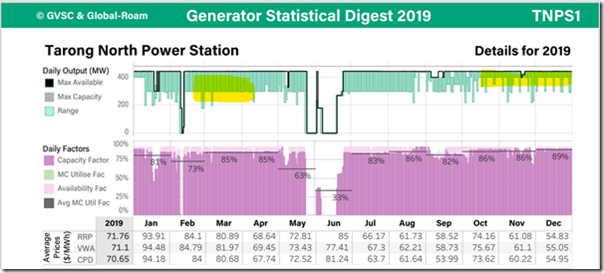
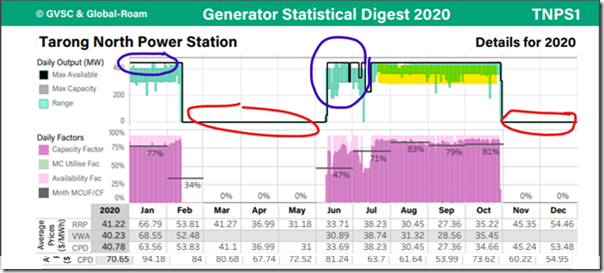
Looking at its operating range for 2019 it operated mostly between 300 MW and its maximum availability of 443 MW, although later in the year this band seemed to reduce quite markedly to between 400 and 443 MW. Apart from three full unit outages in 2019, there weren’t many occasions that it operated at reduced capacity. That is there were six occasions that its maximum availability was less than 443 MW.
Apart from the obvious length of the full unit outages in 2020 (which seem too long for them to be regular planned outages (overhauls), and therefore assume they are likely to be forced outages), the remaining parts of the year reveal not much difference in Tarong North’s operating range in that its minimum did not consistently go much lower than 300 MW.
There was a short period that it went down to 200 MW in June after it was returned from its first outage but at the same time it did not reach maximum availability either. Also note that in January it did not reach maximum availability too often either. From mid July until the start of the second full unit outage, the range of unit loading was narrowed again so that on most days the minimum load was only 360 MW.
Not a very flexible unit in these times of reduced prices with increasing renewables.
Kogan Creek (coal-fired) power station
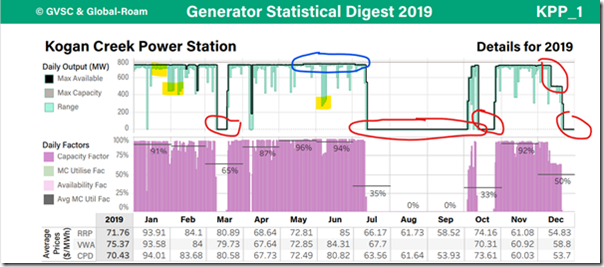
Comparing the results for sample supercritical (Tarong North and Kogan Creek) with the subcritical units (Tarong, Callide B and Stanwell) it seems to me that single unit stations are less reliable. Exploring this could be an article all on its own and is based on looking at Tarong North with the amount of time it spent out of service in 2020, and Kogan in 2019 which had four unit outages during the year:
Kogan Creek is the last coal fired power station built in the NEM, is also the largest at 750 MW and has a super-critical boiler for increased efficiency. It is the last of the “baseloaders”, the units designed to run 24×7, so it would be expected to stay on line until its planned overhaul every four years (or whatever it is).
Given that its fuel cost is fairly low (looking at its bid band of $13.80/MWh) does not have a daily pattern of reducing to any consistent level of minimum load. There are certainly many times it does reduce to around 400 MW or even less, but only does for a couple of days, so I assume these are predominantly for plant reasons.
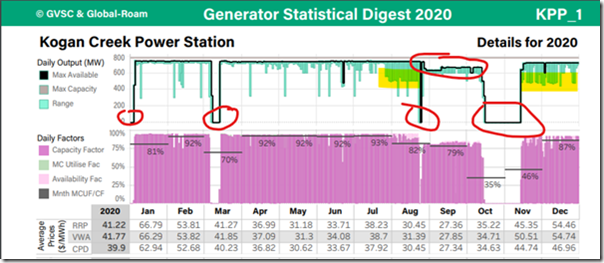
In 2020 there are another three unit outages, although the third could be a planned outage, whether it is or not it probably needed to come off anyway to fix the reason for the reduced availability which plagued it the previous 2 months. But interestingly there appears to be an attempt to make consistent use of minimum load on a daily basis down to 500 MW, highlighted in yellow.
Pelican Point (gas-fired) CCGT
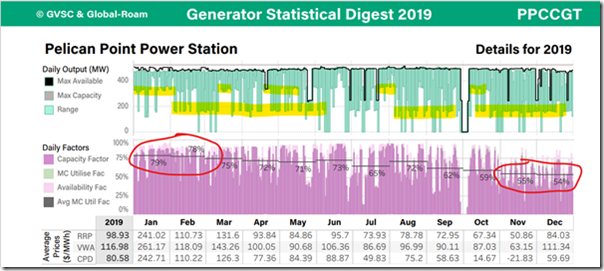
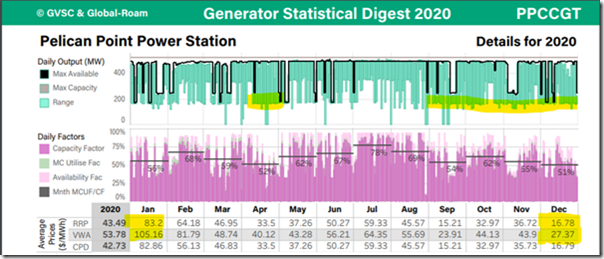
Pelican point at 478 MW, being a large Combined Cycle Gas Turbine has the combination of thermal efficiency as well as flexibility, flexibility more than a coal fired unit that is.
This can be seen with two stages of minimum load available, the first down to 350 MW and the second down to 170 MW. In percentage terms these loads are 73% and 36 % of its registered capacity. Most coal generators traditionally would struggle at 36% capacity factor, even though some such as Stanwell appear to be aiming for it.
The flexibility of Pelican Point is no doubt due to it having more than one open cycle GT as well as the steam turbine. It also is fairly reliable having come off line for more than a day only once in 2019, and not at all in 2020. But back to minimum loads. With the flexibility of being able to load down to 37 % (170 MW) it seems to pay off with its VWA Price being consistently higher than the Average RRP, particularly in in January and December of 2020 (yellow highlight), which can’t be said for the Coal Units discussed above.
About our Guest Author
|
|
Nick Bartels is a Senior Consultant at Greenview Strategic Consulting.
Greenview Strategic Consulting was formed to provide specialist market advice to energy, government and community organisations in the complex domain of energy and critical infrastructure. You can find Nick on LinkedIn here. |






Leave a comment