About 4 weeks ago we noted (on the day) that the ‘AEMO releases 2025 ESOO on Thursday 21st August 2025’. Now, long-term readers of WattClarity (at least those with good memories) will recall that:
- About four years ago (as Key Observation 8/22 within GenInsights21) we asked ‘what is the purpose of the ESOO?’
- accessible to those who purchased that report;
- with the intention that be a constructive (thought-provoking) question.
- And then shared the text of ‘Observation 8/22 from GenInsights21–what is the purpose of the ESOO (Electricity Statement of Opportunities)?’ with our readers here here on 12th April 2022
In the ~4 years since we posed that question, (my sense is that) we’re no closer to really resolving the answer – including having stakeholders of the NEM collectively having the same shared understanding of the answer.
The way the ESOO is pitched, produced and delivered sure has changed a lot over 25 years (especially so in the past 5 years or so), and it’s worth reflecting on this.
1) For instance, the ~4 weeks since the delivery of the 2025 ESOO has given us cause to reflect on what Dan Lee wrote about a year ago in the article ‘What the last twenty years of the ESOO tells us about blackout predictions’.
2) This is one of many things we’ve been doing in the 3 weeks since the delivery of the 2025 ESOO – as a result of which we thought it might be useful to publish this article.
3) By now Linton Corbet will be enjoying some European holiday adventures, but I’d especially like to thank him for his contributions to this article:
(a) based on an update of work initially completed for GenInsights Quarterly Updates.
(b) so this article features work that might have been included in a GenInsights Quarterly Updates report for 2025 Q3, for instance.
(c) and I’m sure it will feature in the up-coming NEMdev 2025 conference.
One final introductory note of caution, before we launch into some scenarios – readers should keep in mind the 3 Flaws I wrote about 9 years ago in ‘Forecasting is a Mug’s Game’
4 different dimensions (for many different lenses)
As some background to a the illustrations of each of the 6 different lenses below, I thought it would be useful to firstly highlight some of the key dimensions that readers of the ESOO should at least be aware about in reading through the 2025 ESOO and reflecting on all that’s changed over the years (and particularly the past 5-10 years):
Dimension #1 – are we just talking ENERGY?
Let’s firstly start at the start, by considering from a top-down perspective the different types of services required to deliver a functioning electricity market/grid.
| Energy | Essential System Services … which is seen as out of scope in the ESOO (but is that commonly understood?) |
|---|---|
|
Back when NEMMCO first started publishing the ESOO, the question ‘is the ESOO just talking about ENERGY?’ was pretty much a moot question … as all of generation sources that supplied ENERGY also supplied what we’ve called ‘Keeping the Lights on Services’ at the same time. — But that’s now increasingly not the case… In the GRC2018 we spoke about an emerging schism between two different types of services:
As Key Observation 2/22 within GenInsights21 we wrote that ‘The schism seems permanent!’., including more discussion in that report about what we saw the implications of this to be. — Whilst it’s understandable (when viewed a certain way) that the approach taken in the ESOO has not so much changed as the energy sector has changed – I can also understand a perspective whereby it’s a major lost opportunity. Furthermore, it’s worth reflecting on emerging changes in terminology:
|
On p10/11 of the ESOO2025, AEMO wrote: ‘A reliable power system requires more than just sufficient levels of installed capacity and available energy supplies. The system must also maintain an underlying set of security and stability services to ensure that it remains both stable and resilient under normal operating conditions, and following disturbances. Over the coming decade, the rapid energy transition will result in a significant need for new assets and providers of these essential system services, including for system strength (both fault current and voltage waveform stability), frequency management, voltage control, ramping capability, and system restart services. Key drivers of emerging system security requirements include: … but the AEMO essentially notes that these considerations are out-of-scope for the ESOO process…. for instance there is a little more discussion on p79, which then notes: ‘Starting in 2025, the three system security reports will be combined with the Transition Plan for System Security. This combined report will provide a holistic overview of power system security challenges, key transition points, and actions underway to ensure the power system remains secure and reliable throughout the energy transition.’ My concern is that the AEMO will publish these reports, but they won’t draw anywhere near as much attention as the ESOO historically does – so the simplistic reader just skimming the ESOO (and/or media coverage of it) will gain a very simplified message about:
In other words, readers might skip to the colourful charts in the ESOO and miss a large part of the picture! |
So let’s accept for now (but not forget) the first simplifying assumption is made in the ESOO to ‘just’ focus on ENERGY.
Dimension #2 – assuming so, are we just talking MWh or MW?
Focusing just on ENERGY, then, let’s peel the onion a little further, and (remembering this little refresher on the difference between a MW and a MWh) continue to drill in for more detail …
| MW & MWh | MW | MWh |
|---|---|---|
|
Worth flagging two different potential approaches to modelling: Approach #1 = Probabilistic If one was going to model both (i.e. Energy and Capacity) through probabilistic approaches, then one would need to ensure that they were running enough simulations to reflect the overlapping variabilities of different variables: 1) It used to be the case that 100 Monte-Carlo runs would generally be enough to reflect the (lower at the time) forced outage rates for ‘baseload’ units … so perhaps we’d need more runs now, to see the impact of multiple coincident outages 2) In addition with increasing weather dependency, we’d need to layer in ~100 weather scenarios to realistically reflect the range of possible outcomes (that’s what we uncovered in Appendix 27, with respect to wind harvest patterns– the 16 different weather years we reviewed was not enough for a full range). Assuming just these variables, that’s 100 x 100 = 10,000 simulations. In this approach, the simulations might solve for both Energy and Capacity.
|
Approach #2 = Deterministic A simpler approach would be to apply a deterministic lens – which (whilst not as detailed as a comprehensive probabilistic modelling approach) offers value as some ‘back of (large) envelope’ sanity checks of much larger models. In this approach, the approach (such as taken in this article) might be to look just at Firming Capacity. Through the GRC2018 and into GenInsights21 we implemented an approach of trending patterns of ‘Aggregate Scheduled Target’ as a high-level metric to explore and explain the ongoing need for firming capacity. With respect to this analysis:
From this analysis came articles:
Thirteen months have passed since that second article, which brings us to this article here today (as essentially the third in the series)
|
The implicit assumption in the current energy transition pathway is that:
|
Whilst the ESOO adopts a probabilistic approach to its modelling, in this article we’re ‘just’ looking at installed base of Firming Capacity.
Dimension #3 – How full (or rose-coloured) are your glasses?
With that in mind, worth highlighting that (in the 6 lenses below) we present 3 distinctly different frames of reference for how the AEMO has described potential entries and exists of Firming Capacity.
All 3 frames of reference are (somewhat) plausible … with different readers here (and of the ESOO) probably having quite different views of what’s ‘most likely’ to occur.
1) useful to keep in mind, in the light of comments by these two respected Analysts at CEC’s QCES coincidentally yesterday.
2) and useful to also recall how (in Dan’s article) we have explored the ‘switcharoo’ approach taken by AEMO in listing and preferencing their scenarios in the ESOO.
The point of this article is not to highlight which one is ‘most likely’ … but moreso to emphasise that there are very different scenarios that could conceivably unfold over the coming 10 years.
| Pessimistic | Base Case | Optimistic |
|---|---|---|
|
What we’ve labelled ‘pessimistic’ (and might be seen in a similar light by many stakeholders of this energy transition) is probably closest to the way that the modelling in the ESOO used to be done … perhaps 5-10 years ago. Specifically, in these scenarios the assumption is that only those plant actually deemed to be ‘Committed’ were firm prospects to be delivered. |
In contrast, what AEMO now labels as a ‘Base Case’ also includes a large number of projects that are labelled ‘Anticipated’, with two key differentiators:
|
At the other end of the spectrum are two permutations of a scenario that includes a fair bit of blue sky thinking – including ‘Actionable’ projects. |
Dimension #4 – Slipping over with respect to SIPS?
Finally, let’s speak about what assumptions should be made with respect to projects contracted to supply SIPS … and partly funded on that basis.
| No special consideration of units contracted for SIPS | Special (or correct?) consideration of SIPS de-ratings |
|---|---|
|
It’s worth flagging special consideration that we need to consider the special circumstances of projects supported by some SIPS arrangement. |
About a month after the events of 13th February 2024, we wrote ‘A focused look at operations at Victoria Big Battery (VBB) on Tuesday 13th February 2024’ in order to show that the capacity dispatched from VBB even during a period of load shedding in Victoria was that not contracted for SIPS.
Note that I have not delved deep enough to understand what the assumptions are of the availability of such projects in the probabilistic modelling supporting the ESOO. In this deterministic analysis included here, we show two different permutations of the 3 different ‘glass colours’ to highlight the impact of this necessary de-rating. |
A general framework for viewing 6 lenses
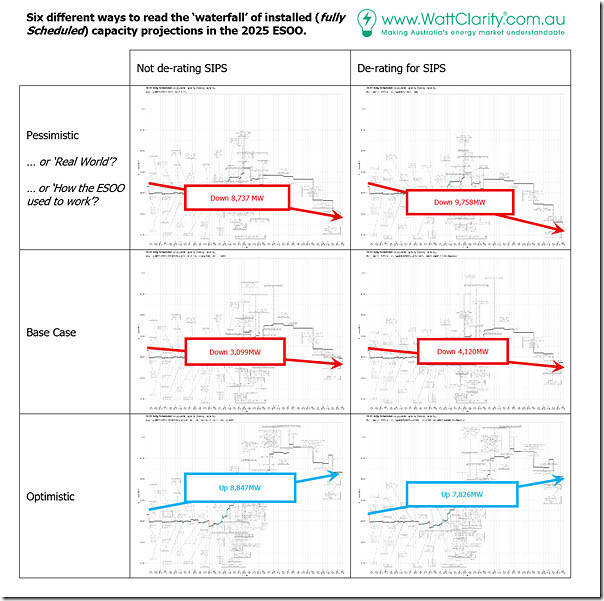
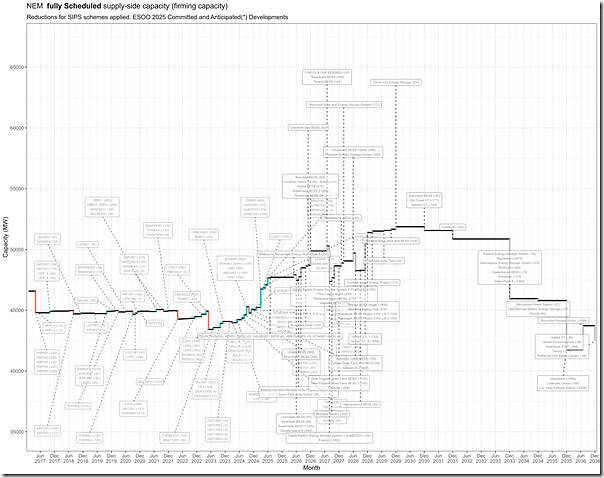
In the following image, we’ve summed up all 6 x ‘capacity waterfall’ charts – making it easier for readers to compare and contrast between the different scenarios
From top to bottom, we see that it’s only in the 2 x Optimistic Scenarios that there is a growth in the installed base of Firming Capacity out to 2035.
Unpacking each of the 6 lenses
Now we’ll unpack each of these as follows – starting on the Optimistic Front (i.e. reading from the bottom up):
Optimistic (and also not limiting BESS capacity by SIPS derating)
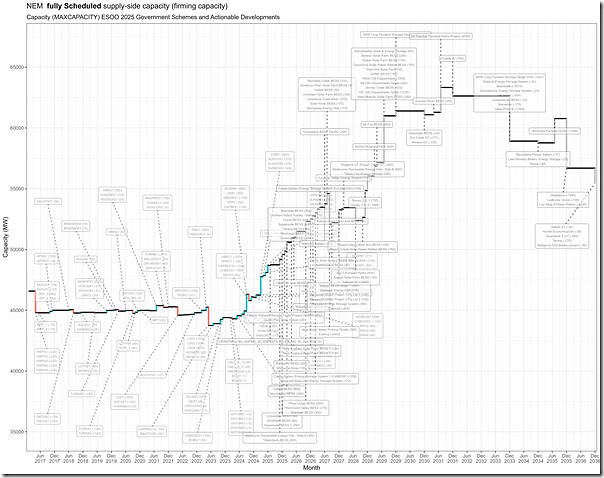
Most optimistic of the lot is this scenario:
Click on the image to open a larger-size image in a separate tab.
As noted in the summary above, the headline here is that:
1) In this scenario, the installed capacity base of fully Scheduled capacity grows by 8,847MW by 2035 – even accounting for slated coal unit closures by this time.
2)But there’s an awful lot that needs to go right for this to be the outcome!
3) That’s why, accompanying the 2025 ESOO, Daniel Westerman (CEO) noted here on LinkedIn:
‘If these planned investments are delivered on time and in full, reliability can be managed within the standard for the 10-year outlook’
… though I wonder how many readers reflected the probability of such outcomes all occurring?
Optimistic (but limiting BESS capacity by SIPS derating)
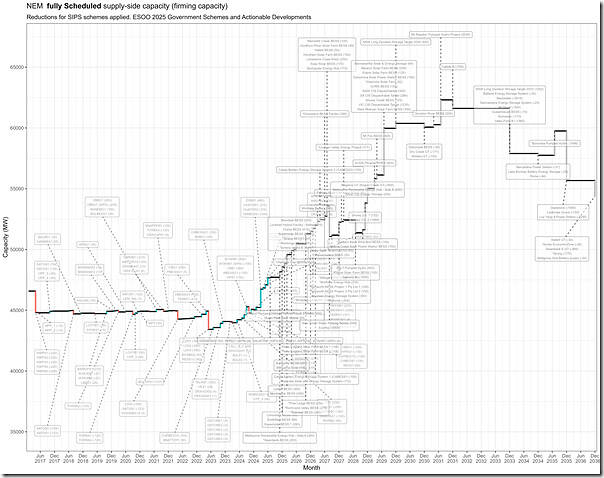
Most optimistic of the lot is this scenario:
Click on the image to open a larger-size image in a separate tab.
As noted in the summary above, the headline here is that:
1) In this scenario, the installed capacity base of fully Scheduled capacity grows by 7,826MW by 2035 – again, accounting for slated coal unit closures by this time.
2) My sense is that there’s a fair bit of blue sky thinking here….
BASE CASE (not limiting BESS capacity by SIPS derating)
Next down the chain is what’s essentially labelled as the ‘Base Case’ … with this permutation shown here not including any de-rating for SIPS):
Click on the image to open a larger-size image in a separate tab.
As noted in the summary above, the headline here is that:
1) In this scenario, the installed capacity base of fully Scheduled capacity falls by 3,099MW by 2035 – assuming that the slated coal unit closures occur as currently slated (though this would obviously be questioned).
2) So a signal that (if we assume the coal units will close as per the current schedule) more capacity would need to become Committed and delivered before the retirement dates.
BASE CASE (and limiting BESS capacity by SIPS derating)
In this case we take the above, but also add in de-rating for SIPS:
Click on the image to open a larger-size image in a separate tab.
As noted in the summary above, the headline here is that:
1) In this scenario, the installed capacity base of fully Scheduled capacity falls by 4,120 by 2035 – assuming that the slated coal unit closures occur as currently slated (though this would obviously be questioned).
2) So shows even more needing to be done before coal can successfully be closed.
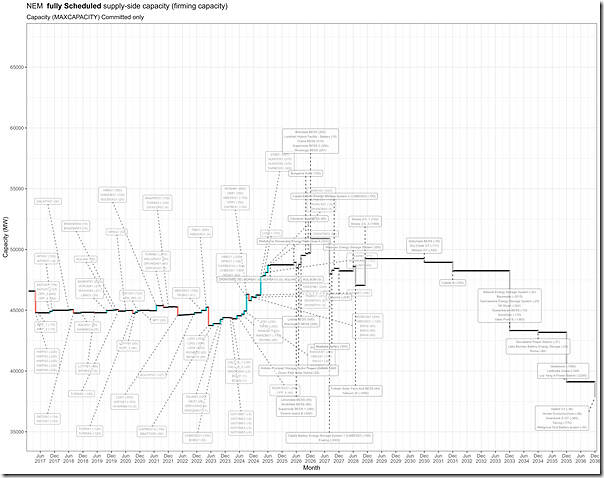
PESSIMISTIC CASE (not limiting BESS capacity by SIPS derating)
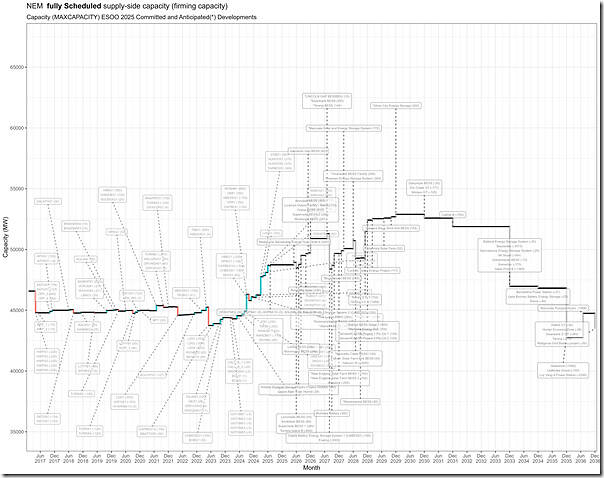
Whilst we have labelled this ‘pessimistic’, others might think of this as ‘more real world’ … or, for the historians around, more like how the ESOO modelling used to be presented. In the first step we assume the full complement of Installed Capacity from BESS signed up for the SIPS (i.e. simplifying – but not, from a deterministic point of view, all that useful):
Click on the image to open a larger-size image in a separate tab.
As noted in the summary above, the headline here is that:
1) In this scenario, the installed capacity base of fully Scheduled capacity falls by 8,737MW by 2035 – assuming that the slated coal unit closures occur as currently slated (though clearly this would not be allowed to happen).
2) That’s a pretty massive gap.
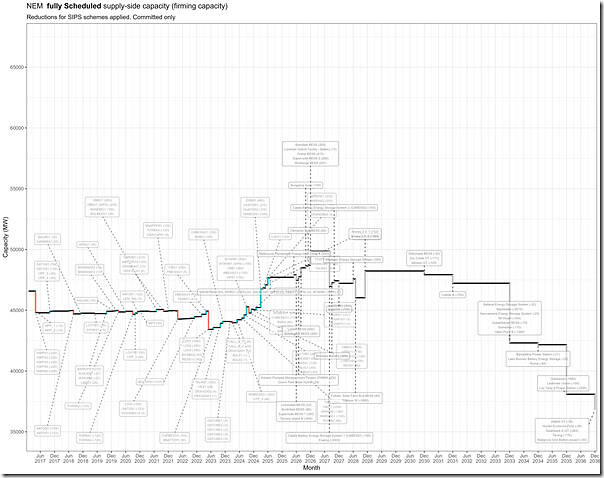
PESSIMISTIC CASE (and limiting BESS capacity by SIPS derating)
Most pessimistic in these 6 x lenses is this scenario – which takes the above and then further de-rates the SIPS-committed batteries by their SIPS commitments:
Click on the image to open a larger-size image in a separate tab.
As noted in the summary above, the headline here is that:
1) In this scenario, the installed capacity base of fully Scheduled capacity falls by 9,758MW by 2035 – assuming that the slated coal unit closures occur as currently slated (though clearly this would not be allowed to happen).
2) That’s almost 10GW over the next 10 years.
Discussion at NEMdev 2025?
I expect I won’t be the only person talking about the extreme variation in these types of views within the upcoming NEMdev conference, which is now ~3 weeks away:


Great remarks Paul, and really supporting the view that 2033-35 is where the rubber really hits the road with coal retirements. Not only is that where capacity is forecast to fall off a cliff, but those retirements are also technical retirements as much (more so?) as economic retirements: Bayswater, Vales Point, Gladstone (if still active?), Callide B (if the extension sticks), and Tarong will all be climbing the far end of the bathtub curve around that time and there’s very little public information to be had on what the options look like for delaying that.
I think it’s underappreciated how different the technical EOL aspect is from the discretionary, policy-driven pre-EOL economic retirement discussion that has captured attention, and I also wonder how well QLD and NSW are doing at recognising that a retirement wave hitting both states near-simultaneously may limit the ability to rely on imports to solve local capacity problems.