Most readers will remember that Tuesday 13th February 2024 saw a ‘Major Power System Event’ occur in Victoria, triggered by some wild weather that included (bushfires leading to the unexpected shutdown of a large wind farm as a preamble before) strong winds destroyed 6 transmission towers (prompting some questions and), leading to some significant load shedding.
Already we have identified dozens of questions and observations that we would like to have time to delve into – including:
1) There were 27 Observations/Questions in the article ‘A quick first pass through ENERGY bids (for Victorian units) on Tuesday 13th Feb 2024’ on 17th February.
2) There were also 28 x Observation/Questions in the article ‘From the 4-second SCADA data, a view of Production by Fuel Type on Tuesday 13th February 2024’, published on 18th February.
3) Plus there have been others occur to us in other ways as well … including via suggestions from readers.
A small number of these have been explored further in subsequent articles.
Whilst we obviously can’t hope to delve into all of these questions, we do hope to tick a few more off the list – in this article I’ll focus on the Victoria Big Battery, which was:
1) One of the batteries that were the subject of Observations/Question #24 & 25 in the review of bids article published 17th February; and also
2) The particular focus of Observation/Question #15 in the review of 4-second SCADA data published 18th February.
3) Plus also the subject of several questions from different clients/readers.
Victoria Big Battery in the 4-second data
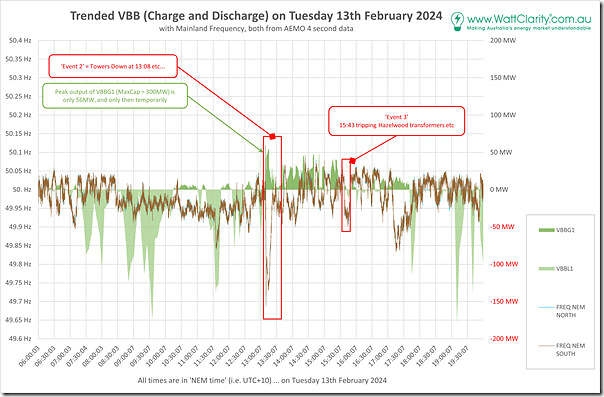
Stripping away all the other battery units, here’s a view of both sides of the battery (with consumption to charge the BESS shown under the line) and with the frequency chart set with 50Hz as the equivalent zero line:
remember with all of these images to click on the image to open a larger view in another browser window
Doing this helps to visually line up which direction the battery was flowing over this 14-hour period when the frequency was above or below 50Hz. As noted in the review of bids article published 17th February and the earlier the review of 4-second SCADA data published 18th February, the peak discharge from the battery over the period was ‘just’ a little larger than 50MW …
… which is noticeably below the Maximum Capacity of the unit (at 300MW on the discharge side).
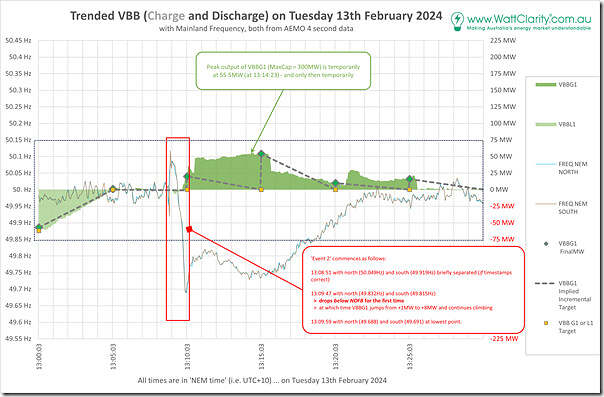
I was particularly interested in the period immediately surrounding Event #2 at ~13:08 (NEM time) on the day, so zoomed into a 30-minute window from 13:00 to 13:30 using the SCADA timestamps as the guide (but remembering the caveat that they might be a little out, due to being timestamped at the receiving end at the AEMO):
The benefit of zooming into this particular period, we can see that there’s a clear difference between immediately before and immediately after the 13:08 time point when the transmission lines are reported to have failed:
1) Immediately before (i.e. in the 13:05 dispatch interval … and also much of the 13:10 dispatch interval):
(a) the input profile for declining charging through until 13:05 neatly follows the implied trajectory from InitialMW to Target in that 5 minute period; and
(b) In the 13:10 dispatch interval (at least up until 13:09:SS) the unit stays neutral – neither charging or discharging, as the Target requires.
2) Immediately afterwards however:
(a) Whilst the Target suggests the unit should remain at 0MW through until the 13:30 time point (the limit of the window shown above) …
(b) Actual profile is that discharge is strong from the battery:
… albeit only up to just above 50MW and not all the way to the 300MW Maximum Capacity of the unit.
(c) But this is what would be expected for a battery injecting to help support a rapidly declining frequency
(d) Indeed, if the timestamps on the 4-sec SCADA data align, then:
i. The injections from VBBG1 begin to ramp quickly (from 1MW to 8MW) at 13:09:47
ii. Which is the same time point when the frequency drops below the low-point of the Normal Operating Frequency Band (or NOFB).
(e) We can see injections to the grid continuing through the 13:15, 13:20 and 13:25 dispatch intervals
3) … until returning to a more neutral position from early in the 13:30 dispatch interval (at ~13:25:30), coincident with system frequency recovering to be just below 50Hz.
Victoria Big Battery in the Market Data
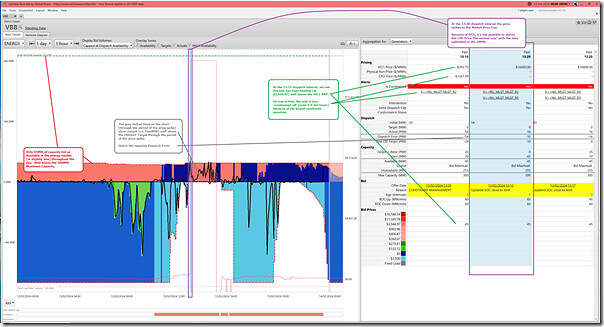
Time-travelling a copy of the ‘Station Dashboard’ widget in ez2view (from a ‘preparing for IESS’ version 9.9.1.98) we take a look at the operations of both sides of the Victoria Big Battery (on the chart – the table is focused on the discharge side) in the following image.
In this snapshot for the 13:15 dispatch interval we see that the VBBG1 (i.e. exporting) DUID:
1) Is caught up in the ‘V>>NIL_MLGT_MLGT_R2’ constraint equation that’s bound at this dispatch interval:
(a) which we’ve already seen mentioned in other articles also about the day;
(b) this has the effect of driving the CPD Price for the unit below –$1,000/MWh (in other words, the unit could not bid in any way to achieve a dispatch target for the unit even if it wanted to);
2) Although we note in this dispatch interval that:
(a) the unit only has 45MW of available capacity (despite a Maximum Capacity on the discharge side of 300MW); and that
(b) this 45MW of capacity was offered up at $3,944.97/MWh at the RRN for the ENERGY market:
i. Which is well above the RRP in Victoria for the 13:15 dispatch interval ($393.75/MWh)
ii. So it’s clear that the unit would not have received a Target, even in the absence of the bound constraint equation that makes it impossible for it to be other than 0MW.
(c) I’ve not looked at each FCAS layer, at this point.
3) Remember that the ‘Market Demand’, the dispatch Targets, and the RRP for this 13:15 dispatch interval were all determined at ~13:10 and published to clients around ~13:10:20
… so just after the (13:08) start of frequency fluctuations above.
4) But we do see that the unit output increases from 20MW (InitialMW) to 54MW (FinalMW) in this dispatch interval in spite of the Target being 0MW:
(a) So we wonder if a combination of Primary Frequency Control; and also
(b) The effect of Raise FCAS services (both Regulation and Contingency)?
(c) Indeed, we saw from the trace of the 4-second data above that the unit was ramped up (i.e. well above the target) as an inverse reaction to the low frequency.
Five minutes later (at the 13:20 dispatch interval), we see that:
1) The ‘V>>NIL_MLGT_MLGT_R2’ constraint equation that was bound before is also joined by the bound (and related) ‘V>>NIL_MLGT_MLGT_R5’ constraint equation;
2) In terms of dispatch outcomes:
(a) Because of the Over-Constrained Dispatch (OCD) process that kicked in for this period (Allan’s review of the day discussed this):
i. it’s not possible to calculate the CPD Price for this period using the existing method that just queries information in the EMMS
ii. hence in ez2view version 9.9.1.98 (shown above) we blank out the data;
iii. in a future version we’ll do more to overcome this limitation in the EMMS data.
(b) But we note that the unit does not get a dispatch target even though the RRP (at the $16,600/MWh Market Price Cap) is well above the $3,944.97 at the RRN bid band that the capacity is offered in.
3) In this dispatch interval, in contrast to 5 minutes ago, the output drops from 54MW (InitialMW) to 10MW (FinalMW).
A multi-commodity view
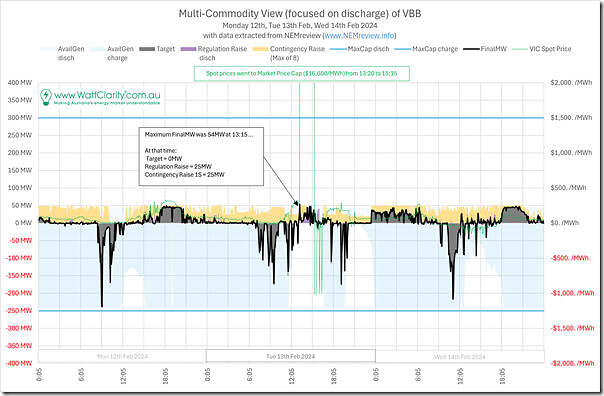
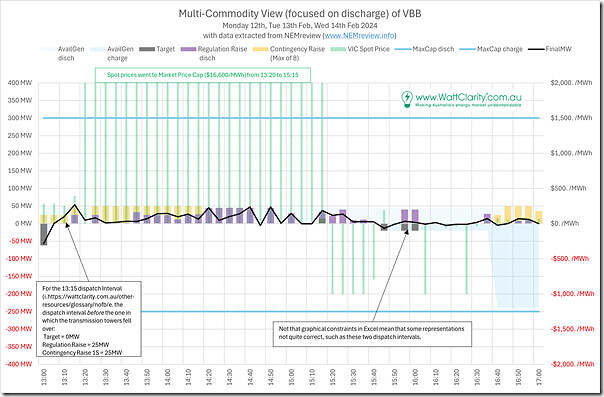
Extracting data from NEMreview (also possible in ez2view) I’ve prepared this bi-directional view of the battery, highlighting (on the discharge side) a multi-commodity view incorporating:
1) The Target for ENERGY;
2) The Enablement level for Regulation FCAS; and also
3) The maximum (for each dispatch interval) for Contingency Raise FCAS services.
This helps to see a clearer overall picture of the overall utilisation of the battery in terms of the propensity to discharge to supply ENERGY and/or RAISE services of various types.
Zooming into the chart above, for the period from 13:00 to 17:00 (which includes the 2-hour period of the price spike), we see the following:
In this zoomed chart we can see that:
1) For the 13:15 dispatch interval, the aggregate utilisation on the discharge side (in terms of aggregate ‘target’ across ENERGY and Raise FCAS services) was 50MW.
(a) This was an even mix of Regulation and Contingency;
(b) As noted above, the ENERGY target was 0MW.
2) For the 13:20 dispatch interval, this aggregate utilisation dropped to 0MW for reasons we don’t have time to explore here; but
3) From the 13:25 dispatch interval, there were a sequence of dispatch intervals where:
(a) total enablement for Raise FCAS summed to 50MW;
(b) with the exact mix changing from one dispatch interval to the next.
About the SIPS
But there’s a big gap between 50MW and 300MW Maximum Capacity (i.e. gap of 250MW) that neatly maps to that reserved for SIPS during summer periods … so we thought it would be useful to take a detour and explore a hypothesis.
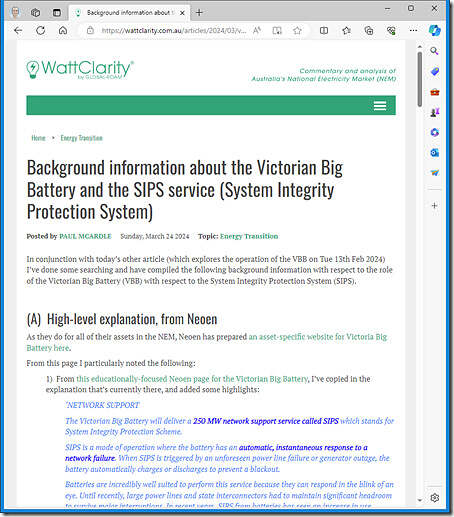
To confirm what I had been thinking about the System Integrity Protection System (SIPS) that the Victorian Big Battery participates in, I did a bit of searching and have collated information about the VBB role in the SIPS in this article ‘Background information about the Victorian Big Battery and the SIPS service (System Integrity Protection System)’ also published today:
Useful to highlight that, at the time of the transmission tower failure, the VIC1-NSW1 interconnector had been flowing northwards (i.e. target flow +260MW for the 13:10 dispatch interval) … in which case (according to my understanding of the SIPS requirements) the VBB was not required to discharge in event of a sudden transmission failure.
Summing up
So to briefly sum up – unless I am mistaken in some way (in which case please do let me know, either by public comment below, or privately one-on-one):
1) The analysis above seems to indicate that:
(a) This assumes that the dispatch of the ‘250MW reserved for SIPS during summer’ was not meant to be triggered in these specific circumstances – despite the fact that this event included both:
i. A large amount of load initially ‘shaken off’ as an immediate response to the transmission tower failure; and
ii. Also included a large amount of load later load shed under ’Actual LOR3’ Load Shedding arrangements as AEMO struggled to balance supply and demand.
(b) Whether the specific design of this arrangement might be improved is possibly(?) something that will be reviewed as part of the broader review of the incident.
2) But, as it stands, it highlights the need to discount the installed capacity of the Victoria Big Battery (and other plant like it) that’s assumed to contribute more generally to ‘Reliability’ settings when performing market modelling based Reliability calculations:
(a) Such as in the ESOO and the ISP
(b) A bit like derating of many different plant types during high-temperature summer periods?!
Nothing further at this point.


Would battery discharge by VBB be able to provide the increased import limits on VNI under SIPS when the Moorabool – Sydenham 500 kV lines were lost?
You refer to the V>>NIL_MLGT_MLGT_R2 and V>>NIL_MLGT_MLGT_R5 constraint equations. The names of the constraints suggest that they relate to the Moorabool – Geelong 220 kV circuits, which could overload during the 500 kV outage.
Paul, re: VBB SIPS, this is only armed for trip of a number of transmission lines, primarily any of SM-DD-MS 330kV lines