On Monday 31st October, we released GenInsights Quarterly Update for Q3 2022.
This is a report we’re now developing each quarter to update and extend a range of the analysis included in GenInsights21 (now published ~11 months ago)
In discussions following from this, we’ve decided to share (more broadly here on WattClarity) one or two of the observations in this 204-page report. In this article we’ll cover some of what was discussed with respect to IRPM.
(A) About Instantaneous Reserve Plant Margin
The Instantaneous Reserve Plant Margin (we generally use the abbreviation ‘IRPM’) is a metric we first created way back in 2002 in one of the early versions of our NEMwatch software.
… for a walk down memory lane, here’s a snapshot of NEMwatch v4 from back in June 2022 showing the IRPM on the left of screen.
The Instantaneous RPM was borne out of the more traditional use of Reserve Plant Margin (RPM) as a forward-looking, non price-based system capacity planning metric. What we did was translate this into a real-time metric to achieve a similar purpose – as follows:
By calculating on a NEMwide basis…
1) it avoids the complexities (and distractions!) of dealing with interconnector flow and congestion;
2) and shows the underlying balance between supply and demand from a market (dispatchability) perspective.
The IRPM serves as a useful ‘heartbeat’ metric to illustrate the health of the NEM …
1) Which is why it’s been included in NEMwatch for ~20 years,
2) and why there’s a similar representation in the ‘NEM Summary Stats’ widget within ez2view,
3) It’s why there have been a number of articles shared on WattClarity about low points; and
4) Why we’re going to regularly provide more systematic analysis in the Appendix 1 (NEM Heartbeat) of the GenInsights Quarterly Updates from Q3 2022.
Further explanation is in the WattClarity Glossary here.
So with this background in mind, let’s move onto some analysis …
(B) Trend of IRPM over time
With each of the many metrics covered in GenInsights Quarterly Updates, we’re seeking to utilise a format where we deliver both:
Aspect #1) We provide a long-range trend of the metric (sometimes back to the start of the NEM) …
… because our view is that there’s plenty to learn from the history of the NEM (including how exceptional certain outcomes might be when they occur at this point in the energy transition).
Aspect #2) And provide useful context about the metric by drilling into specific performance for the quarter in focus.
… in order that we can look specifically at recent performance, sometimes down to a discrete Dispatch Interval (in a Case Study), in order to understand what’s really going on.
This we did for IRPM for Q3 2022, and here are two small snippets:
(B1) Monthly across NEM history
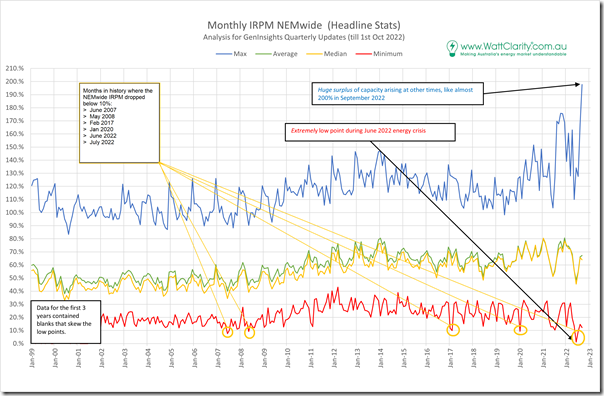
Lifted out of the GenInsights Q3 2022 report, and with an additional annotation added, here’s the trend of extreme levels of IRPM for all months through the 23 years of NEM history:
I’ve noted on the image that there were only 8 discrete months through NEM history that saw IRPM drop below 10% (noting that in the first three years, our record of dispatch interval data contains some sporadic gaps):
May and June 2000
You’ll see further below that there were some low points … noting that this was prior to the commissioning of the QNI interconnector, and years prior to the TAS region joining the NEM.
June 2007
The low point in this month was a staggering low of only 7.6% … which for many years was the lowest ever experienced. This event occurred on 19th and 20th June 2007:
1) There’s a short article here recording the event; and
2) The longer article ‘Background information to the shortage of capacity in winter 2007’ followed on 22nd June…. though the images appear to have gone awry at some point in the meantime.
3) Also worth noting that these low numbers were also noted by Duncan Hughes in the AFR.
May 2008
The low point in this month was down at 9.2%.
I did not see any articles on WattClarity around that time … but the WattClarity service was not so frequent at that time.
Feb 2017
The low point in this month was down at 9.9%.
There are a number of articles pertaining to the early part of February 2017 that could point to the specifics.
Jan 2020
The low point in this month was down at 9.4%.
Back at the time we wrote about ‘Thursday 30th January 2020 sees demand reach 34,257MW and LOR2 notice issued for both VIC and SA’ which included a snapshot of the red level alert on NEMwide IRPM … and it’s worth also remembering the ‘White knuckle ride across the NEM on Friday 31st January 2020 (extreme NEM-wide demand)’ on the following day.
June 2022
The low point in this month was down at the microscopic level of 1.2% … which is (we would hope) the lowest that will ever be experienced! June was a crazy month indeed:
1) Well before the Market Suspension, IRPM was quite tight … such as on Thursday 2nd June when IRPM dropped as low as 10.2%.
2) On Monday 13th June (with QLD under Administered Pricing) we see here the IRPM dropped to only 8.49%.
3) We noted on Friday 17th June 2022 how the IRPM was down at 3% … at 23:45!
There was plenty more going on, so we did not capture the 1.2% in an article.
July 2022
It’s important to understand that the challenges in the market did not end with the un-suspension of the market on 24th June 2022.
We see in the chart above that July 2022 saw the IRPM drop to a low point of 9.1% … which (as you can see from the above) was incredibly rare in NEM history. In the days prior to this occurring, we’d written about ‘Price volatility on Monday evening 11th July with ‘Market Demand’ near 31,000MW’ … where IRPM dropped to 10.77% at 18:20. But we did not document 12th or 14th July at the time.
(B2) Daily through Q3 2022
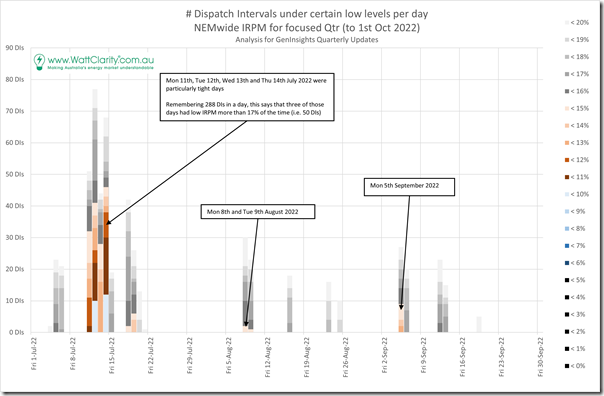
Also lifted out of the GenInsights Q3 2022 report (specifically looking within Q3 2022), we counted the number of low instances we saw in each of the 92 days through the quarter.
The low points (under 20%) are trended, but note the particular interest in <15%, and the even rarer instances of <10%:
We can see the lowest points identified on 12th and 14th July, but what also jumps out are the periods in August and (even!) September with low points under 15%.
(B3) What does it mean?
It’s likely that readers might look at data like this and form a range of different perspectives:
Perspective #1) Some might look at this data (even for Q3 2022) and decide that the low points shown here are entirely the result of the broader 2022 Energy Crisis, which was worst in Q2 2022 but persisted into Q3.
… this would be particularly the case in looking at the low points in July if the reader was to think about carry-over coal unit issues (still not resolved at that time) coinciding with cold weather after sunset.
Perspective #2) Others might take the view that the low points also provide clues as to what might happen in the years ahead as the energy transition rolls onwards.
To me what stands out are the low points in September, a ‘shoulder’ month which has very rarely experienced periods of low IRPM in years gone by … as shown in the tabulated results below
(B3a) Comparative lowest points on a monthly basis
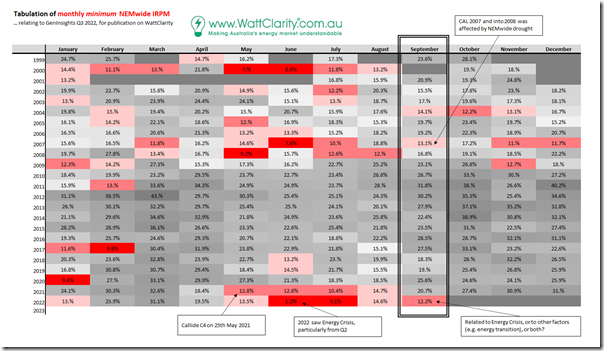
Here’s the IRPM data (monthly low points) arranged by month of year and tabulated:
From this table we see that:
1) There were 5 years (2012-2016) that saw not a single instance of IRPM below 15% (even with El Nino summers) … you will recall that:
(a) this was in the period where Grid Demand was declining (due to various factors – with rooftop PV not being such as dominant a driver like it is today)
(b) this was also prior to the closure of Hazelwood (at the end of March 2017), which really started to changed things significantly.
2) Looking specifically at the months of September, the only other years (prior to Sept 2022) that saw low points under 15% were:
(a) Way back in September 2007, which was a period when the drought affected:
i. most hydro generators in the NEM (TAS, VIC, NSW and southern QLD); and also
ii. a number of thermal units experienced energy restrictions.
(b) Prior to that it was September 2004 … and into October and November
… but that’s so far back I can’t immediately recall possible drivers.
From the above it’s quite clear that the low point in September 2022 stands out, and that it’s just part of a broader propagation of tighter supply-demand periods that have been increasing in frequency since January 2017.
(B3b) Count of DIs under 15% by month
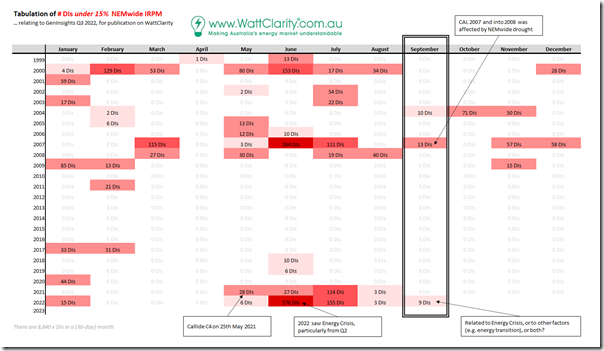
Here’s the same grid, populated with the number of dispatch intervals under 15% … showing again how September 2022 stands out:
In both tables above we see how unusual it was to see IRPM points that low in the month of September…. so it is understandable to ask why it occurred then.
(C) What happened on Monday 5th September 2022?
It turns out that we documented how ‘NEM-wide IRPM drops below 15% on Monday 5th September 2022’ here at the time.
You will also note in this article that:
1) We’d been asking ourselves the same sorts of questions at the time; and that
2) At the bottom of that article that we wrote of the looming completion of the analysis (some published here) that was documented in the GenInsights Q3 2022 report released on Monday 31st October.
Now that the report is released, I thought I might follow up with a Case Study of unusual results like this one…. but that will be a ‘Part 2’ article soon…


Leave a comment