As was expected, spring is increasingly ‘Record Season’ with records tumbling for ‘Market Demand’ (and likely ‘Operational Demand’ as well, though I have not yet checked) in different parts of the NEM.
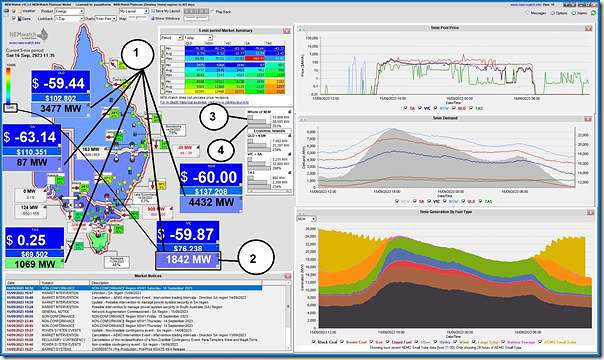
Here’s a snapshot from NEMwatch at 11:35 on Saturday 16th September 2023 that provides a multi-dimensional dashboard view of a range of market data for this dispatch interval…
Of these I will just highlight 4 things:
1) Low demand across all 4 x mainland regions
Each regional demand levels are coloured on a sliding scale from lowest historical points (at blue) to highest historical points (in red) …. using Market Demand .
It’s plain to see that the mainland NEM regions are all at quite low levels (TAS is a different case, with demand being still in the higher green range, helped by the cooler temperatures and the larger percentage share of industrial load).
2) ‘Lowest ever’ Market Demand in Victoria
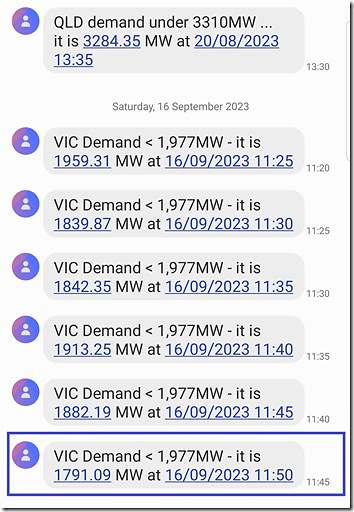
At this point the Victorian Market Demand is sitting at 1,842MW … but it had been down at 1,839.87MW five minutes earlier, which we see (with rounding) is the ‘lowest ever’ point experienced for this region at the point of the snapshot above. We see this in a series of SMS alerts that are still collecting on my phone as I type … but note an even lower point emerged at 11:50 (down at 1,791MW):
(i.e. it may well be lower by the end of the day)
The prior record for ‘lowest ever’ was on Sunday 2nd October 2022 (down at 1,977MW at 13:00), so this represents a significant drop.
—————–
PS 1a) Lowest Point for VIC Demand
Using the measure of Market Demand, it appears the lowest point turns out to be 1,735MW at 12:15.
Lowest point for Operational Demand was 2,243MW for the half-hour ending 12:30.
3) ‘Lowest ever’ Market Demand on a NEM-wide basis
Also at this dispatch interval, the NEM-wide Market Demand is sitting at 10,909MW in the snapshot above … but it had dropped to 10,776MW at 11:50 (and may drop further through the middle of the day).
The prior record for ‘lowest ever’ was on 6th November 2022 (down at 11,607MW), so this represents a significant drop.
—————–
PS 1b) Lowest Point for NEMwide Demand
Using the measure of Market Demand, it appears the lowest point turns out to be 10,733MW at 12:25 (i.e. 10 minutes after VIC region above).
Lowest point for Operational Demand was 11,499MW for the half-hour ending 12:30. (i.e. coincident with VIC region above).
4) ‘Highest ever’ level of NEM-wide IRPM
It’s probably understandable to most readers that the mix between these low levels of Market Demand, driven by spring weather patterns (albeit a bit warmer than normal in parts of NSW) and high VRE output collide in producing what I think will turn out to be a day with the highest-ever levels of Instantaneous Reserve Plant Margin (IRPM).
… when we start the process of compiling GenInsights Quarterly Update for Q3 2023 we’ll see what the pattern has been over the quarter soon to elapse. This trend shared here was up until 31st October 2022.
At the 11:35 time of the snapshot above it was sitting at a massive 252.98% … but higher still (at 259.01%) at 11:50 – and perhaps even higher by the end of the day.
—————–
PS 1c) Highest Point for NEMwide IRPM
It appears the highest point turns out to be 264.02% at 12:25 (i.e. coincident with lowest point for NEM-wide demand).
5) High percentage of VRE
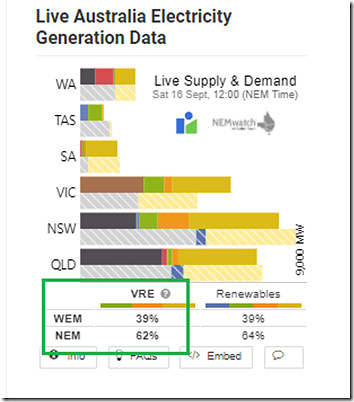
As a bonus point we reference the ‘Percentage VRE’ stats we added into the Live Supply & Demand widget sponsored by RenewEconomy (a.k.a. the ‘NEMwatch widget’) back in November 2022 and we see the percentage VRE of total supply in the NEM (notwithstanding the complexities of ‘the Invisible Man’) being approximately 62% for the 12:00 dispatch interval …
For those wanting to understand the details in that percentage, the ‘?’ on the widget links through to this explanation we prepared at the time.
6) SA demand also drops very low … as a PS2
There’s an issue of long-term basis comparison with SA Market Demand …
(a) given some Non-Scheduled wind farms started operating as Semi-Scheduled not too many years ago …
(b) precisely because of the challenges of minimum demand …
(c) but as a result of which the ‘Market Demand’ calculation now includes more inputs (i.e. is higher) than it used to prior to that change.
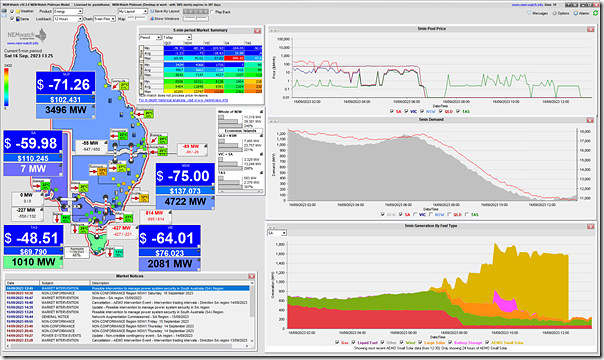
However it’s notable that Market Demand dropped to only 5MW at 13:35 – not long after this snapshot from NEMwatch at the 13:25 dispatch interval, showing it down at 7MW:
Also notable here that:
(a) rooftop PV producing ~1,400MW just in SA (using the AEMO estimates and remembering the ongoing opacity of rooftop PV).
(b) appears that both Large Solar and Wind are curtailed … at least in part because of prices down near ‘negative LGC’.
(c) Not shown explicitly here, but:
i. only 2 x thermal units running at this time (Torrens B2 and Mintaro)
ii. batteries in SA are either at 0MW or charging.
(d) SA exporting to VIC (even with its low demand), and with Murraylink still out of service.
(e) Using Operational Demand as the measure, the low point was 21MW for the half-hour ending 13:30 (NEM time).
I wonder what might happen if there was some contingency event disrupt rooftop PV in SA (and how likely such an event might be).
An interesting day indeed!
————
PS3 with AEMO confirmation
Saturday afternoon, Mike Davidson wrote …
‘Looks like a cascade of records Paul. We’ll confirm when we’ve checked all the data.’
… but we’ll have to wait for more …


Good question about managing risks of contingency events tripping off SA rooftop PV Paul. There are various system normal constraints which limit flows from Victoria into SA via Heywood under conditions of high PV generation in South Australia for just this reason – to leave headroom for suddenly increased flows if a large block of rooftop PV were to trip because of some disturbance in SA – for example the V::S_NIL_MAXG_1 and _MAXG_2 transient stability constraints. But on a low demand day like today when flows are exports out of SA, these constraints wouldn’t bind as there will be sufficient headroom for imports after a contingency anyway.