The ‘N::N_UTRV_2’ constraint equation is back in action again from this weekend:
(a) though you might have missed it, given the overshadowing that’s been the SA islanding!
(b) this particular constraint equation became invoked again from 06:05 on Saturday 12th November 2022 as part of the ‘N-RVYS_2’ constraint set, out until 16:00 on 30th November 2022)
… so I’ve picked up what I started looking at earlier, after the price spike at 17:30 on Friday 28th October 2022.
I’ve done this for several reasons, including (but not limited to) the following:
Reason 1) in order to explore the extent to which the new ‘Constraint Dashboard’ widget, released in ez2view v9.5, helps to make the complexity of these types of constraint equations understandable:
(a) Exercises like the preparation of this Case Study help to identify:
i. How much it helps already (as released), and also
ii. What else there is still to do to extend its capability to the optimal extent:
(b) We already have a number of additional enhancements identified that we’ll be discussing with those clients who express a particular interest;
Reason 2) We’ve also started development of another related widget (focused on other aspects of constraints), and the exercise of preparing this Case Study has helped direct that exercise as well.
Reason 3) Sharing Case Studies like this occasionally also help to illustrate to our growing number of clients how to use some of the functionality of ez2view (such as this new ‘Constraint Dashboard’ widget, in this case).
Reason 4) An additional benefit to sharing this here on WattClarity as sometimes our readers can also provide us useful suggestions.
So with this background in mind, it’s on with the show…
(A) History of invocation
Scanning quickly how this ‘N::N_UTRV_2’ constraint equation has been used, I’ve seen the following:
(A1) Prior to CAL 2022
I chose not to comprehensively scan history of the constraint equation prior to 2022, but rather do a quick search for similar articles on WattClarity, and found a couple related constraint equations and constraint sets (to do with neighbouring parts of the network) – such as the following:
4th January 2020
It’s not the same constraint equation, but worth highlighting how ‘Bushfires under interconnectors through Snowy Mountains cause separation of NSW from VIC region’ on 4th January 2020.
On this occasion it was the ‘N-UTYS_2’ constraint set which was invoked (also discussed a few weeks later here) – which relates to an outage of the Upper Tumut to Yass line, rather than the Ravine to Yass 330kV line.
15th December 2020
It’s not the same constraint equation, but worth highlighting this ‘Short price spike in NSW on Tuesday 15th December 2020’.
On this occasion, it was the ‘N::N_BYCR_UTYS_2’ constraint equation which was involved, as part of the ‘N-X_BYCR_UTYS’ constraint set (this one relating to an outage on Bannaby to Crookwell (61) and Upper Tumut to Yass (2) 330kV lines).
(A2) Looking within CAL 2022
Within the current year it looks like there’s been a couple discrete occasions when the constraint equation has been used, including the following (might have missed some in the transcribing):
2nd May to 11th May (unplanned outage)
From 18:20 on 2nd May to 11:30 on 11th May, the ‘N-RVYS_2’ constraint set (containing the ‘N::N_UTRV_2’ constraint equation, amongst others) was invoked.
Right from the start of the invocation period (i.e. from 18:20), we started to see ‘Evening volatility in QLD (and NSW), and a mysterious/significant drop in Available Generation, on Monday 2nd May 2022’.
In that article it is noted that this was an unplanned outage of the Ravine-Yass No 2 330kV Line (Market Notice 96004) … as a result of which the constraint set was invoked, but there’s no ID for this in the TransGrid Outage Management System.
On 5th May we’d written about the ‘Evening volatility again in QLD and NSW on Thursday 5th May 2022’, and had included some early snapshots from the (in development) ‘Constraint Dashboard’ widget.
On 9th May we’d written about the ‘Transmission outage on ‘Ravine to Yass (2) 330kV line’ still ongoing’, and had included some early snapshots from the (in development) ‘Constraint Dashboard’ widget.
1st July to 10th July … with a short gap
From 08:35 on 1st July to 08:30 on 8th July … and then 10:20 on 8th July to 13:10 on 10th July, the ‘N-RVYS_2’ constraint set (containing the ‘N::N_UTRV_2’ constraint equation, amongst others) was invoked.
I note that the 10th July RTS for the line was just in time for the period of low NEM-wide IRPM (experienced on 11th, 12th, 13th and 14th July 2022), so presumably might have prevented additional volatility through that period.
29th August to 2nd September
From 08:05 on 29th August to 17:10 on 2nd September, the ‘N-RVYS_2’ constraint set (containing the ‘N::N_UTRV_2’ constraint equation, amongst others) was invoked.
19th September to 30th September (TG_708897)
From 07:05 on 19th September to 15:20 on 30th September, the ‘N-RVYS_2’ constraint set (containing the ‘N::N_UTRV_2’ constraint equation, amongst others) was invoked.
4th October (TG_714021)
From 09:05 to 17:15 on the same day (4th October), the ‘N-RVYS_2’ constraint set (containing the ‘N::N_UTRV_2’ constraint equation, amongst others) was invoked.
17th October to 19th October (TG_699491)
From 06:05 17th October to 17:10 on 19th October, the ‘N-RVYS_2’ constraint set (containing the ‘N::N_UTRV_2’ constraint equation, amongst others) was invoked.
27th October to 7th November (TG_738594)
From 06:05 on 27th October to 7th November 2022 the ‘N-RVYS_2’ constraint set (containing the ‘N::N_UTRV_2’ constraint equation, amongst others) was invoked.
As noted above:
1) we’ve already posted these ‘Quick initial notes about price spike at 17:30 on Friday 28th October 2022’, including the use of a snapshot of the ‘Constraint Dashboard’ widget in real time mode.
2) In which case what follows below could be thought of as ‘Part 2’.
On Monday 31st October we also noted about ‘Brief spike at 11:10 in NSW and QLD on Monday 31st October 2022’, referencing the same constraint equation.
This same constraint equation was the one referenced in this article about ‘Low wind on Friday 4th November 2022’.
12th November to 30th November
From 06:05 on Saturday 12th November the ‘N-RVYS_2’ constraint set (containing the ‘N::N_UTRV_2’ constraint equation, amongst others) became invoked again … and is currently scheduled to persist until 16:00 on 30th November 2022.
As we can see, this constraint equation (which is outage-related) has been quite active through the year.
1) In May there was an unplanned network outage that led to the ‘N-RVYS_2’ constraint set (containing the ‘N::N_UTRV_2’ constraint equation, amongst others) being invoked … and it would seem that contributed to price volatility.
2) In October it was a planned outage – but there’s still been some instances of volatility, at least in part.
3) In between then, there were a number of periods of invocation, but from a quick scan I could not fine earlier articles pointing to volatility that might have resulted from the constraint equation.
(B) Allan’s explanation, and Dave’s question
Following the price spike on 28th October and the article here on WattClarity, we followed a normal process of sharing on some social media channels:
1) I shared directly with people on LinkedIn here; and
2) Also appended a comment on Dave Smith’s thread on LinkedIn here.
On this occasion there was conversation that ensued on Dave Smith’s thread. Amongst this, I noticed that valued guest author, Allan O’Neil, added two comments on that Dave Smith thread – which i think were worth sharing here with readers on WattClarity, in order that these two comments have a longer shelf life.
Firstly Allan wrote:
‘As Paul McArdle outlines, the usual dynamic for this sort of event is:
a/ a constraint within NSW on flows from generators in southern NSW (and Victoria, represented in the constraint as flows on VNI) limits the maximum power that can get northwards to the Sydney load centre
b/ this limit means more dispatch from generators on the northern side of the constraint and that they will be the price setters when the constraint binds
c/ with enough demand in NSW and depending on bidding behaviour of generators in the north, the limit on flows can drive spot prices to spike
d/ southern NSW generators behind the constraint still get paid the very high price so they have an incentive to maximise generation even though none of the extra power can get north to the load centre
e/ if some of those generators offer in at -$1,000/MWh (eg Snowy) they may get dispatched to higher output levels causing other generators in southern NSW and Victoria to get offloaded (because supply south of the constraint has to stay balanced). This will typically force flows south out NSW into Victoria even though the Vic spot price is below NSW. The dispatch algorithm uses the -$1,000/MWh offer compared to marginal Victorian offers in deciding which gens to dispatch’
… to which Dave Smith replied:
‘Allan O’Neil this explains the counterprice flows, but not the NSW price spike.
It seems likely to be a ramp rate limit, given that Snowy was unable to load follow due to the constraint. And given that the spike only lasted for one DI.’
… and Allan responded:
‘Dave Smith quite likely. I swept all that up in terms of “bidding behaviour of the northern generators”. Quite a few people see these events and think it’s Snowy’s bidding at Tumut that has somehow *caused* the spike.’
Note that some of the other conversations there are informative, as well.
(C) Case Study (exploring the price spike on Friday 28th October 2022)
With the above in mind, we’ll focus now on the price spike at 17:30 on Friday 28th October 2022.
(C1) Hours before the price spike (at 15:50)
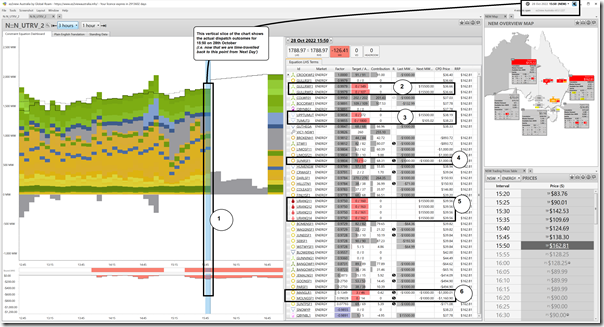
To set the scene, we’ll start with this snapshot from ez2view Time-Travelled back to 15:50 and containing three widgets (the ‘Constraint Dashboard’ widget, the ‘NEM Overview Map’ and the ‘NSW Price Table’ widget):
Frequent readers will remember that you can generally click on any image to open up as higher-resolution in another browser tab (this new widget has a load of detail).
We can see that the NSW spot price was $162.81/MWh at the time – on the image I have included some annotations, which we will work through each in turn:
1) The vertical slice for ‘now’ on the chart (i.e. at 15:50 with the benefit of ‘Next Day Public’ data via Time-Travel) we see that:
(a) this constraint equation is bound with a Marginal Value of –136.41).
(b) the coloured blocks show the contributions* from all elements on the LHS of the constraint equation, coloured by fuel type … so we see:
i. contribution from wind (green), solar (yellow), hydro (blue),
ii. but none from gas (red)
iii. and a relatively low contribution only from the VIC-NSW interconnector (grey) … in the table we can read that this is a contribution of 255.10 out of a total LHS of 1,788.97
————————————–
* What do we mean by ‘Contribution’?
You’ll note that in table on the right of the ‘Constraint Dashboard’ widget we’ve included a column labelled ‘Contribution’.
1) This contains the individual contributions to the LHS that each of the various DUID (or Interconnectors or Region) are making to that LHS;
2) Where each of the Contributions is calculated as the Dispatch Target (for that DUID) x the LHS Factor.
Hence it’s important to note that the contribution of a DUID, or an Interconnector, can have a negative contribution … such as is the case for QBYNBL1 in the image above. Where this happens it is shown ‘below the axis’ in the chart on the left (in the case of the image above -4.95 is there under the line, just too small to see).
————————————–
2) Starting from the top of the table, we’ll walk through each of the DUIDs that is showing some pink (representing spare capacity not dispatched), starting with the Gullen Range site:
(a) GULLRWF1 is showing 0MW Target out of 149MW available … not dispatched because all this volume was bid up at $15,500/MWh whereas its CPD Price* is $36.66/MWh (i.e. it’s bid way ‘out of the money’).
i. * See the WattClarity Glossary here for more detailed description, but you might think of the CPD Price as the price to be under to be dispatched (for a supply-side unit).
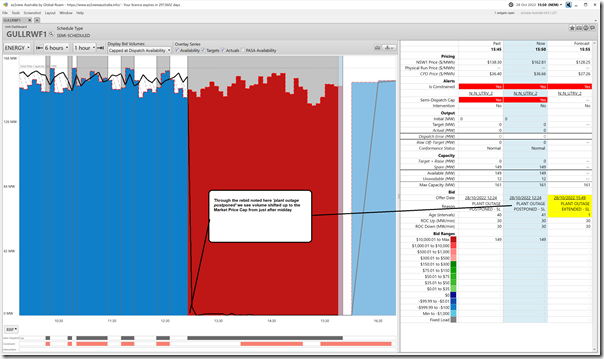
ii. In this case (being 1st on the list that we review) I thought it would be useful to include more details for this unit from the ‘Unit Dashboard’ widget shown below, Time-Travelled to the same point in time:
iii. As noted here, the unit is still showing Availability – but it’s been bid to the Market Price Cap since the rebid received by AEMO at 12:24.
(b) GULLRWF2 (i.e Biala Wind Farm) is showing 0MW Target out of 107MW available … not dispatched because all this volume was bid up at $15,500/MWh whereas its CPD Price* is also $36.66/MWh (i.e. it’s way out of the money).
3) Walking down the page, we get to two Snowy units showing pink:
(a) UPPTUMUT is showing 0MW Target out of 172MW available … also bid well ‘out of the money’.
(b) TUMUT3 is showing 0MW Target out of 1800MW available:
i. in this case its ‘Next MW @’ volume* at $105.02/MWh is still above its CPD Price ($38.23/MWh), but not to such a large extent.
ii. assuming all bids stayed the same (a big assumption!) we might expect this to start ramping up as solar sets further into the spring evening.
————————————–
* What do we mean by ‘Last MW @’ and ‘Next MW @’?
You’ll note that in table on the right of the ‘Constraint Dashboard’ widget we’ve included two columns labelled:
1) ‘Last MW @’; and
2) ‘Next MW @’
…. though in the screenshot image above, the columns are too narrow to read the whole name.
These columns show the bid price (at the RRN) that was used for that dispatch interval for that DUID:
1) ‘Last MW @’ represents the Bid Price for ENERGY (or FCAS, as appropriate) that was the last MW dispatched from that DUID at this dispatch interval; whilst
2) ‘Next MW @’ represents the Bid Price that would apply if one more MW was to be dispatched…. or, if no more capacity is available, it is blank.
Oftentimes these two prices will be the same … it’s where they are different that are particularly interesting.
It’s also worth noting that the ‘Last MW @’ are shaded to represent the percentage of that particular bid tranche that’s been dispatched.
————————————–
4) Next we arrive at SUNRSF1, which is partially dispatched in its –$1,000/MWh bid band:
(a) Dispatched at 70MW of 132MW available
(b) It’s ‘Next MW @’ is also down at –$1,000/MWh, as is its CPD Price
(c) So we see that this unit is being ‘constrained down’ … but:
i. we see from this image above that there are other DUIDs above it in the list with a higher factor that are not being ‘constrained down’;
ii. so we deduce that there are other constraint equations playing a significant role in ‘constraining down’ this unit;
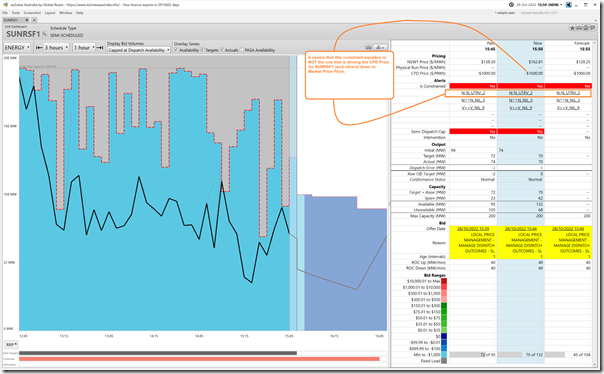
(d) Out of curiosity we open up the ‘Unit Dashboard’ widget shown here:
i. Note that there are three different constraint equations that are bound, with SUNRSF1 on the LHS
ii. Of these, we have already deduced that the ‘N::N_UTRV_2’ constraint equation is not the one primarily driving the CPD Price to the Market Price Floor (MPF).
iii. Second in the list (just because it’s alphabetical) is the ‘N^^N_NIL_3’ constraint equation … otherwise known as the ‘X5 constraint’.
… as shown in other articles, the LHS factor for SUNRSF1 in that constraint equation is +1.0 (along with Limondale) … which suggests it is that constraint equation that principal force that is ‘constraining down’ the SUNRSF1 unit.
iv. Third in the list is the ‘V>>V_NIL_9’ constraint equation … for which the LHS factor for SUNRSF1 is 0.3696 (i.e. relatively small).
5) Moving down the table further, we see that the four URANQ1* gas-fired peaking units are not dispatched:
(a) Target 0MW for all of them
(b) Because their volume bid is way ‘out of the money’.
6) At the bottom of the list are two other solar farms who are at the bottom of the list because their LHS factors (in this constraint equation) are relatively small at this point in time:
(a) MANSLR1 (LHS factor 0.1349) is dispatched to only 3MW of 46MW available:
i. Despite such a small LHS factor
ii. We see the CPD price is actually below –$1,000/MWh
iii. Which we deduce is due to some other constraint equation.
iv. Not shown here, but using the method above illustrated for SUNRSF1 we deduce it is the ‘N>NIL_94T’ constraint equation that is ‘constraining down’ MANSLR1 (i.e. in which the LHS factor is +0.8731 … which is second largest LHS factor there).
(b) The MOLONGSF1 (LHS factor 0.09028) is dispatched to 0MW of 14MW available:
i. Despite the miniscule LHS factor
ii. We see the CPD price here is even worse (i.e. lower) than for MANSLR1
iii. Which also must be due to some other constraint equation.
iv. Not shown here, but using the method above illustrated for SUNRSF1 we deduce it is the ‘N>NIL_94T’ constraint equation that is ‘constraining down’ MOLONGSF1 (i.e. in which the LHS factor is +1.0 … which is the largest LHS factor there).
I’ve gone into some detail in explaining the above in order that readers can understand more of how to read this particular widget – the notes below are a little more sparse…
(C2) Immediately around the price spike
Understanding that the price spike occurred at 17:30 we’ll start a few dispatch intervals beforehand in order to see how the spike evolved…
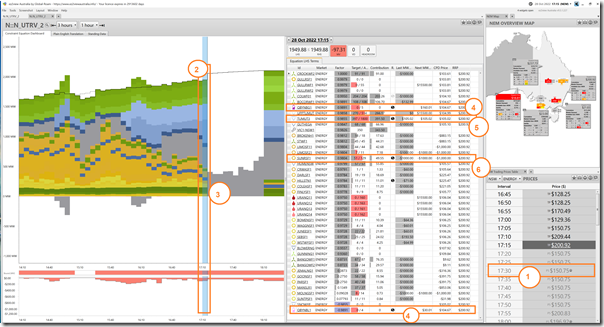
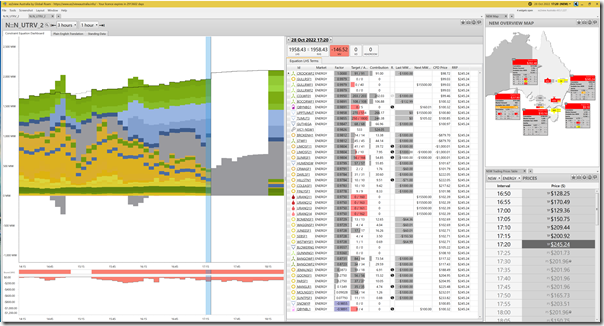
17:15 … three dispatch intervals to spike
At 17:15 we see that the NSW dispatch price is $200.92/MWh, which is already separated from the price in the south (VIC is $21.83/MWh) with the constraint still being bound, but at a small Marginal Value (only –$97.31):
With respect to the annotations:
1) At this dispatch interval, the expectation (i.e. P5 predispatch forecast) is that the 17:30 price will be only $150.75/MWh … which is down from the price at 17:15
2) We see that the RHS has trended upwards, with the LHS hence lifting to follow this.
3) We see aggregate contribution to the LHS from all the solar units has declined over the intervening period.
4) The Queanbeyan BESS, which was charging in the 15:50 period above, is now not doing either but bid available to charge or discharge.
5) The TUMUT3 unit has changed its bid (that’s what the $ sign shows) … but this tranche is still at the $105.02/MWh bid band it was using at 15:50
6) Both LIMOSF21 and SUNRSF1 are ‘constrained down’ … but both by the ‘X5 constraint’ not this one.
17:20 … two dispatch intervals to spike
At 17:20 we see the price in NSW has lifted to $245.24 (rather than the expected drop to $150.75 forecast above):
Nothing else in particular highlighted … but readers can review at their leisure.
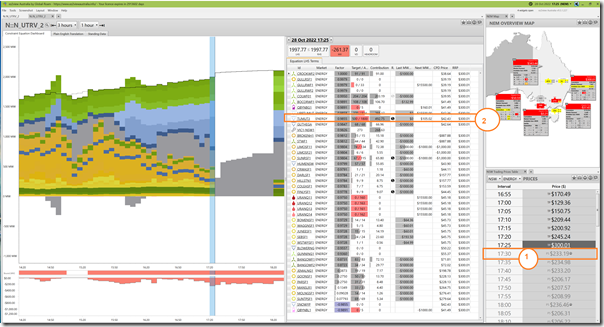
17:25 … one dispatch interval to spike
Here we see the price rise another ~$50 (to $300.01/MWh) rather than falling by ~$50 as had been expected:
Two things in particular are highlighted:
1) That the updated P5 predispatch price forecast for 17:30 is still looking at the price being lower than it is currently:
(a) despite two successive rises in actual price;
(b) perhaps suggesting some questions about ‘just’ relying on automated responses to market outcomes?
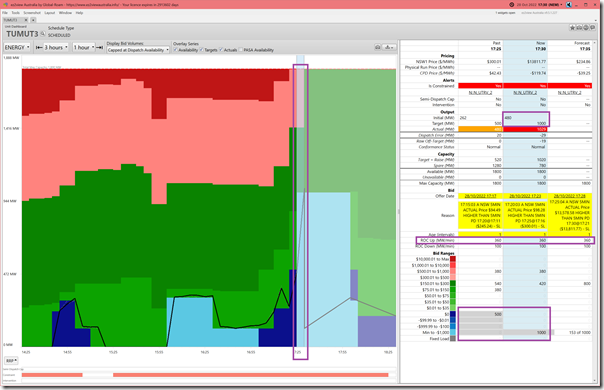
2) Additionally we’ve highlighted TUMUT3 here as it’s worth noting:
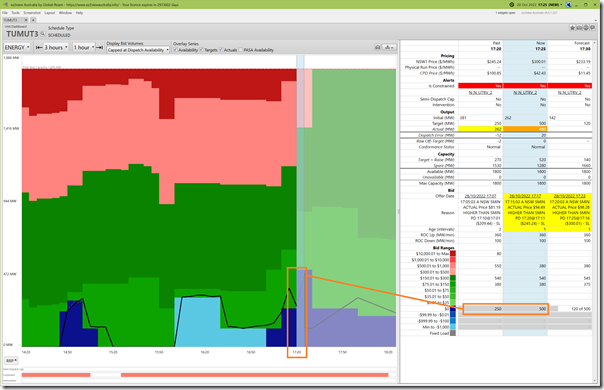
(a) Its output (target 500MW) is up from 250MW at 17:20, which was down from 397MW at 17:15
(b) The ‘$’ symbol also highlights another change in bid.
(c) To see what’s happened, we click through the hyperlink to open up the ‘Unit Dashboard’ widget for the TUMUT3 unit as follows:
(d) We see that TUMUT3 has increased (from 250MW to 500MW) the volume offered in the $0/MWh bid band … which NEMDE gratefully accepts as low-cost supply, so dispatches up the volume offered in that bid tranche.
3) Not specifically annotated above, but worth noting in the snapshot for the ‘Constraint Dashboard’ widget above how few units (explicitly listed here*) there are with have spare capacity that could contribute to the LHS of this particular constraint equation:
(a) The increased dispatch from hydro is replacing the decline of the LHS contributions from Large Scale solar as the sun sets
(b) … and this is made ‘worse’ because some solar farms (as noted above) are being ‘constrained down’ by the ‘X5 constraint equation’
(c) … noting that both MANSLR1 and MOLONGSF1 are now fully dispatched at their depleted ‘close to sunset’ level.
————————————–
* regarding ‘how few units (explicitly listed here)
One reader’s already clarified (thanks!) that whilst there are not many units explicitly listed in this table, there are a large number that could contribute indirectly depending on what the constraint does to the VIC-NSW flow.
————————————–
17:30 … the price spikes (unexpectedly* … but perhaps with prior hints)
We step into the 17:30 dispatch interval and (as we have since noted) the price spiked as not forecast earlier in P5 predispatch … though perhaps there were some leading indicators of volatility that could have been noted in the lead-up:
————————————–
* regarding the unexpected nature of the spike
I’m meaning here that it was not successfully captured in the P5 predispatch price beforehand … but there are reasons why this was the case we can explore later.
————————————–
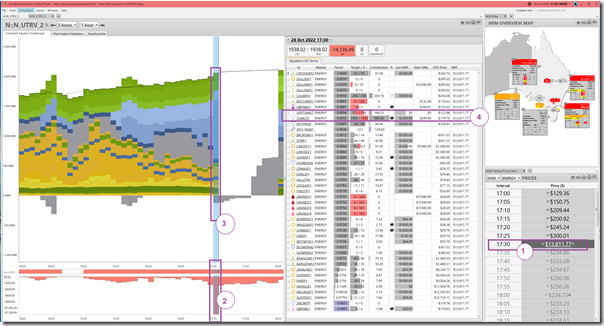
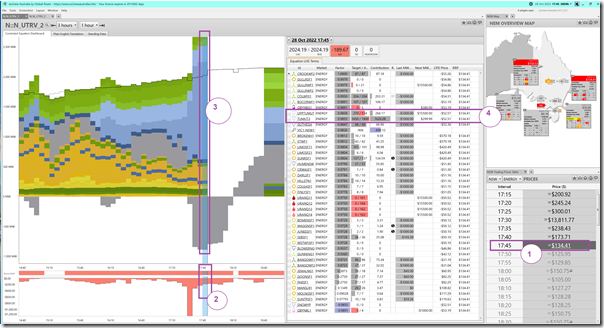
There’s four annotations on this image:
1) The price spike in NSW to $13,811.77/MWh is highlighted … remember that QLD spiked to $15,500/MWh;
2) The Marginal Value of the constraint has now increased significantly:
(a) The MV is shown in the table as –$14,136.49;
(b) Eagle eyes will see that this has extended ‘off the bottom’ of the y-axis in the chart (which is a bug already fixed with the newest release, which is currently v9.5.1.230).
3) In the stacked LHS contributions we see several things:
(a) The RHS dropped slightly from 17:25 (1958.43) to 17:30 (1938.53) … hence ‘constraining down’ harder on the aggregate LHS
(b) The aggregate contribution from solar actually went up from 17:25 to 17:30 (we can see this in the yellow and gold colours, without needing to see which particular solar farms increased)
(c) There’s a massive increase in production from hydro (i.e. the blue)
(d) The grey (i.e. LHS contribution of flow north on VIC-NSW) now juts below the line
i. indicating visually that the interconnector has flipped and is flowing south
ii. this is what Dave Smith noted in his comment (copied above) as ‘counterprice flow’.
4) In the fourth annotation, we highlight two of the hydro units:
(a) We note that production from UPPTUMUT is falling:
i. From 271MW FinalMW at 17:25 (not shown here, but seen in the ‘Unit Dashboard’ widget for this unit)
ii. To 171MW target at 17:30
iii. Because the –$123.98/MWh CPD Price is below the currently dispatched volume in the $0/MWh bid band
iv. So this unit is being ‘constrained down’ to the limit of its ROCDOWN rate (i.e. 20MW/min x 5 min = 100MW ROCDOWN over the dispatch interval).
(b) In contrast it’s a very different story for TUMUT3:
i. Which increases its output – from 480MW (FinalMW for 17:25) to 1000MW (Target for 17:30)
ii. Which is well within its 360MW/min bid ROCUP rate.
iii. We see in the ‘Unit Dashboard’ widget for TUMUT3 below that this happens because all of that previously dispatched volume plus another 500MW is rebid down to the –$1,000/MWh price band:
iv. So readers might see this and understand why Allan noted above that …
‘ … Quite a few people see these events and think it’s Snowy’s bidding at Tumut that has somehow *caused* the spike.’
————————————–
* regarding the units explicitly shown in this constraint, and the ones that are invisible (but important)
As Allan noted on LinkedIn (copied above) the purpose of the constraint is to put a hard limit on flows across a particular line or cut-set in southern NSW to maintain power system security.
This in turn limits (through the equation) the amount of generation and imports from southern NSW & Victoria that can supply NSW demand:
(a) note that all the relevant generators & VIC-NSW have LHS factors close to 1, meaning that every extra MW they provide hits the constraint LHS almost 1 for 1
(b) almost all their extra output must go through the target cut-set.
So as NSW demand increases …
(a) almost all the extra dispatch has to come from NSW generators not caught in the constraint,
(b) and it’s their bidding (including ramp rate limitations) that sets the NSW price.
One interpretation (understanding that its not possible to know anyone’s motive) is that the rebidding of Snowy is essentially a response to these conditions as Snowy sees the potential for price volatility in NSW (i.e. anticipating what NEMDE dispatch will do, and how it’s different to NEMDE P5 predispatch):
(a) anticipating the price will rise because of the smaller subset of units in NSW that can supply rising demand;
(b) so seeks to maximise volume at TUMUT3.
————————————–
v. From my point of view I have noted a number of times that in a complex system it’s almost always numerous factors/changes that combine to produce an outcome.
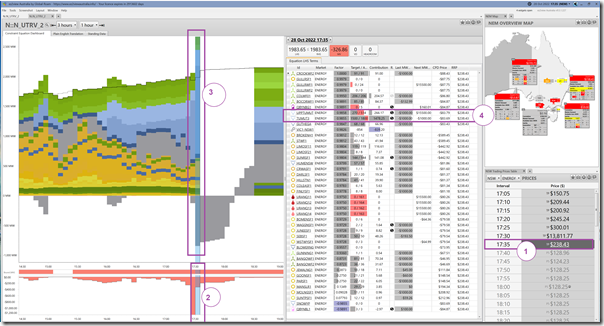
17:35 … price drops after spike
It’s also interesting to see how quickly the spike dissipated… spiking ‘out of the blue’ to 17:30, but pricing subsided by 17:35:
Again we highlight the same 4 pieces of the screen:
1) The price has subsided (down to $238.43/MWh in NSW)
2) The Marginal Value has also subsided (down to –$326.86)
3) In the stacked LHS and RHS we see several things:
(a) The RHS has risen slightly, alleviating some pressure (though the change is only small)
(b) The aggregate contributions to LHS spike up on either side of the axis:
i. Note that this has extended ‘off the top’ of the y-axis (which is the same bug already fixed with the newest release, which is currently v9.5.1.230).
ii. Above the axis is driven by a big increase in aggregate target for hydro units
iii. Below the axis is driven by a big increase in flow south from NSW into VIC (dispatch target now –854MW so a LHS contribution of –839.20MW due to a LHS factor of 0.9826)
(c) Once again its worth noting aggregate LHS contribution from Solar Farms has risen again slightly.
4) Like at 17:30 we’ve highlighted the two hydro units:
(a) For UPPTUMUT:
i. There’s a ‘$’ sign indicating a bid change
ii. The Target at 17:35 (being 270MW of 514MW available) is up from 17:30 (target 171MW of 514MW)
iii. … and we see that this is because the volume that is being dispatched (which was being bid at $0/MWh and so being ‘constrained down’) is now rebid down to –$1,000/MWh (so being ‘dispatched up’).
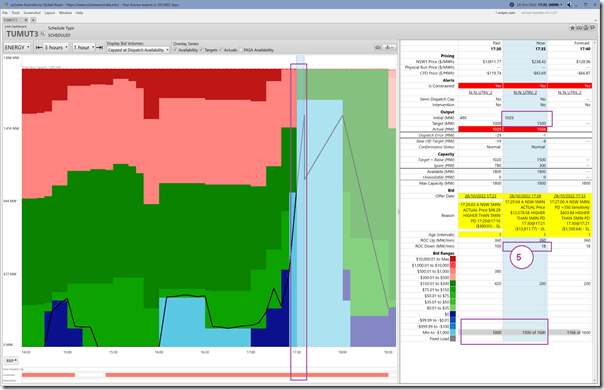
(b) For TUMUT3:
i. We see the Target at 17:35 (being 1,500MW of 1,800MW available) is up from 17:30 (target 1,000MW of 1,800MW)
ii. With more detail highlighted in this snapshot of the ‘Unit Dashboard’ widget for TUMUT3:
iii. In particular, see the increased volume now offered down at –$1,000MWh … much of which NEMDE wants to dispatch because its ‘cost’ (i.e. bid band) is lower than the CPD price at the time.
5) In the snapshot of the ‘Unit Dashboard’ widget for TUMUT3 above, we’ve specifically highlighted that the ROCDOWN rate has been lowered as part of this rebid … from 100MW/min down to 18MW/min. This does not affect dispatch outcomes at this point (as the unit is ramping up) but might affect dispatch outcomes in future, if the cheap volume is repriced to be more expensive.
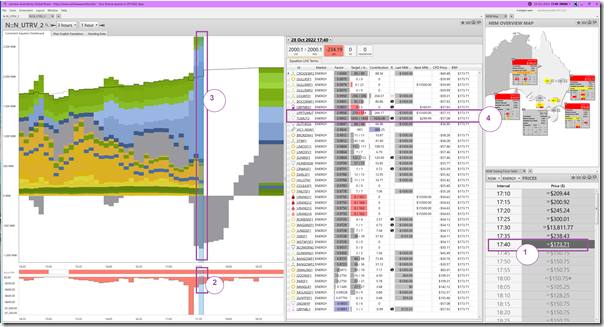
17:40 … second dispatch interval after spike
Stepping forward another 5 minutes we see the price settle further:
The same four components are highlighted:
1) Price has subsided to $173.71/MWh
2) Marginal Value has dropped further (to –$234.19)
3) On the trended chart:
(a) The RHS increases slightly again
(b) The LHS continues to show large excess above and below the axis:
i. Increased flow south NSW to VIC
ii. Increased production from hydro within NSW, but south of where the network outage is.
4) Again we look at the two hydro units:
(a) UPPTUMUT is steady at Target of 270MW:
i. Target was also this for 17:35 but the unit only made it to 258 FinalMW for 17:35.
ii. Any volume above that 270MW level is bid at the Market Price Cap.
(b) TUMUT3, in contrast, continues to be ramped upwards:
i. An additional 50MW offered at –$1,000/MWh
ii. NEMDE takes this and the other 100MW it did not take last time to fully dispatch that cheap capacity up to 1650MW
iii. Volume above this is priced at $299.99/MWh
17:45 … third dispatch interval after spike
Stepping forward another 5 minutes (for the last time) we see the price settle further:
With respect to the annotations:
1) The NSW price has dropped further (to $134.41/MWh) … but is still above the VIC price (-$38/MWh)
2) Marginal Value has dropped further (to –$189.67)
3) The LHS-RHS dance continues:
(a) The RHS climbs upwards a little further
(b) So the LHS also rises … which means:
i. Larger ‘below the line’ negative contribution as flow south NSW-to-VIC increases further
ii. Which is more than compensated for with larger aggregate positive LHS contribution … which is quite dominantly of blue colour (i.e. hydro).
4) Which means it’s worth looking specifically at these two hydro units:
(a) UPPTUMUT is unchanged in dispatch (target of 270MW of 514MW available)
(b) TUMUT3 remains fully dispatched…
i. of the 1650MW offered in the –$1000/MWh bid band
ii. with the next capacity offered at $299.99/MWh so well ‘out of the money’ compared to the CPD price of –$52.51/MWh.
(C3) One hour after the spike …
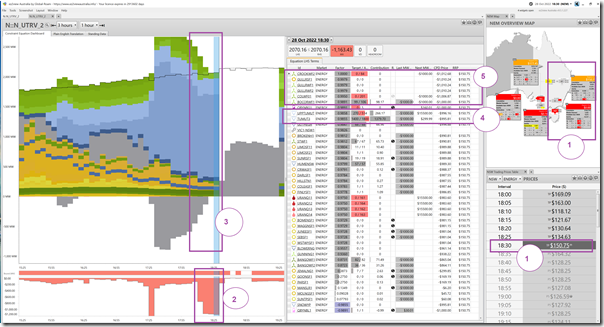
Winding the clock forward to 18:30 we take a look at what’s transpired:
With respect to the annotations, we see:
1) The price in NSW has settled (it’s $150.75/MWh) … but it’s still separated from the VIC price of $0/MWh
2) The Marginal Value of the constraint (at –$1,163.43) is still significant
3) The main chart shows:
(a) The RHS has continued to (mostly) trend upwards in the intervening period; with
(b) The LHS trending up also:
i. The ‘below the axis’ negative contribution from the VIC-NSW interconnector has disappeared
… the Target Flow = 0MW at 18:30 (this is due to Negative Residue Management constraint ‘NRM_NSW1_VIC1’ not shown here)
ii. Hence the ‘above the line’ positive contributions almost exactly add to the RHS….
… there’s a tiny negative contribution from Queanbeyan BESS load.
iii. We can see at this point that the aggregate LHS contribution is dominated by hydro units (mostly blue in the stack, and not much else).
4) Again we highlight the hydros:
(a) UPPTUMUT is at 270MW of 514MW available … which is the same as it has been since 17:35
(b) TUMUT3 is at 1400MW of 1800MW available …
i. Not shown here, but it’s been dispatched at that level since 18:15
ii. From 18:00 to 18:15 it was ‘constrained down’ progressively (slowed by the 18MW/min ROCDOWN rate noted above in the rebid) from 1650MW at 18:00
iii. Which is where it was in the prior screenshot at 17:45 (i.e. at 1650MW)
5) It’s also worth noting that the aggregate contribution from Wind Farms has reduced significantly:
(a) CROOKWF2 is now target 0MW of 83MW available:
i. Not shown here, but a review of the ‘Unit Dashboard’ widget shows that the output dropped to 0MW from 18:20
ii. This occurred when the unit’s CPD Price dropped to –$1005.68/MWh (which is obviously below its –$1000/MWh offer price)
iii. So the unit (with a ROCDOWN rate of 100MW/min) is ramped down from 85MW to 0MW in that dispatch interval.
iv. Readers should understand that this is the natural outcome of this constraint equation, as this unit has the highest LHS factor (i.e. when the negative flow south from NSW to VIC is now longer offsetting).
(b) COLWF01 is now target 0MW of 211MW available:
i. It’s a similar story with this unit (which has the second largest LHS factor of any unit that has availability)
ii. In this case (not shown here, but I can see in the ‘Unit Dashboard’ widget) the unit was ‘constrained down’ from 18:20 …
iii. But there were some glitches in the response to target, as a result of which our widget shows a derived Conformance Status of ‘Off-Target’ for the 18:20 and 18:25 dispatch interval (but that’s another story).
(c) BOCORWF1 is now target 98MW of 107MW available:
i. This one was next one down on the list
ii. In this case the ‘constraining down’ began at 18:25 when the CPD price dropped to –$1,000/MWh
We could obviously continue (i.e. every Dispatch Interval has its unique permutations), but will leave this case study at this point.
(D) Until Wednesday 30th November …
For the next few weeks, with all the background above in mind, stay tuned…


Leave a comment