On Wednesday 31st August 2022 the AEMO released the 2022 update to its Electricity Statement of Opportunities (ESOO) publication.
The ESOO 2022 is a keenly awaited update due to a number of changes that have overtaken the market in the 12 months since the publication of the ESOO 2021 on 31st August 2021 (which Allan provided a quick tour of here). These changes include:
1) Revisions to earlier published closure dates for some coal-fired power stations … with Eraring (now perhaps as early as 2025) being the most critical in terms of the ESOO 10-year outlook;
2) The various different factors (such as at least 8 identified in the QED for Q2 2022) contributing toward the 2022 Energy Crisis – which:
(a) Have provided data points to review/revise hard data used in the modelling (such as with respect to coal unit reliability); but also
(b) May also have influenced perceptions of risk in other ways and hence the decisions made in the modelling process;
3) Delays flagged to Project Energy Connect (in comparison with what was assumed in the 2021 ESOO); and
4) Concerns that are being increasingly raised (including in recent weeks) about possible delays to the major Snowy 2.0 project.
(A) Prior Caveats
Unfortunately Allan’s unavailable at this time, so I’ve had a go at picking out some of the high (and low) points that jumped out at me in the supply/demand balance projections.
In reading through the following, I’d like to remind readers:
1) that, with respect to modelling exercises in general terms, there are three reasons why I wrote ‘forecasting is a mug’s game’ back in 2016 (AEMO has my sympathies); and
2) that, with respect to the ESOO in particular, we’d asked ‘what’s the purpose of the ESOO?’ in GenInsights21 (as there seem have evolved several potential answers in the minds of different readers).
The ESOO is a critically important (and widely used) modelled view of the next 10 years of the NEM, and it does a good job of delivering. The two prior articles above might be food for thought as readers here open up the ESOO themselves.
(B) Headline ‘Reliability’ projections
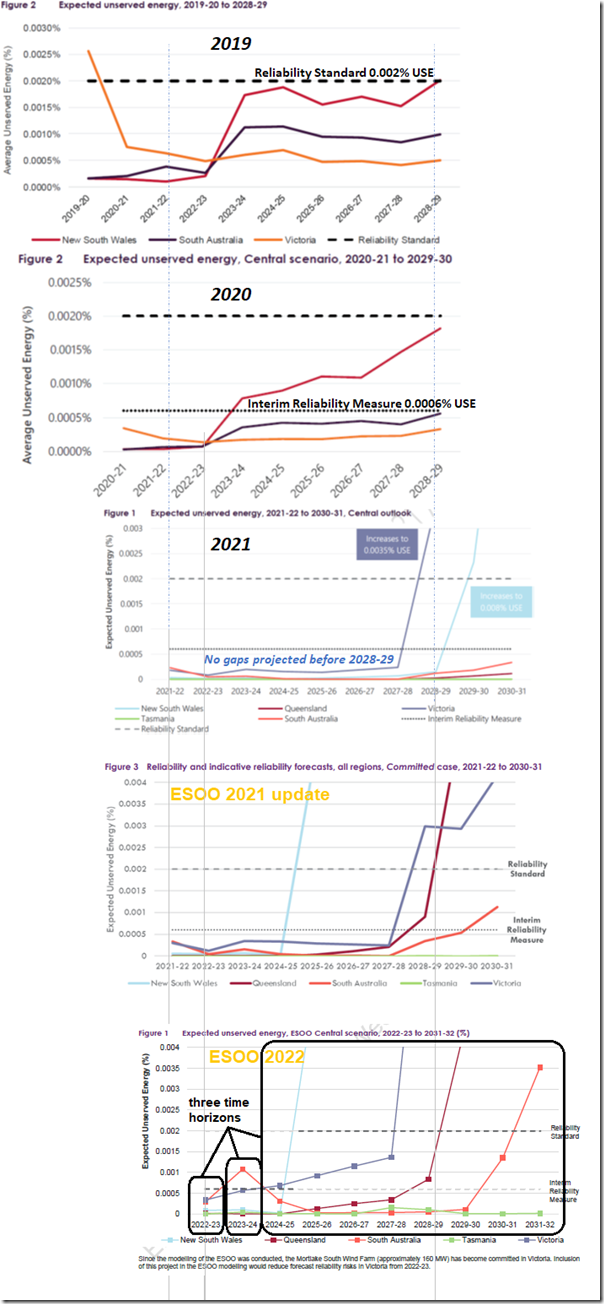
Last year Allan provided a useful comparison of the headline USE projections from the ‘Central Scenario’ published by AEMO in the 2019 ESOO, 2020 ESOO and 2021 ESOO … so I’ve added the USE forecasts under the Central Scenario for both the 2021 ESOO Update (released 14th April 2022) and now the ESOO 2022 to make it 5 forecasts in a row below:
Please accept my apologies that my graphics skills are not as good as Allan’s – as a result of which I’ve not lined the years up perfectly for the last two forecasts. Should be good enough to facilitate comparisons across forecasts for a given year, though?
With respect to the changing nature of these headline results, there’s clearly some big changes from 2021 ESOO to the 2022 ESOO (and even from the update 5 months ago). Here are several things that jumped out to me:
(B1) Understanding ‘Reliability’ … and forecasts of Expected Unserved Energy (USE)
Back in September 2017, Allan wrote ‘What does Unserved Energy actually mean – a brief explainer’ to follow on from the release of the 2017 ESOO … which forecast the possibility of Unserved Energy for (the then looming) summer 2017-18.
… as it turned out there were periods of tight supply-demand balance during that summer – particularly Thursday 18th and Friday 19th January 2018 (including the dispatch of Reserve Trader on 19th Jan 2018).
Most years since that time we’ve endeavoured to take an early look at the ESOO published in that year – and in particular Allan’s subsequent articles in this ESOO Category provide useful tips for readers to understand what these forecasts mean.
—
‘Reliability’ in the formal sense used in documents like this deals with having enough supply capacity to continuously meet varying demand:
(a) with summer demand peaks having been the most critical in most NEM regions over the past decade or so; but
(b) awareness rising that we are transitioning such that winter evening periods that will be increasingly critical in future years.
In this sense, Reliability (with a capital R) is perhaps somewhat different from what a layperson might think of when hearing the word ‘reliability’ used in more common conversation.
—
Related to that difference, it’s worth also noting how we expanded on the concept of how ‘Reliability is not Resilience’ as Key Observation #7/22 in GenInsights21 when it was published on 15th December 2021. Within the 2022 ESOO, AEMO highlights this kind of difference when it says (p7/122):
‘While this ESOO does not forecast any regions with expected USE above the IRM in 2022-23 under its Central scenario assumptions5, this does not mean there is no risk to consumer outcomes driven by weather uncertainty or other circumstances such as simultaneous generator and/or transmission outages that may erode available supply when it is required.’
(B2) Three different time horizons for considering the 2022 ESOO
My sense, in viewing the results above, is that it’s useful in thinking of them under three different time horizons … which somewhat corresponds with how the results are discussed in the Executive Summary:
(B2a) Financial Year 2022-23, particularly summer
The 2022-23 financial year is already underway, and summer 2022-23 (which might be the most at-risk period) is fast approaching. Because of the short time horizon:
1) Arguably we should have a better handle on forecast conditions (in terms of both supply and demand) than further into the future;
2) But there’s more limited capability to address any challenges identified for the period.
For the current financial year:
1) The chart above shows that there is some USE forecast, particularly for VIC and SA under the ‘Central Scenario’;
2) But that the level of USE is less than 25% of what is ‘allowable’ under the .002% USE Reliability Standard;
3) It’s also below the current 0.0006% USE Interim Reliability Standard (but not by a great margin).
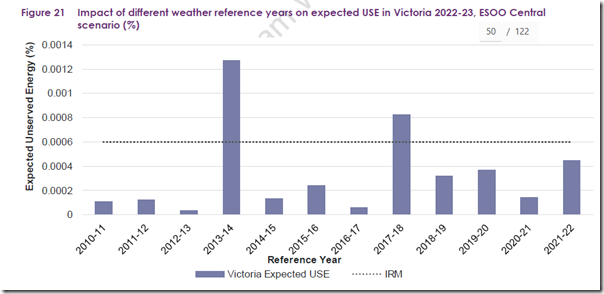
However it’s important read further to understand how the result is sensitive to what actually unfolds, in terms of weather – with the result being more extreme if the weather for summer 2022-23 ends up being more like summer 2013-14 or summer 2017-18 in Victoria:
Above that image (p50/122) the AEMO writes:
‘Historical reference years are used in the ESOO model to capture weather conditions that impact the power system, in different locations and across all times of the day and year. Alternative weather conditions impact for forecasts differently because of their effect on wind generation, solar generation, consumer demand patterns, high temperature periods for thermal plant deratings, and some transmission line ratings (those with dynamic line ratings).
Figure 21 shows the level of expected USE forecast in Victoria for 2022-23, based on each of the historical reference years modelled. Variation in expected USE is due to the relative contribution of VRE during times of high demand, the level of coincidence in demand between regions, or the length of time that consumer demands were at near-peak levels during each of the reference years. The figure shows that:
• If the weather conditions associated with the 2013-14 and 2017-18 reference years were to re-emerge next summer, the forecast level of expected USE next summer would exceed the IRM.
• The weather patterns in all other reference years would lead to much lower levels of expected USE.’
Hence it’s important to remember that the results presented in the summary chart above represent a smeared average across a range of reference weather profiles modelled.
The BOM seems to have firmed on it being La Nina again (for the 3rd year in a row), so perhaps one might expect summer 2022-23 to be much like summer 2021-22 and summer 2020-21.
(B2b) Financial Year 2023-24
In the AEMO’s Executive Summary they bundle everything else together under a ‘Beyond 2022-23’ header … but for me it makes more sense to look at financial year 2023-24 discretely because:
1) There’s a noticeable change between prior forecasts (even the 2021 ESOO Update under 5 months ago) and now – with both SA and VIC now forecast to see levels of USE at or in excess of the Interim Reliability Standard; and
2) It’s now only 10 months till the start of that financial year, which precludes some options that might be put in place to address.
The AEMO notes (p11/122) that:
‘In South Australia in the T-1 outlook period of 2023-24 for the RRO. A T-3 reliability instrument already exists for this period, hence AEMO is requesting a T-1 reliability instrument of the Australian Energy Regulator (AER) for this region and period.’
(B2c) From 2024-25 forward 7 years
Further out into the future, the forecasts will be more imprecise – but there are also more levers that can be pulled in ensuring that the supply-demand balance is sufficient prior to those periods actually arriving.
1) There are clearly concerns flagged for 4/5 of the regions of the NEM at various timings in that 8-year window.
2) These concerns are bigger and/or earlier than in the 2021 ESOO.
It’s worth particularly noting that AEMO writes (p11/122) that:
‘In New South Wales in the T-3 outlook period of 2025-26 for the RRO. AEMO is requesting a T-3 reliability instrument of the AER for this region and period.’
… but also that:
‘In the 2020 ESOO, AEMO reported a reliability gap for New South Wales in 2023-24, which resulted in the AER creating a T-3 reliability instrument. As this reliability gap is no longer forecast, AEMO is advising accordingly.’
(C) Other quick observations
Skimming through the rest of the report, a number of things jumped out at me that might be worth flagging:
(C1) Consumption (average demand) and Peak Demand forecast to grow
In something that might be a surprise to some readers given the decade-long conversation that’s been occurring about declining demand, at a number of points in the document the AEMO refers to projections for increasing demand. On p24/122 the AEMO notes the following:
‘• Expanded production from large industrial customers in Victoria and South Australia contributes to a forecast growth in electricity consumption from 2022-23 in these regions, compared to the 2021 ESOO and the Update to the 2021 ESOO.
• Electrification, particularly of businesses, and take-up of EVs are the primary drivers of operational consumption being forecast to grow by approximately 15% over the next 10 years.’
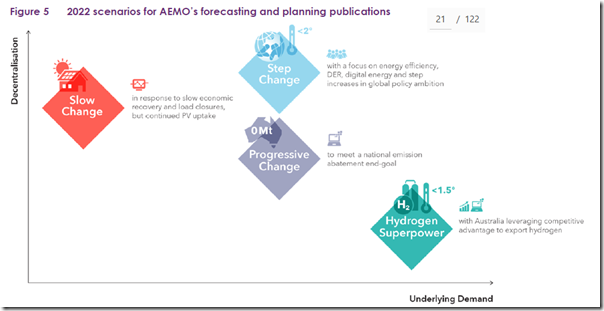
… part of this growth comes from the AEMO’s decision to adopt the underlying ‘Step Change’ scenario (per the 2022 ISP) as the Central Scenario … something that I don’t think was the case for the 2021 ESOO.
—
Whilst the longer term uplift due to electrification and so on is of interest, it’s also a longer-term effect with the size of the effect dependent on the scenario assumed. What’s of more interest to me personally is that the forecast higher operational demand for financial year 2022-23, which the AEMO says (p30/122):
‘The higher value forecasts are mostly due to forecast expansion in LILs, particularly in South Australia and Victoria but not Tasmania, as well as electrification and projected increase in underlying demand. LIL forecast demand is only slightly higher in Queensland than in the 2021 ESOO, with the higher values also due to increases from forecast underlying demand, in particular cooling load in response to high temperatures.’
Given that a part of our business is serving Large Industrial Loads (LILs) like those mentioned here (such as highlighted here), I’d be interested to learn more about where the forecast expansion is coming from? There may well be more explanation deeper in the ESOO or its supporting documents, but I did not see this in a quick scan.
In contrast to average and peak demand, the 2022 ESOO continues the theme of accelerating decline forecast for minimum demand levels. That’s not really a surprise, though.
(C2) Considerable uncertainty in additions and withdrawals
In the Executive Summary (Part 1) of GenInsights21 we wrote:
‘- Variability and Uncertainty are increasing
– Risks are Increasing
– Complexity is Increasing’
… and this resonated with PV Magazine, who wrote ‘Variability compounding complexity compounding risk’ upon its release.
—
My sense is that what we see in the ESOO 2022 is another illustration of this change in state, with an enormous difference in supply-demand balance permutations possible depending what scenario unfolds in the next 10 years – both:
1) On the supply side:
… both with significant withdrawals of existing capacity and significant additions of new capacity to consider. This diagram from chapter 3 illustrates the scale:
With respect to this new capacity, the different types of capacity possible – and particularly the distinction between ‘Anytime/Anywhere Energy’ and ‘Keeping the Lights on Services’ – being another dimension of complexity).
When I see the image above, and read the associated commentary in the ESOO (e.g. about not enough of the prospective developments being Committed at this point) I’m reminded of the ESB’s high-level design paper for the Capacity Mechanism, and in particular where it writes (p5/84):
‘The uncertainties facing investors have never been greater. Demand uncertainties include the speed of post-covid recovery, the longevity of major users such as smelters, and the timing and scale of trends like electrification of gas and transport. On the supply side, investors are grappling with the disruptions and uncertainties in the supply chain due to the pandemic, and now war in Ukraine. More fundamentally, despite notice of closure provisions, the exact closure timing of the large, thermal plant closure is uncertain. In a market where demand has been relatively stable for several years, it is difficult to make a case for new investment until a clear gap in the market has been established. A ‘wait and see’ approach from investors is a rational response to such uncertainty. But widespread ‘waiting and seeing’ will risk too little capacity being available and new capacity arriving too late. It also increases the likelihood that jurisdictions will feel forced to intervene – which, in turn, can create another source of uncertainty for investors.’
Whilst the ESB seems to have been side-lined in further development of this mechanism whilst State Governments ‘go it alone’, the underlying challenge still remains.
2) On the demand side…
… with the different types of scenarios identified for consideration seeming to be much broader in possibility than was the case 10 years ago, say:
As a result, there’s considerable uncertainty/complexity/risk in the task of ‘sticking the landing’ of this energy transition.
Whilst the industry has made some big steps since I made this forecasts (of sorts) back in mid-2017, I can’t help feeling concerned that it’s going to be a long bumpy road ahead through to 2040 or 2050 (well past the 10 year horizon of this ESOO).
(C3) Demand Response estimated to be low?
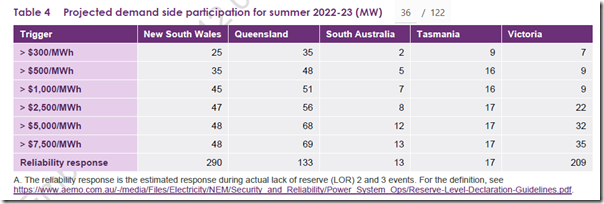
As previously described here, we’ve been keen supporters of a certain form of Demand Response in the NEM since its early days, and many of the large energy users who have been with us as clients have been that way for 10 or even 15 years. For that reason I was interested to see this table presented to summarise how much demand response AEMO has assumed in the central scenario:
Above the table, the AEMO says:
‘Projected DSP across the NEM for summer 2022-23 is 662 MW as shown in Table 4. Compared to the 2021 ESOO, AEMO is forecasting:
• Lower DSP for New South Wales and Victoria, following lower development of WDR than estimated in the 2021 ESOO.
• Lower DSP in South Australia, given less observed DSP last year than was forecast.
• Higher DSP in Queensland, as observed DSP was higher than forecast in the last year following increasing periods of high price events.’
We’ve similarly been underwhelmed with the scale of the registration of Negawatts in the 10 months since the commencement of the Centralised Negawatt Dispatch arrangement on 24th October 2021 – but that’s not the only form of demand response.
Thinking more broadly, the numbers seem low to me … but I’d need to read and consider more to be able to comment further. On the upside, this is the first time I can remember seeing price trigger levels included in documenting what’s been assumed.
(C4) Generator Forced Outage Rates
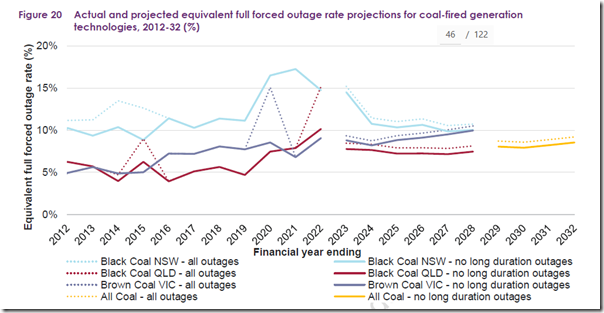
In section 3.4 there is also discussion about the assumptions used for Equivalent Forced Outage Rates (EFOR) for coal units, with the AEMO in the ESOO reporting on an aggregate basis for each region:
This makes for a great summary, but I’m not sure what’s actually used in the modelling (e.g. whether this is broken down to individual unit or station based on their own history, or whether this region-level average is used for all in the region). Perhaps one of our more knowledgeable readers can clarify in a comment?
Given we completed our own analysis of coal unit historical performance to classify outages in several categories for Appendix 20 in GenInsights21, we’ll be interested to review this in more detail.
(C5) Modelling unplanned outages affecting inter-regional flow paths
I’m not sure I’ve seen it before (or at least, if I did, it did not stick in memory) that the AEMO …
… ‘applies transmission unplanned outage constraints for some simulated unplanned outages on key inter-regional transmission flow paths, as summarised in Table 5.
AEMO consulted on and updated the methodology for inter-regional transmission unplanned outages in 2022. As such, flow path selection and outage rates have varied from the 2021 ESOO, consistent with the updated methodology. Four flow paths were selected for the 2022 ESOO, compared to the six that were included in the 2021 ESOO, and the unplanned outage rate for Basslink has been revised upwards as it now incorporates the potential for further long duration outages.’
It’s nowhere near a full set of outage-related constraint equations, but it is a step that provides a more realistic modelled result.
(C6) Uncharted territory by 2024-25 … if not beforehand
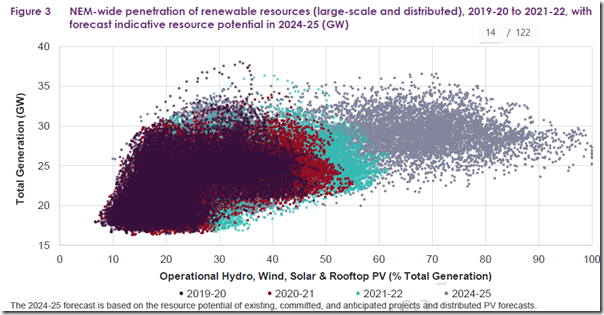
On p14/122 the AEMO provides an update of the ‘instantaneous penetration of renewables’ charts that has featured in a number of publications in recent years:
… by way of illustrating some challenges that are fast approaching, in terms of
Whilst I can understand why renewable resources are all bundled together in this chart, to my mind it would provide a clearer view of the challenge if this representation were just to show wind and solar – with both of these (and not hydro) possessing two of the characteristics that define the main features of the underlying challenge that (it appears to me) AEMO is speaking to here:
1) The intermittency of the underlying fuel source; and
2) The non-synchronous nature of the power generation.
It’s the approach we have taken, for instance, in describing those sources as ‘Anytime/Anywhere Energy’ through GenInsights21 and in the GRC2018 beforehand.
Leaving that quibble aside the chart does illustrate the very fast approaching nature of ‘uncharted waters’ that have not yet been successfully addressed successfully in any major grid anywhere around the world. The AEMO follows the chart by noting this:
‘A high proportion of this renewable generation is from inverter-based resources (IBR, meaning wind and solar generation, including distributed PV). With AEMO’s current operating toolkit, it would not be possible to maintain the power system securely under these conditions, which is why AEMO has the goal to be able to operate the power system at 100% instantaneous renewable generation by 2025.
Through the Engineering Framework, AEMO is working with stakeholders to establish a structured approach to preparing for these high renewable periods. In June 2022, AEMO released the NEM Engineering Framework Priority Actions report, outlining 46 near-term priorities. In parallel with working through these near-term priorities, AEMO is also working towards a publication in late 2022 that explores pathways to operating with 100% instantaneous penetrations of renewables.’
Different readers are naturally going to read this with different perspectives in mind … some being ‘glass half full’ and some being ‘glass half empty’. For me, despite the significant amount of work performed in the Engineering Framework, such as this ‘Initial Roadmap’ from December 2021, it’s clear to me that:
1) The challenge is enormous; and
2) Success is by no means guaranteed.
In the context of the forecast Reliability assessment in the ESOO, it’s worth remembering that even if there is forecast to be enough capacity from a Reliability standpoint, other factors flagged in the Engineering Framework might preclude this operating as envisaged in 2024-25 because other preconditions have not been met … hence presenting other risks to Security of Supply (also what the layperson might term ‘reliability’).
(C7) But wait, there’s more…
I’ve run out of time in this first skim of what’s in the ESOO but will be very interested to continue working through the document in the days and weeks ahead (and also to seeing what the general reaction is to the ESOO amongst the broader stakeholder group).




The root of the problem is obvious as we speak, there is a nation-wide wind drought which means in an hour or two there will be next to no RE across the nation and no amount of additional installed capacity will make a scrap of difference.
At present we have no grid-scale storage from pumped hydro or batteries and there is none in sight in the foreseeable future. The absurdly hyped “big batteries” are only useful for FACs, not carrying baseload through wind droughts.
The so-called transition to green energy has gone as far as it can go until nuclear power is up and running. It is time for the public and the politicians to face the facts and commentators in the industry should be explaining this.
Great Article.. “winter evening periods that will be increasingly critical”. The calm cloudy winters which may last for months, like 2010, will outlast any possible storage even the great 350 GWh of Snowy2. It will probably happen again before 2030. I think “Success is by no means guaranteed” is a positive spin.