The Callide C4 Catastrophe (which occurred just under 2 weeks ago now, the effects of which are still being felt) has caused many to wonder about the effect it will have on electricity pricing.
For instance, in the AFR (today’s print edition) Angela Macdonald-Smith and Mark Ludlow write how ‘Callide outage feeds 60pc power price surge’ – referencing comments from JPMorgan analyst Mark Busuttil, and Josh Stabler at adviser Energy Edge.
… and on Tuesday morning I saw that Perry Williams had written ‘Shock in store as outages, cold weather and demand cause power price surge’ in the Australian, published Monday evening.
… also on Tuesday morning, I noticed David Leitch had written ‘Price explosion: Gas producers clean up as sun goes down in post Callide world’ on RenewEconomy yesterday.
So I thought I would quickly pull together a few artefacts using our NEMreview and ez2view software applications to provide some context to the discussion:
(A) Trended spot prices since 1st January 2021
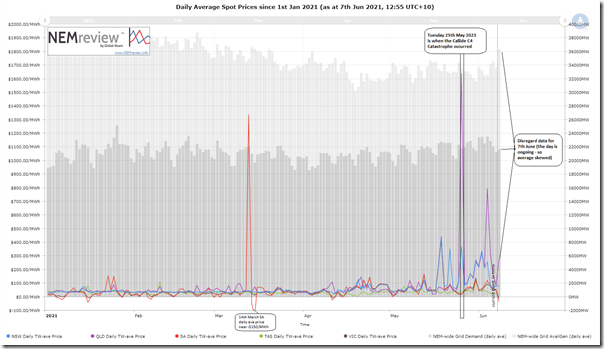
In the first chart (query is here for those who have access to their own licence to NEMreview) I’ve trended daily average data since the beginning of the year:
We can clearly see that:
1) Prices in QLD and NSW have shifted up following the 25th May event:
(a) Tuesday 25th May was obviously a big price day (daily time-weighted (TW) average up at $1637.60/MWh in QLD),
(b) and with Thu 3rd June being 2nd highest ($792.97/MWh in QLD)
(c) but also Sun 30th May, and Tue 1st June, and Wed 2nd June, already documented here).
2) … but also note that there was some volatility in NSW and QLD earlier in May before it happened:
(a) Such as Wed 12th May and Mon 17th May
(b) We’d been preparing some analysis of this prior to the Callide event in any case (we may never get back to that!)
Less clear is that:
3) There’s also been a shift upwards in prices in VIC and SA (which makes sense, given the interconnected nature of the NEM).
4) Not so much for Tassie.
(B) Trended contract prices since 1st January 2021
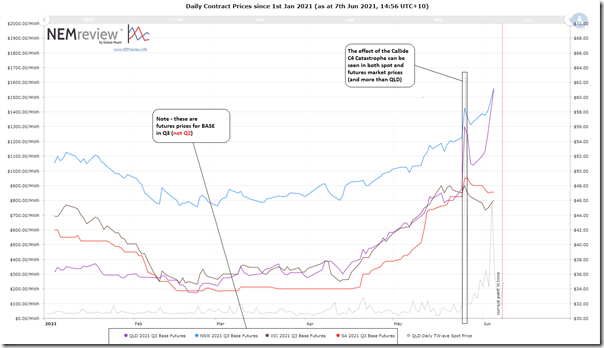
Also using NEMreview (query for this one is here) we look at end-of-day clearing prices for Base-Load Futures from ASX Energy … for Quarter 3 2021 (i.e. not Q2):
We can see a number of other things:
5) Prices for these commodities had been increasing for all regions from about mid-April (i.e. well before Callide happened).
6) The events of that day did provide a shock for all regions
7) Whilst VIC and SA have steadied out, prices for QLD and NSW have continued to climb (QLD sharply since Friday 31st May, perhaps on the release of the ‘long outage’ update?)
(C) Trended Bid Stack straddling 25th may
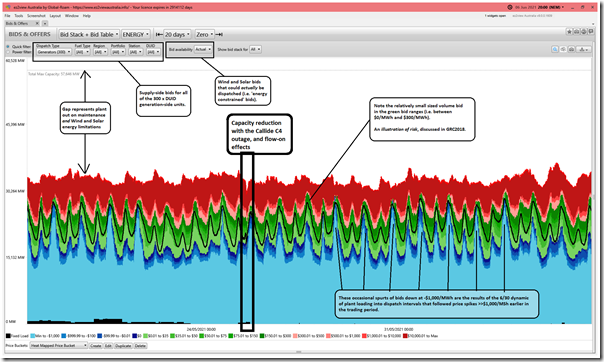
Pulling out an in-testing copy of ez2view v9 (for 5MS – so beware, there may be bugs!) I’ve dialled up a 20-day timeline of ‘as dispatched’ (including ‘true bids’ reflecting energy constraints on Wind and Solar Farms) bids on a 5-minute basis through until late yesterday (Sunday 6th June), and so straddling the May 25th Callide event:
When we look at bids aggregated up on a NEM-wide basis:
8) The drop in capacity that followed the Callide C4 Catastrophe can be clearly seen in the timeline….
9) However on a NEM-wide basis, the (still) missing capacity (i.e. 4 x Callide units still offline till they start returning on the coming weekend) has been effectively replaced by other plant coming back from maintenance. Obviously there are regional differences, though, as we will see below!
10) I’ve also highlighted the large amount of capacity either offline for maintenance through this period or unable to generate because of lack of wind or sunshine.
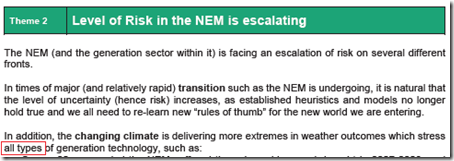
11) When we compiled the Generator Report Card 2018 over 24 months ago, we highlighted the declining volume of ‘green’ bids as one of the illustrations of how ‘the Level of Risk in the NEM is escalating’:
(a) That particular page from the GRC2018 we copied out into this ‘Longer-term trends of low (and high) dispatch prices…’ article on 30th August 2019. That trend has not gone away, and we will look forward to publishing an update in GenInsights21!
(b) In the more recent/granular chart above, we can see clearly how blue (i.e. $0 and below) and red (i.e. above $300) bids clearly outweigh the green
(c) But this was clearly also the case before 25th May!
(d) What has changed is the shifting of volume within green to higher prices.
12) The 5/30 issue has delivered some quite pronounced spikes in blue bids – with 1,000s of megawatts of capacity shifted in response to dispatch price spikes towards the start of the trading period (like after 17:05 this evening in QLD, coincidentally).
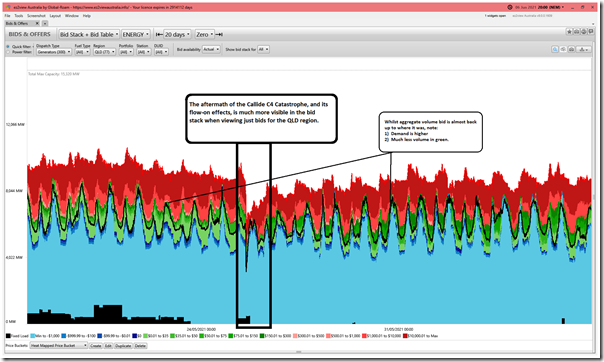
Here’s the same view, now filtered down to (just) generators in the QLD region:
As noted:
13) The Callide dramas are much more clearly visible
14) The capacity offered is still below where it was ~20 days ago (though it did climb significantly through the remainder of the 25th May as more capacity came back online).
15) There has been a noticeable reduction of volume offered in green and, for what is (left) in green, it has shifted to higher priced bid bands
16) Note also that ‘consistent’ demand has increased, compared to days preceding 25th May.
(D) Cue the ‘gaming the market’ accusations!
…. but before people get on their hobby horse with accusations of ‘gaming the market’ and so on (not referencing the AFR article above), I would suggest that they first think about what the loss of electricity supply from Callide has meant (temporarily) more holistically on demand for fuel supplies for the remaining thermal stations, and what that might have meant for such things as:
1) the broader gas network, and also
2) thermal coal stockpiles onsite, and
3) and broader considerations of risk/reward (i.e. sell too much product now and you may not have enough to sell when demand spikes and the wind/solar lulls and you really need it).
It makes sense that (for generators who can still supply) the structure of their bids after 25th May will be non-trivially different than the structure of their bids before 25th May (it’s a market – and one that uses marginal pricing, and the broader market situation has changed significantly).
The same sorts of accusations were made following the sudden closure announcement of Hazelwood, but (in my view) not really properly thought through.
1) Isn’t it time we matured a more realistic view (and conversation)?!
2) We’re going to need it, in the energy transition that has a decade or two still to complete …


Paul Paul Paul, when you say ‘the transition has one or two decades to go”, you imply an end to The Transition!
We all know there is no end, because who in their right mind thinks we’ll be powered by intermittent dispersed low density low efficiency generation?
There is no “one or two decades of transition” with wind and solar – it’s a transition in perpetuity. Transition implies an end point. You’ve assumed 20yrs.
But how many wind turbine sites are refurbished with new turbines after 20yrs? How many solar farms? Batteries?
A sane transition would be from one technology to another technology that delivers improvements in the major facets of energy delivery:
– density
– efficiency
– cost
– footprint
– mining (number of holes in the ground)
– waste
– pollution
– manufacturing, refining, transport
– transmission
Wind and solar improve very few of these facets of energy delivery, and actually make some worse.
Ben, Ben, Ben, [kiddo], since you did not care to provide any numbers or analysis to support your assertions about what matters and how technologies compare, perhaps I can help you out. I’ll do one, then you do one.
Let’s take density/footprint, and compare Liddell [1GW] with the Forest Wind project [1.2GW]
Liddell itself, not accounting for the coal mines, etc takes up about 2 km square, which isn’t usable for any other purpose. Forest Wind’s footprint will consist of 226 30-m circular foundations, adding up to 0.16 km square. All access roads already exist. There will be temporary extra space required for construction, but that can go back to forest afterwards. See https://www.forestwind.com.au/project-overview Therefore this wind farm, conservatively, is FIFTEEN TIMES more footprint efficient than a coal fired thermoelectric power station. This is generally the case for wind farms – while they are spread over a large area, their footprint is small, and the ground space in between is generally fully usable for farming or conservation.
Your turn.
Jaz, that’s more spin than a wind turbine, which isn’t hard…😂.
Seriously though, there are serious problems being baked into the system, and very few signs of anybody arresting the decline.