This article is Part 2 of an expanding Case Study pertaining to the 17:05 Dispatch Interval on Thursday 27th October 2022, and follows on from Part 1, which was published last week on Thursday 9th March 2023.
1) At the 17:05 dispatch interval, we calculated an Aggregate Raw Off-Target measure of +871MW across all of 152 x Semi-Scheduled (i.e. Wind and Solar) units operational at the time. That’s a large size collective deviation away from target … and the second largest that’s ever occurred for Semi-Scheduled units, collectively.
2) The largest-ever instance (at +894MW):
(a) Occurred in the extraordinary circumstances when multiple wind farms simultaneously tripped (due to incorrectly configured protection settings, subsequently fixed) as one lead-in trigger that cascaded into the SA System Black on 28th September 2016.
(b) So the relative nearness of the more recent large excursion (only 23MW lower) provides some guide to the considerable significance of the event on 27th October 2022, albeit that (as noted here), the two events are not identical:
i. The spread of the large excursions was much greater (not just in SA), as seen in Part 1; and
ii. It is almost* certain that the time-span of the event was slower (not instantaneous simultaneous trips).
* can’t be absolutely certain until we actually look at higher-speed data, but seems very likely
3) This case study follows on from the article ‘Some revelations in GenInsights Q4 2022 about Aggregate Raw Off-Target for Semi-Scheduled units’ which noted ongoing escalation in the incidence of larger collective deviations away from Target (i.e. ‘Aggregate Raw Off-Target’ ) across all operational Semi-Scheduled units. That article drew from data compiled earlier for the GenInsights Quarterly Updates for Q4 2022.
In Part 1 we showed graphically how there were 14 x DUIDs that contributed large deviations of under-performance (i.e. AggROT >20MW), whereas there was only 1 x DUID that contributed large deviations of over-performance (i.e. AggROT <-20MW) .
1) Clearly in this Dispatch Interval there was an imbalance
(a) and we saw that (in Part 1) for all of the 23 x dispatch intervals we analysed for the late afternoon on Thursday 27th October 2022;
(b) the broader trend of deviations suggests this is systemic.
2) That there was this asymmetry of performance across all units:
(a) Does not surprise us, because of the asymmetry in the incentives contained within the mechanisms of the Semi-Scheduled category itself
(b) … in other words, it’s a design feature of the way the category currently runs.
3) But, as noted in Observation 13 within GenInsights21, we are increasingly wondering … ‘is the Semi-Scheduled category sustainable or scalable?’.
With this in mind, let’s continue to look further into what happened on 17:05 – starting with a tabulated summary of those ‘top 15 deviations’:
| Fuel Mix | Region | DUID | Calculated AggROT |
|---|---|---|---|
|
Solar Farms (7 of 15 units listed) |
QLD |
HAUGHT11 |
+31MW |
|
NSW |
DARLSF1 |
+93MW |
|
|
NSW |
LIMOSF11 |
+99MW |
|
|
NSW |
SUNRSF1 |
+84MW |
|
|
NSW |
SUNTPSF1 |
+51MW |
|
|
NSW |
WELLSF1 |
+40MW |
|
|
SA |
BNGSF2 |
+46MW |
|
|
Wind Farms (8 of 15 units listed) |
VIC |
ARWF1 |
+51MW |
|
VIC |
CROWLWF1 |
+64MW |
|
|
VIC |
MUWAWF1 |
-47MW |
|
|
SA |
BLUFF1 |
+25MW |
|
|
SA |
HALLWF1 |
+43MW |
|
|
SA |
HALLWF2 |
+36MW |
|
|
SA |
NBHWF1 |
+32MW |
|
|
SA |
PAREPW1 |
+46MW |
|
|
Subtotal of the 15 x DUIDs above (both Solar Farms and Wind Farms, across mainland regions). |
+ 695MW (noting the above are rounded) |
||
|
Residual Effect of all the other 137 x DUIDs (both Solar Farms and Wind Farms, across all regions). |
+ 166MW |
||
|
Aggregate Raw Off-Target across all 152 x Semi-Scheduled DUIDs operational on 27th Oct 2022 |
+ 861MW |
||
I’ve flagged in red the single row above (and in the list below) where one unit of 152 significantly over-performed. Collectively, we ask you keep these units in mind when working through the rest of Part 2 of this Case Study…
(A) Was a common weather system a common cause (across Solar and Wind)?
Looking at the table above, it strikes me that the main geographical location of the large deviations are:
1) Solar Farms in southern and south-west NSW; and also
2) Wind Farms across VIC and SA.
… which makes me wonder whether there was some weather system that could have possibly contributed to the collectively large deviation?
That might be the subject of a subsequent part to this expanding Case Study …
(B) Looking at specific DUIDs
For each of the 15 x DUIDs listed in the table above (and a couple extras) I’ve used the power of the ‘Unit Dashboard’ widget in ez2view v9.6 combined with the ‘Time Travel’ capability to wind back the clock back to 17:05 on Thursday 27th October 2022 and look specifically at what appears to have been happening with each of the units listed.
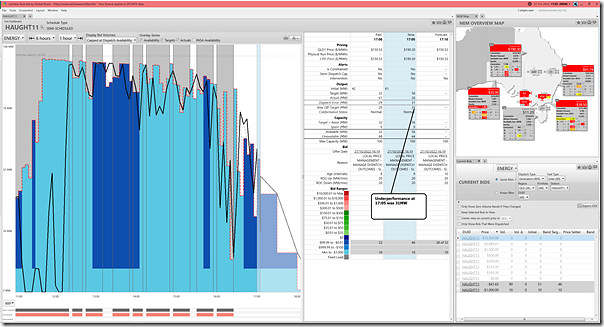
1) HAUGHT11 (Solar in QLD)
Of all the solar Farms on QLD, the Haughton Solar Farm was the only one displaying large under-performance:
This unit (one of relatively few not subject to a bound constraint):
(a) was expected to drop its output slightly
(b) … but for some reason (cloud cover, perhaps?) its output dropped much more significantly.
(c) Looking at the see-saw history in the chart, there are some indications that there may have been intermittent cloud cover that afternoon (or perhaps some other cause).
In the 17:05 dispatch interval, we see an under-performance of 31MW.
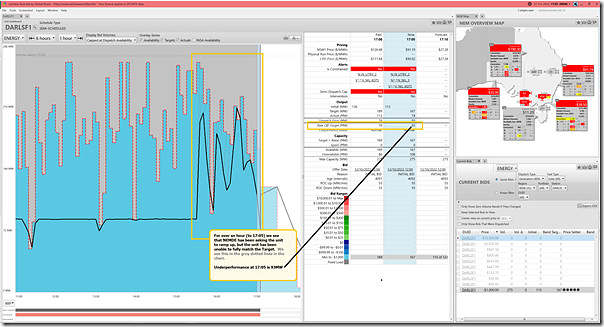
2) DARLSF1 (Solar in NSW)
Into NSW there are a number of Solar Farms located in reasonably close proximity that were all collectively under-performing. The first of these (alphabetically) was Darlington Point Solar Farm:
The underperformance here (93MW) is the second-largest seen of the Semi-Scheduled units in this dispatch interval.
Also flagged on the chart component of the ‘Unit Dashboard’ is that the unit has missed a number of its Targets to increase output over the recent ~1 hour period:
(a) this is seen in the dotted grey lines angling upwards reflecting what the anticipated output would have been;
(b) the reasons for these misses are unknown at this point.
It’s also worth noting that this unit (bidding down at –$1,000/MWh at the NSW RRN) is flagged as being involved in setting the price (note the icons in the ‘Price Setter’ column in the ‘Current Bids’ widget in the bottom-right of the display:
(a) Yet we see the NSW RRP at this dispatch interval was above $0/MWh (it’s shown as $91.19/MWh in both the ‘NEM Map’ widget and the ‘Unit Dashboard’ widget).
(b) There are also other solar farms shown below to be involved as a ‘Price Setter’.
(c) We’ll look at this briefly in Part 4 of this Case Study (still to come).
Finally, worth highlighting that this unit is flagged as being on the Left-Hand Side (LHS) of three different bound constraint equations:
(a) These constraint equations are illustrated at the bottom of this note
(b) However before even scrolling down to have a look, understand that this unit was not ‘constrained down’ by these constraints.
i. We know this because the Target in this dispatch interval (167MW) equals the Availability for the dispatch interval (167MW).
ii. Delving into the gory details of each of the three constraint equations below, we see that:
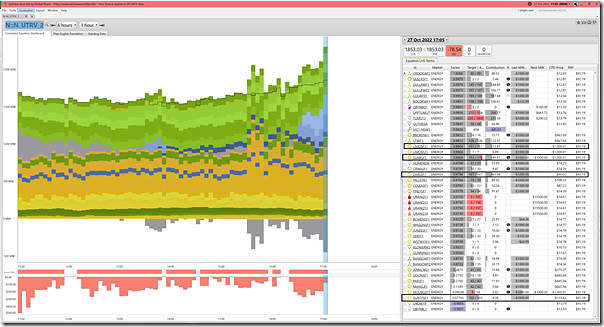
1. In terms of the ‘N::N_UTRV_2’ constraint equation , the LHS factor pertaining to DARLSF1 was +0.9784 (i.e. close to +1.0) but there are 18 other LHS terms above it when ranked on LHS factor;
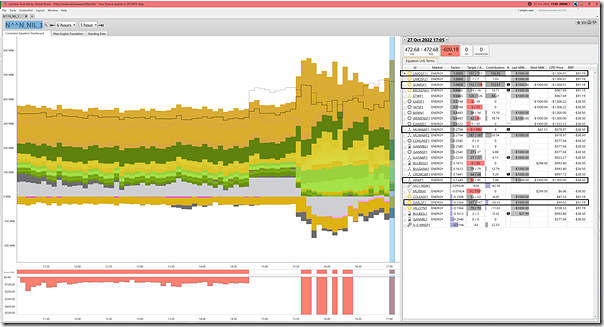
2. In terms of ‘N^^N_NIL_3’ constraint equation, the LHS factor pertaining to DARLSF1 was -0.1566 (i.e. negative, so acting to try to ‘constrain up’ the unit’s output);
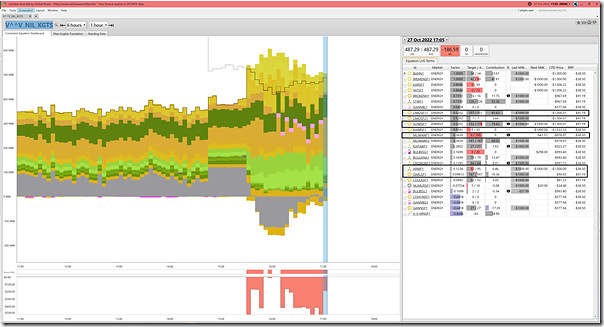
3. In terms of the ‘V^^V_NIL_KGTS’ constraint equation, the LHS factor pertaining to DARLSF1 was 0.09813 which is much lower than +1.0 and also has 18 other LHS terms above it on the list.
… hence we can gain some understanding of why these constraints, co-optimised together by NEMDE, had no effect on DARLSF1.
3) LIMOSF11 (Solar in NSW)
Close to Darlington Point is the Limondale 1 Solar Farm:
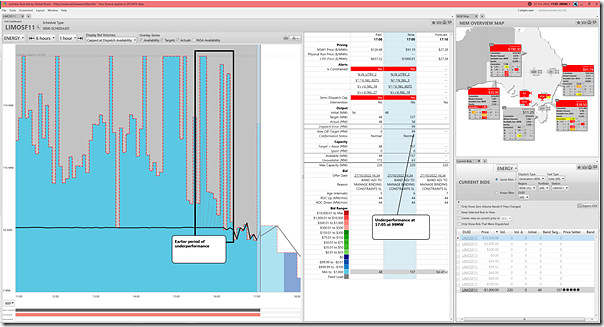
The under-performance here (99MW) is the largest seen for Semi-Scheduled units in the 17:05 dispatch interval (the focus for this Case Study).
Similar to nearby Darlington Point:
(a) This unit is subject to four different bound constraint equations:
i . Constraint equation ‘N::N_UTRV_2’
ii. Constraint equation ‘N^^N_NIL_3’
… which is otherwise known as the ‘X5 constraint’, and has been explored in articles here beforehand.
iii. Constraint equation ‘V^^V_NIL_KGTS’
iv. Constraint equation ‘V>>V_NIL_18’
(b) But again we can see (because Target = Availability) that the constraints have not affected this unit … and seeing the location of this unit in the LHS of each constraint (below) we can start to understand why.
(c) Similarly to Darlington Point, but perhaps more markedly, this unit has also missed a number of attempts to ramp output up via the Target. Time permitting we might think more about this in a subsequent edition to this Case Study.
(d) Similarly to Darlington Point, this unit also bid down at –$1,000/MWh and is denoted a ‘Price Setter’ (despite the positive dispatch price).
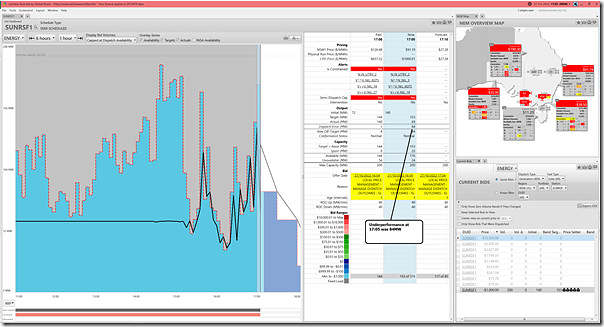
4) SUNRSF1 (Solar in NSW)
Third solar farm in NSW in this subset (alphabetically) was Sunraysia Solar Farm:
It’s also the unit with the third largest under-performance (84MW). In this case:
(a) the unit was given a Target for a modest rise in output, yet suffered a significant drop.
(b) This unit is subject to four different bound constraint equations – and, unlike the two other NSW units above, does look to have been ‘constrained down’ slightly:
i. We can see its Target (158MW) is lower than its Availability (176MW); and
ii. We can also see the CPD Price (-$1,000.01/MW) is below its Bid Price (-$1,000/MWh).
iii. We can see this below with the ‘Constraint Dashboard’ widget views.
(c) As with the earlier two, this unit is also marked as a Price Setter.
(d) As with the earlier two (but not to the same extent) there are also earlier periods of under-performance visible in the chart.
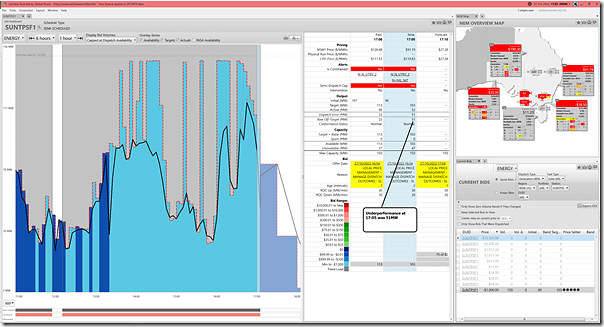
5) SUNTPSF1 (Solar in NSW)
Next in the list is the Suntop Solar Farm:
This is another unit that:
(a) Was expected to ramp up (90MW to 103MW), yet was subject to an unforecast drop in output (90MW to 52MW) … so an under-performance of 51MW;
(b) It’s also another one flagged as ‘Price Setter’
(c) It’s also subject to two bound constraints … though not ‘constrained down’ by them.
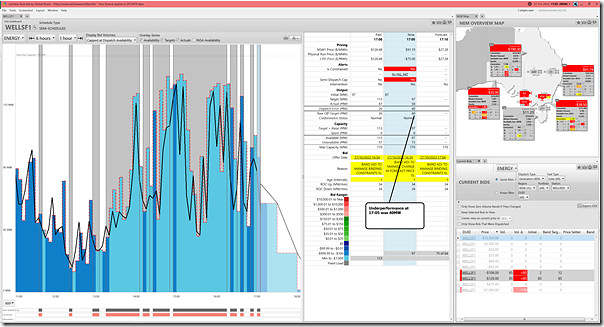
6) WELLSF1 (Solar in NSW)
Fifth solar farm on this list in NSW (alphabetically) is the Wellington Solar Farm:
This is a unit that:
(a) Was expected to ramp up (by ~10MW) but experienced an unexpected drop (~29MW), which equates to 40MW under-performance (with rounding).
(b) Was subject to only one bound constraint:
i. Which can see delivered a CPD Price of –$75/MWh, but the bid volume (being down further, at –$106/MWh and then -$120/MWh) was still sufficiently low to avoid effect.
ii. We can also see that the Target = Availability, so can confirm the unit was not ‘constrained down’.
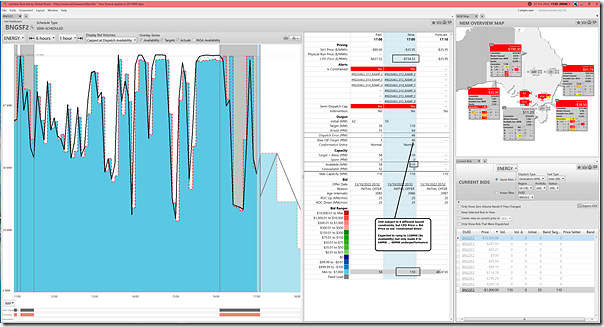
7) BNGSF2 (Solar in SA)
For the last of the 7 solar farms we skip into South Australia to see the Bungala 2 Solar Farm (which, incidentally, is the newer stage of the Bungala 1 Solar Farm which was one focus of Dan’s article on Monday):
The under-performance for the Bungala 2 Solar Farm was 46MW. With this unit:
(a) It was subject to 6 different ramping constraints:
i. Which are not illustrated below;
ii. But which we can see had no effect on this unit in any case, given that:
1. The Target = the Availability (both 110MW); and
2. The CPD Price (-$734.32/MW) is above its Bid Price (-$1,000/MWh).
(b) Was expected to ramp up by 55MW (i.e. 55MW to 110MW) but only managed to increase by 9MW (i.e. 55MW to 64MW).
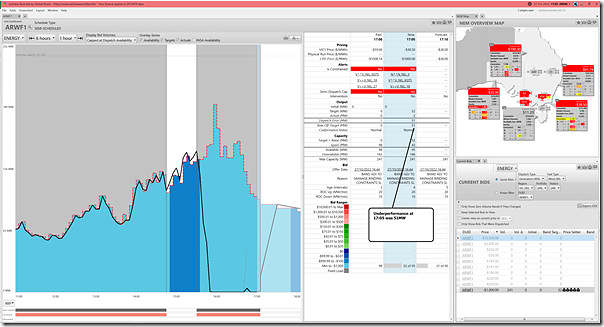
8) ARWF1 (Wind in VIC)
First wind farm (of 8 in total) on the list is not in QLD or NSW … but all the way down in Victoria, and it’s the Ararat Wind Farm:
This unit:
(a) Failed to start on several occasions:
i. It had been offline (i.e. ‘constrained down’ to 0MW) but was given a signal to start and ramp up (to 52MW), but barely managed to get started by 17:05 (Final MW = 2MW) … as a result, the under-performance was 51MW.
ii. We see in the chart above that it had also missed a signal to start 20 minutes earlier (in the 16:45 dispatch interval).
iii. We’ve not yet explored to see why it might have failed to start as expected two times in quick succession.
(b) This unit is subject to three bound constraints:
i. This was also the case at 17:00 (when its CPD Price was below -$1,000/MWh and so illustrative of being ‘constrained off’ for that dispatch interval.
ii. At 17:05 its ramp up (of 52MW) was not limited by its ROCUP rate (20MW/min), or its availability (95MW) … so we hypothesise it was still partly being ‘constrained down’.
iii. The pink colour shown in the ‘Target/Availability’ column in the constraint views below is a visual indicator of this.
(c) It’s also worth noting this unit involved in setting the price in VIC (RRP at –$38.50/MWh) despite bidding down at –$1,000/MWh (to be discussed more in Part 4, to come…).
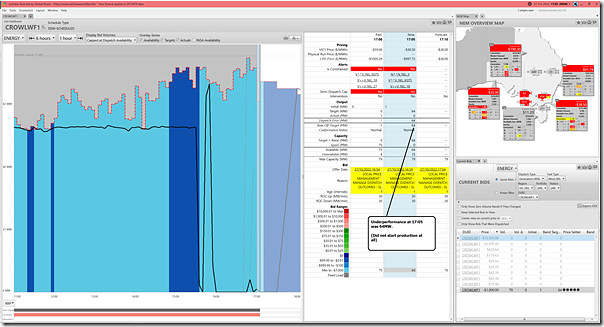
9) CROWLWF1 (Wind in VIC)
The second (of three) Wind Farms in VIC was the Crowlands Wind Farm:
The unit:
(a) was given a target to start production (it had been at ~1MW) and ramp up considerably, but did not manage to start (Final MW at 17:05 was 0MW with rounding):
i. … hence resulting in an under-performance of 64MW.
ii. So similar to Ararat Wind Farm, in that respect.
iii. Not sure if there is any commonality in cause between them?
(b) The unit is denoted as a ‘Price Setter’ in the ‘Current Bids’ widget in the bottom-right.
(c) The unit is subject to three different bound constraints … but not ‘constrained down’ by them.
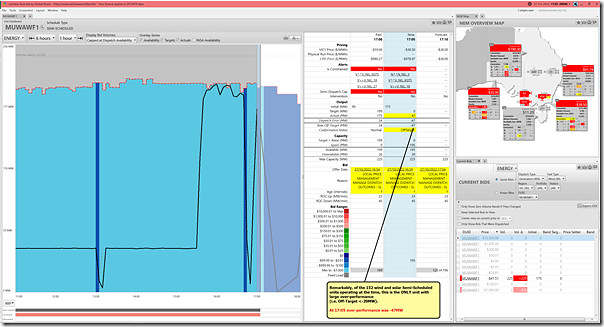
10) MUWAWF1 (Wind in VIC)
Here’ the Murra Warra stage 1 Wind Farm in Victoria:
This is the only unit of the 152 Semi-Scheduled units reviewed that showed a large over-performance (at AggROT = –47MW).
————-
PS1 … a quick reader of this Part 2 article has made the point (with respect to the annotation in the image) that with so many units subject to Semi-Dispatch Cap it’s less surprising than it might otherwise be that there are not many large deviations in terms of over-production … i.e. because the Semi-Dispatch Cap works specifically:
(a) to dissuade deviations (small and large) of over-production.
(b) but does not dissuade deviations (small and large) of under-production … with the ‘AER Rule Change’ limiting this to only when the wind or solar resource falls.
————-
A couple other notes:
(a) Because it is an over-performance, and the Semi-Dispatch Cap is flagged, the logic in ez2view calculates that the AEMO Conformance Status logic will have flagged it as ‘OffTarget’ (i.e. one step towards being declared ‘Non Conforming’).
(b) We see that the unit had its volume bid in what we presume is a ‘negative LGC’ style price band (at -$41.51/MWh) … but:
i. the CPD Price for the unit was driven down close to –$1,000/MWh:
… as a result of co-optimisation between three different constraint equations
… these constraint equations are each discussed below.
ii. as a result, the unit was fully ‘constrained off’ to 0MW in the Target;
iii. but did not make it all the way down to 0MW in the dispatch interval for unknown reasons.
(c) Reviewing the ‘Constraint Dashboard’ widget views below for the three constraints bound at the time containing Murra Warra, we see that …
i. Constraint equation ‘N^^N_NIL_3’ shows MUWAWF1 with a LHS factor of 0.2704 and 10 LHS terms above it on the list; and
ii. Constraint equation ‘V^^V_NIL_KGTS’ shows MUWAWF1 with a LHS factor of 0.3639 and 11 LHS terms above it on the list; and
iii. Constraint equation ‘V>>V_NIL_18’ shows MUWAWF1 with a LHS factor of 0.8283 and only 4 LHS terms above it on the list of which:
1. two others of which were also ‘constrained down’ ; and
2. the other two are bidding -$1,000/MWh so are way cheaper than Murra Warra Wind Farm.
(d) So we can see the unit is fully dispatched/constrained off … but without thinking further, this might be a combination of both:
i. Bid Price under RRP; but also
ii. Being ‘constrained off’ as well, due to these 3 constraints.
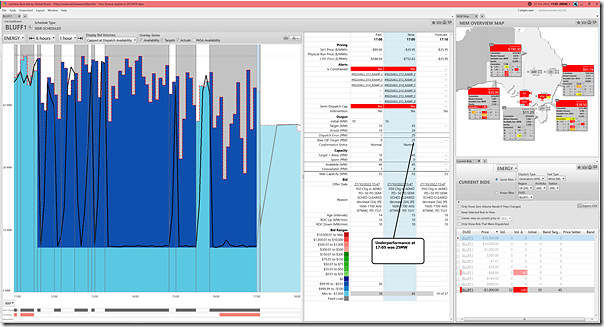
11) BLUFF1 (Wind in SA)
First South Australian Wind Farm in the list (alphabetically) is the Bluff Wind Farm … which was originally known as Hallett #5 Wind Farm (note that there are 4 units listed here all being editions of Hallett Wind Farm)
This unit shows a 25MW under-performance.
(a) The unit was expected to ramp up (10MW to 45MW), but did not manage that (only reaching 20MW);
(b) As was the case for BNGSF2 (above) this unit (also in SA) is subject to 6 different bound ramping constraints … but obviously not ‘constrained down’ by them:
i. Target = Availability
ii. CPD Price > Bid Price.
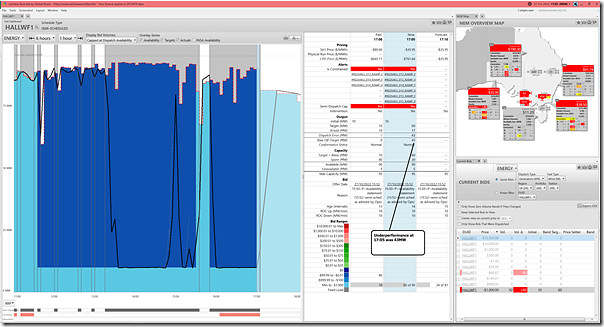
12) HALLWF1 (Wind in SA)
Within the same Hallett family, the Hallett 1 Wind Farm is also in the list:
This unit shows a 43MW underperformance. The case for this unit is quite similar to Stage 4:
(a) Expected to ramp up significantly (by 50MW), but could manage only a small amount (by 7MW);
(b) Subject to 6 different ramping constraints … but not ‘constrained down’ by them:
i. In this case, the CPD Price > Bid Price, so we know this is the case;
ii. However in this case the Target (60MW) was 30MW below Availability (90MW) … i.e. 30MW spare shown in the table in the ‘Unit Dashboard’.
iii. but this is because of ROCUP limit of 10MW per minute in the bid, not the constraints.
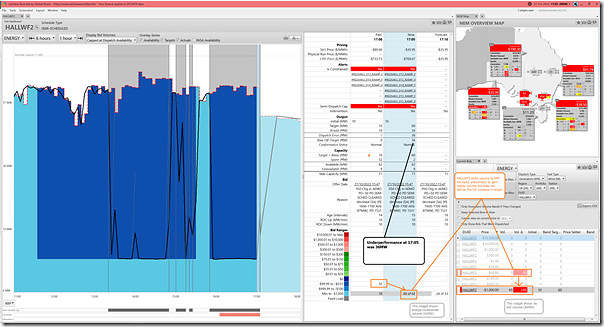
13) HALLWF2 (Wind in SA)
Within the same Hallett family, the Hallett 2 Wind Farm is also in the list:
The case for this unit is quite similar to Stage 1 and Stage 4:
(a) Expected to ramp up significantly (by 50MW), but could manage only a smaller amount (by 14MW) … so a 36MW underperformance;
(b) Subject to 6 different ramping constraints … but not ‘constrained down’ by them
i. Again, CPD Price > Bid Price;
ii. And the fact that the Target (60MW) was 2MW below Availability (62MW) is again because of ROCUP limit of 10MW per minute in the bid, not the constraint.
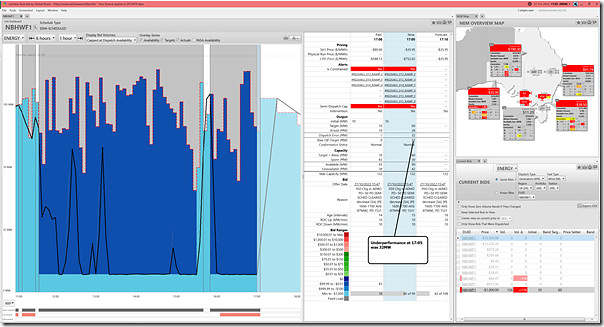
14) NBHWF1 (Wind in SA)
Fourth on the list of Wind Farms in South Australia is the North Brown Hill Wind Farm … which was originally known as Hallett #4 Wind Farm:
This unit shows a 32MW underperformance. The unit was asked to ramp up by 50MW, but only managed to deliver an additional 18MW.
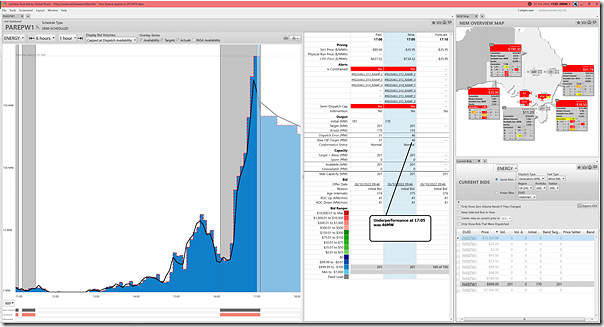
15) PAREPW1 (Wind in SA)
Last on the list of 15 big deviations is at the Wind Farm component of the Port August Renewable Energy Park:
Highlighted on the image is the 46MW underperformance.
Note that the unit was asked to ramp up by 31MW (170MW to 201MW), but instead ended up going down by 15MW (down from 170MW to 155MW). That’s a significant difference!
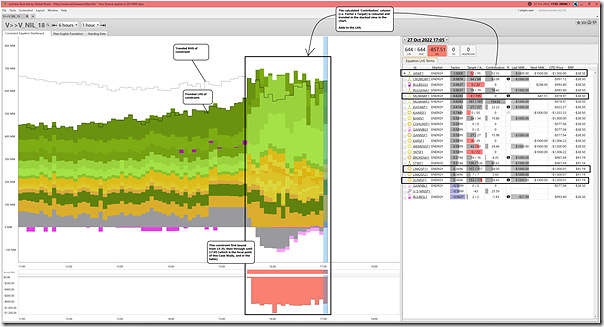
(B) A quick look at some of those constraints
Many of the snapshots from ez2view v9.6 above highlight the units were subject to (various) bound Constraint Equations …
In order to understand a bit more, we’ve used the power of ‘Time Travel’ in ez2view v9.6 but this time with the ‘Constraint Dashboard’ widget (which is especially useful with ‘next day public’ data to flag things like units which had spare capacity not used) to quickly flag the effect of four of these constraints.
With respect to these constraints shown below, I’ve highlighted (in the table on the right, which is focused on 17:05 in each case) where any of the DUIDs listed above is referenced, for ease of identification. Remember that the list in the table is sorted in descending order of LHS factor.
B1) Constraint ‘V>>V_NIL_18’
This constraint equation was already discussed briefly in this Case Study of 10th August 2022 (other articles over time might be tagged like this).
Of the 15 x DUIDs noted above, we see how ARWF1 and MUWAWF1 and SUNRSF1 are ‘constrained down‘ by this constraint (amongst others).
More generally, of the 8 x DUIDs showing pink colour in the ‘Target/Availability’ column (i.e. indicating spare capacity available but unused), looking to the right in each cell we can see that the CPD Price is at, or under, the ‘Next MW bid @’ price column.
B2) Constraint ‘V^^V_NIL_KGTS’
I don’t think there have been articles previously written about this constraint equation … but any that are in future will be tagged like this.
With this constraint equation:
(a) ARWF1 and MUWAWF1 and SUNRSF1 all appear;
(b) Along with 6 other DUIDs all with spare capacity
B3) Constraint ‘N::N_UTRV_2’
This constraint equation was the main focus of this ‘Case Study of the ‘N::N_UTRV_2’ constraint equation – Friday 28th October 2022’, which relates to the day after this Case Study … whilst other articles pertaining to this constraint have been tagged like this.
With respect to this constraint, we can see that:
(a) Of the 15 x DUIDs above, only SUNRSF1 appears;
(b) But there are 8 other DUIDs with spare capacity.
B4) Constraint ‘N^^N_NIL_3’
This constraint is otherwise known as the ‘X5 constraint’, and has been explored in articles here beforehand (tagged like this).
… as an aside, we also understand that the AEMO will be changing the formulation of this constraint within the next week or two (i.e. in March 2023) and we might explore it further when that happens.
Here’s the view of this constraint for the 17:05 dispatch interval:
With this constraint equation:
(a) ARWF1 and MUWAWF1 and SUNRSF1 all appear;
(b) Along with 2 other DUIDs all with spare capacity
…
Remember there were other constraint equations active on the 15 units listed above that we did not illustrate using the ‘Constraint Dashboard’ widget in ez2view here.


Leave a comment