
As Dan had noted in his part 2 article on curtailment Keeping Up with the Curtailment Part 2: The what and the where he and I were delighted to deliver a presentation to an audience arranged by the Clean Energy Council. I would like to reiterate Dan’s thank you to Christiaan Zuur and Ana Spataru from the CEC for the invitation.
As part of the presentation we looked into FCAS costs, specifically Regulation FCAS costs for wind and solar units in the NEM. I’ll elaborate a little further on that in this article.
Regulation FCAS costs for wind and solar units in the NEM
Regulation FCAS costs cover the expense to correct the frequency when in deviates in response to an imbalance between supply and demand. Check out the WattClarity article Lets Talk About FCAS for more information.
The costs are assigned to generating units but the main differential between high and low costs is that it depends on whether the unit follows its dispatch instruction and,
- where it doesn’t, it may be deemed as contributing to poor grid frequency in the interval,
- and if so, will attract a portion of the cost of regulating the grid frequency in that dispatch interval.
As costs relate to how the unit follows its dispatch instruction, generators whose output is variable (solar and wind sources) often attract higher costs, especially when that variability is greatest.
*note that under the current cost calculation methodology units grouped together by participant portfolio can see their overs and unders net out. This and more is covered in a separate WattClarity article here.
The larger the unit, the greater the Regulation FCAS costs
Drawing on data from the GSD2023, to orient ourselves, the following chart presents annualised FCAS costs relative to each unit’s max capacity in 2023.

Two general observations stand out:
- The larger the unit, the greater the Regulation FCAS costs
- Costs for individual units of similar size vary
- by fuel type (as the colours show a degree of separation)
- yet also by other drivers not captured in the chart.
In the next chart we plot the units Regulation cost as a percentage of energy market revenue.

The data is, again, for 2023 and shows that there is a general tendency for units to see Regulation costs around 2.5% of energy market revenue.
- Nonetheless, the percentage for some units – and these were predominately solar units – in 2023 was far higher that 5% of energy market revenue.
Of note: the percentage tends to stay steady regardless of max capacity and this is to be anticipated as the unit’s capacity plays a dominant role in its energy market revenue and therefore it is already accounted-for in the percentage.
Other ways to offset Regulation FCAS costs?
It may come as a surprise to some readers but the technology exists for wind and solar units to participate in the NEM’s FCAS markets. This provides an opportunity to earn revenue from FCAS provision.
There aren’t many wind or solar units participating in FCAS markets yet, but for those that are, we can assess the revenue relative to Regulation FCAS costs. This analysis, and understanding how bids and enablements have contributed to a unit’s revenue in the ten markets, is supported by the new 10-year FCAS section of the GSD.
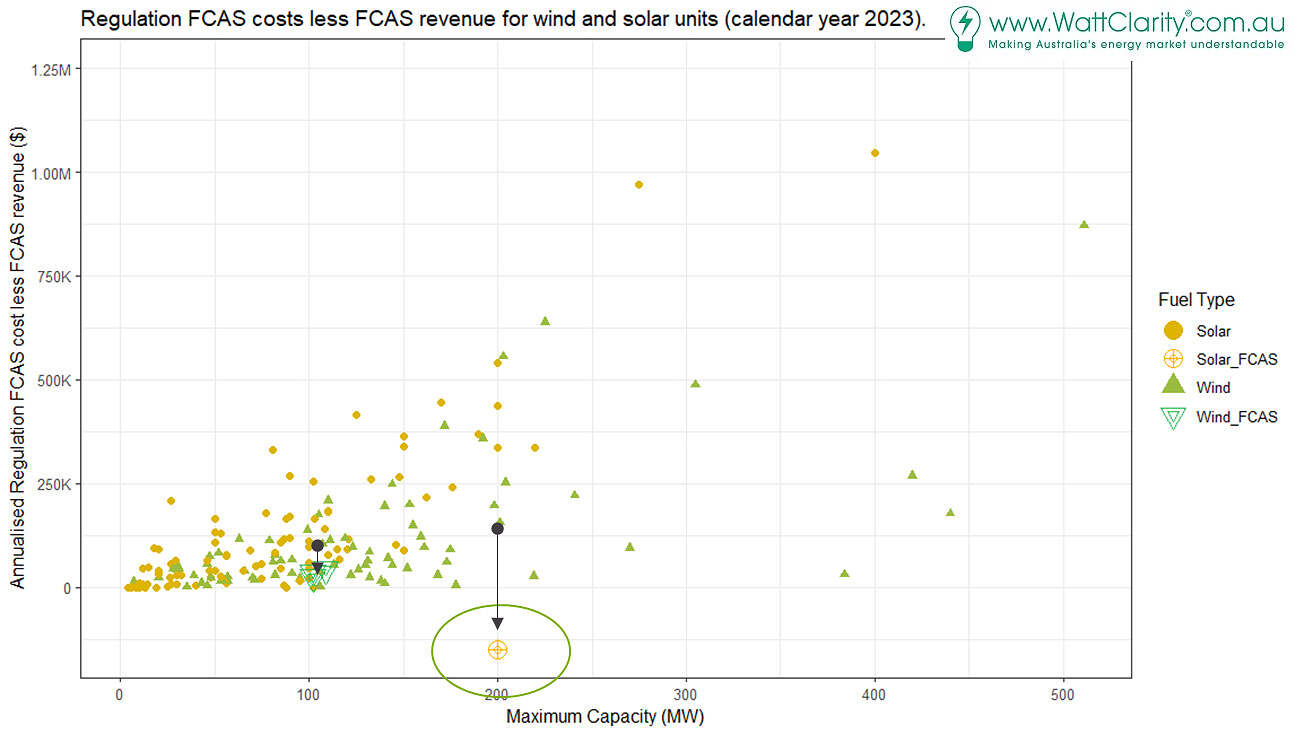
In the next chart we plot the Regulation FCAS costs after subtracting FCAS market revenue in order to gauge whether this revenue stream helps to offset Regulation costs.
What stands out is the single solar unit that earned FCAS Revenue (by being enabled and providing FCAS) in 2023 and saw that revenue more than offset its Regulation FCAS costs, putting its position below zero on the y-axis.
Three wind units were also involved in FCAS markets but to a lesser degree and hence the revenue did not make as great an impact in the chart.
Self-forecasting and Regulation costs
The presentation also spent time uncovering recent trends in adoption of self-forecasting, a topic we here at WattClarity are taking an increasing interest in.
For background on what is self-forecasting and how does it play a role in the market the WattClarity archive of articles collated under the Self-Forecasting topic may be of interest.
For the CEC presentation, we visualised Regulation costs for 2023 and highlighted units participating (at least once in 2023) in self-forecasting:

The chart above helps demonstrate how self-forecasting participation generally improves Regulation costs:
- Fewer solar units who engaged in self-forecasting appear to sit higher up in chart.
- Although, there were two outliers using self-forecasting with high Regulation costs. These didn’t use self-forecasting for all periods in the year, so the position may change as their the use of self-forecasting changes.
- A cluster of wind units using self-forecasting and having low Regulation costs is clear in the chart.
- As at of the end of 2023, there appears a tendency for larger wind units to not yet have adopted self-forecasting.
That’s all for now. We look forward to the next opportunity to share insights on units operating in the NEM with CEC members
Leave a comment