
In recent weeks, Paul published Part 1, Part 2 and Part 3 of an evolving Case Study into a very large incidence of collective under-performance across all Semi-Scheduled units across the NEM. To recap:
- This event occurred at 17:05 on 27th October 2022;
- Apart from the special case of the SA System Black event in 2016, this was the largest recorded collective deviation away from target (set by AEMO at each dispatch interval) in the history of the NEM. We use the term ‘Aggregate Raw Off-Target’ to describe the specifics of what the measurement is, and this page on the WattClarity Glossary describes it further.
Earlier Paul had indicated that (time permitting) he might be able to delve further into analysis of what went on during that event – not just at that dispatch interval but also in the several hours surrounding, which we saw in Part 1 contained many intervals of extreme underperformance.
Locations of the units and their contributions
One thing that jumped out to me in Part 2 was what appeared to be a geographic clustering of some of the DUIDs exhibiting extreme Off Target. I wondered …
- If that was actually the case; and
- If so, what role weather patterns may have played during the event.
To answer the first question, I’ve have put together the map below which shows the location of all semi-scheduled units, their fuel type, and their absolute Raw Off-Target value for the 17:05 dispatch interval.
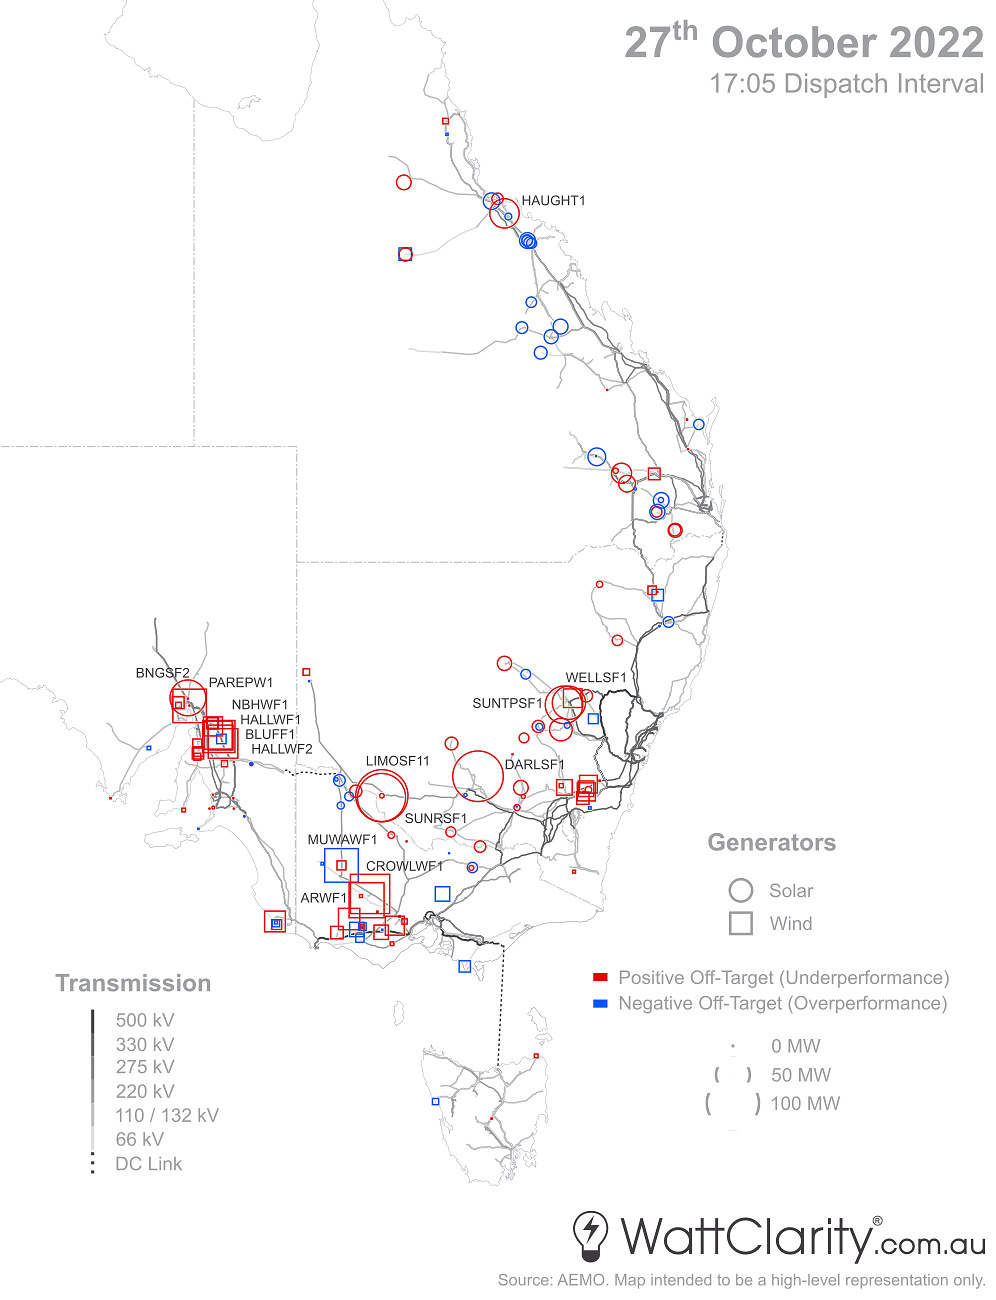
The Semi-Scheduled units are spread right across the NEM, but in this instance, those with extreme under-performance were clustered in a smaller area across the south and south-west.
Source: AEMO
I have labelled to the ‘top 15’ units that had the largest deviations, in absolute terms, in order for readers to better visualise the locations of the biggest contributors. Apart from Haughton Solar Farm in North Queensland, all of the generators are located in the Southern half of the network. We can see some notable clusters appearing as noted in the caption above:
- South-Western NSW
- Western VIC
- Mid-north and northern SA
It’s also good to keep in mind that the marks on the map represent absolute values for each generator, hence it does not capture the relative size/capacity of each unit.
Weather during the dispatch interval
If we compare the map above to the satellite images below we can begin to look at what role weather played during the event .
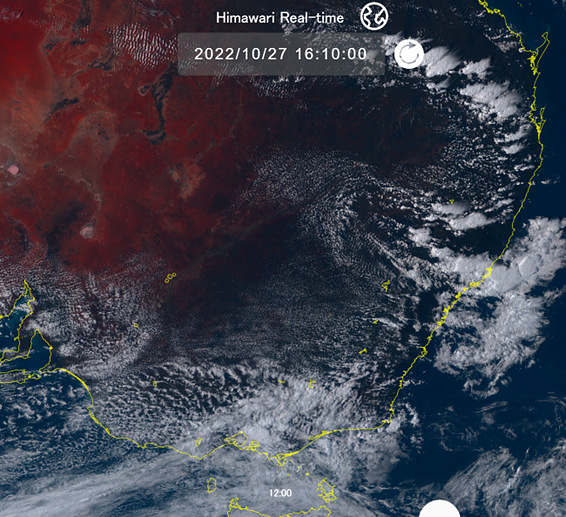
Dappled clouds were covering parts of Victoria, New South Wales and South Australia at the time of the event.
Source: Japan Meteorological Agency (JMA)
Note that the time in the screenshot above is in UTC +9, hence would represent 17:10 NEM time. We can see that dappled cloud cover could have potentially impacted solar irradiance for solar farms in the southern and eastern parts of the NEM.
The image below also highlights the strong southerly and south westerly winds that were blowing at 17:00 that afternoon.
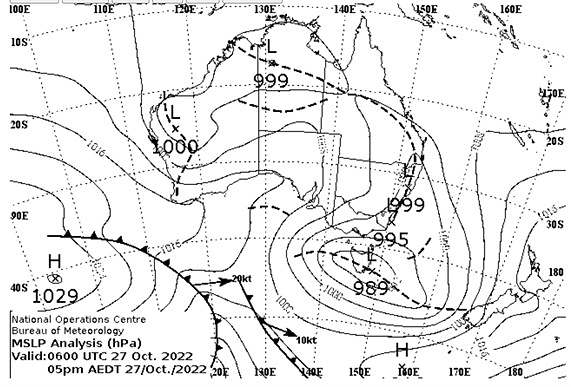
A big low pressure off Tasmania spun up the cold airmass with strong southerlies and south-westerlies.
Source: Bureau of Meteorology (BOM)
Be the first to comment on "Case Study of 17:05 on 27th October 2022… Part 4: the geographical spread of +861MW AggROT"