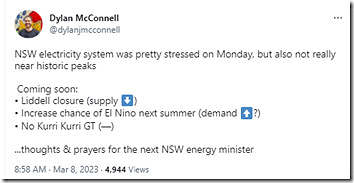
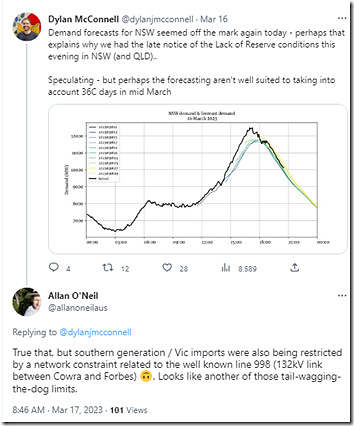
Following some out-of-summer stresses in the NSW region on Monday 6th March, I noted Dylan McConnell tweeted this comment about the fact-approaching challenges for the NSW electricity system:
At Monday 6th March 2023, the scheduled closure of Liddell Unit 4 on Wednesday 19th April 2023 was 44 days away (with unit 2 and then unit 1 to follow in rapid succession).
… Just over a week later (on Thursday 16th March) the NSW and QLD region experienced more severe stresses:
1) With both QLD and NSW experiencing ‘Actual LOR2’-level Low Reserve Conditions; and
2) Significant price volatility; and
3) AEMO geared up to pull the trigger on Short-Notice RERT …
… which, whilst that did not actually eventuate, should still resonate with readers as a pretty extreme measure, and a reflection of what we wrote a number of years ago now (in the GRC2018) about ‘the level of risk is increasing in the NEM’.
As noted here on the day, it was then with only 34 days till the closure of Liddell unit 4. As I hit publish now, we’re only 29 days till the closure of Liddell unit 4.
Whilst there are very good reasons why Liddell is closing (including emissions, but also those Allan wrote about here with reference to the GSD2022), what’s happened this week could be seen as reinforcement of the fact that we in the energy sector, collectively, have not covered ourselves in glory in the 7 years since AGL first announced the closure of Liddell was scheduled for 2022.
1) I do hope that we can all take this opportunity to really think through carefully to understand how we can have had so much notice of closure and yet be contemplating the dispatch of RERT only a few short weeks from its closure
… especially noting that those three soon-to-close units were providing a meaningful contribution through the event on Thursday (without which it seems certain we would have seen Reserve Trader triggered).
2) and I also hope this Saturday’s NSW state election (25th March 2023) does not derail this rationally considered analysis … though this is perhaps more wishful thinking given the long-running historical performance of our elected representatives of various political persuasions.
Given the real significance of what’s happened at various points through March, I thought it would be useful to have a look at some of the things that transpired on Thursday 16th March … what follows highlights some things, but also flags other things that might be explored later when time permits.
(A) Changing LOR expectations
The AEMO’s initiation of Short Notice Reserve Trader provisions was triggered by the Forecast LOR2 conditions for the NSW and QLD regions on Thursday 16th March 2023, so it’s useful to start with the AEMO’s forecast Low Reserve Condition warnings to provide some context on what occurred.
Thankfully with the ‘Forecast Convergence’ widget in our ez2view software, it’s now much easier to ‘look up the vertical’ and see ‘that other dimension of time’ with respect to data sets such as these (the number of data sets available expanded in the 2022 upgrade to v9.5, and further enhanced with the upcoming v9.6 release).
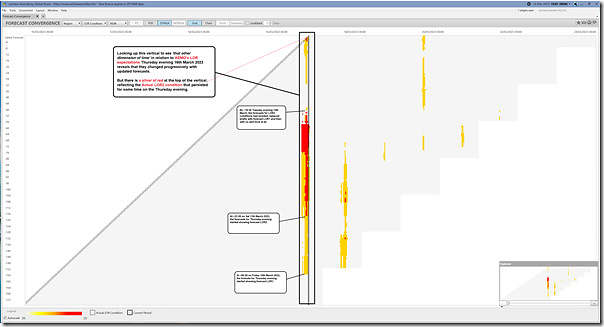
(A1) The LOR forecasts for the NSW region
Let’s look firstly at the NSW region, and (using Time-Travel in ez2view to wind the clock back to the 19:05 dispatch interval, NEM time, on Thursday 16th March) here’s a view focused on successive LOR condition forecasts for the particular point of interest in the NSW Region:
I’ve annotated the image to highlight a few particular transitions. Click on the image to open in larger resolution.
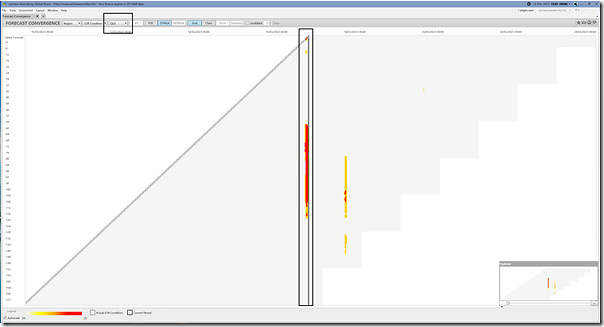
(A2) The LOR forecasts for the QLD region
Using the same method and just flipping a menu to look at the same data for the QLD region, we see a similar (though not identical) colour pattern:
With respect to both images, one of the main observations that needs to be made is that the expectations progressively changed, with a progression that might be summarised as follows:
State #1 (a week out) = everything looks ok
State #2a = we’re going to be tight
State #2b = we’re going to be very tight
State #3 = no, we should be ok
State #4 = no, we really are going to be tight (so much that we need to start implementing Reserve Trader)
State #5 = we dodged a bullet?
The fact that these expectations continuously change (with changing weather patterns impacting both supply side and demand side, plant performance and participant behaviour … amongst other things) is something that’s sometimes lost in a broader sense of what’s forecast to happen in the future. Whilst these particular forecasts were relating to a brief period of an hour or two on Thursday evening 16th March 2023, the above pattern might also be perceived over longer-term time ranges (with a topical one being perhaps what happens with the looming retirement of Liddell).
(B) Setting the scene
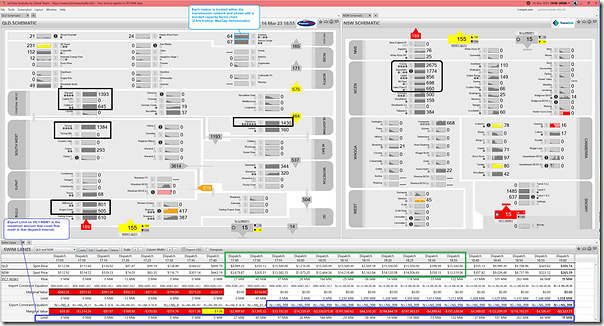
Using Time-Travel in ez2view to wind the clock back to 19:00 in another window composed of three widgets, let’s take a quick look at what the situation in the grid was shortly after the especially volatile period … and, via the ‘Swim Lanes’ widget, to gain an overview of some key parameters through the 2-hour time range of particular interest:
I’ve highlighted:
1) the location of the coal-fired stations in QLD and NSW to assist those readers unfamiliar with the transmission networks and/or the ez2view ‘Regional Schematics’ widgets
… though readers should note that they need to be looking at not just the coal units to understand a fuller picture of what happened …
2) I’ve also highlighted a couple things in the ‘Swim Lanes’ widget to provide some context to the 2 hours of history shown (in the Swim Lanes widget, and in the trended capacity factor charts for each station in the NSW and QLD Regional Schematics.
We’ll discuss a number of things visible above below…
(C) Interconnector constraints
Let’s start by noting, as highlighted on the image above, that:
1) That the ability of southern generators (Victoria, South Australia and Tasmania) to support the stressed regions of NSW and QLD was very restricted during this period; because
2) The VIC-to-NSW interconnector was constrained through the period; and importantly
3) The ‘Export Limit’ on the interconnector (i.e. ability for power to flow north) was severely limited to barely positive numbers (i.e. with positive number reflecting flow north).
All of this meant that those of us in QLD and NSW together were effectively ‘on our own’ in an ‘Economic Island’ for the entire period (and for some of it NSW was ‘Economically Islanded’ from QLD as well) … which is what was noted here during the late afternoon with a snapshot from NEMwatch at 16:45 (i.e. an hour earlier than the run of volatility highlighted above).
At the end of this article here from Thursday evening, valued guest author Allan O’Neil makes the comment:
‘It looks like a significant driver of the volatility (in addition to high demands and generation outages in NSW and Qld) were constraints on the New South Wales 132kV network which limited flows from the south on the main 330kV route from southern NSW & Victoria. Check out the N>>NIL_998 and N>NIL_999 system normal constraints for more detail. Hard to say without deeper analysis but could have been a “tail-wagging-dog” or “gateway” effect where limits on a peripheral flow path throttled the adjoining higher capacity path (but I don’t know by how much). If so, another argument for getting the transmission system in better shape to deal with changes in where generation is concentrated.’
For this article now it’s sufficient to note that the capacity of VIC to support NSW+QLD was severely constrained … understanding more about why that was the case we’ll file that in the ‘if I have more time, I’d like to look into this’ basket.
(C1) The the ‘N>>NIL_998’ and ‘N>>NIL_999’ constraint equations
We can see in the image above that the ‘N>>NIL_998’ constraint equation began setting the Export Limit on VIC1-NSW1 from the 17:55, and that this coincided with:
1) The prices spiking sky-high (to the MPC in the QLD region) at 17:55 … although they had been elevated beforehand; and
2) The Marginal Value of the bound constraint equation jumping significantly as well (this relates to dispatch and price outcomes).
The other constraint equation mentioned by Allan (the ‘N>>NIL_999’ constraint equation) is not shown in the above … but that does not mean it was not important.
(C2) Other constraint equations
It’s also useful to note that, even prior to that time the Export Limit on VIC1-NSW1 was stuck down at 0MW (or even at –13MW at 17:20) … and that this appears to be due to other constraint equations in addition to the ones Allan mentioned.
(D) Demand profile in NSW and QLD
This snapshot of Thursday afternoon at 16:45 showed the ‘Market Demand’ in both QLD and NSW well out of the ‘green zone’ and climbing into yellow and orange levels relative to their all-time maximum levels.
… we noted late Friday that QLD reached a new all-time maximum for ‘Operational Demand’ the following day (Fri 17th March), but that should not take away from the fact that demand on Thursday 16th March was also quite high in its own right.
(D1) To what extent did the actual levels of demand surprise?
I saw at the time that Dylan McConnell had noted that the actual levels of demand in NSW had run well ahead of AEMO’s earlier forecasts, with Dylan speculating that …
‘perhaps the forecasting aren’t well suited to taking into account 36C days in mid March’.
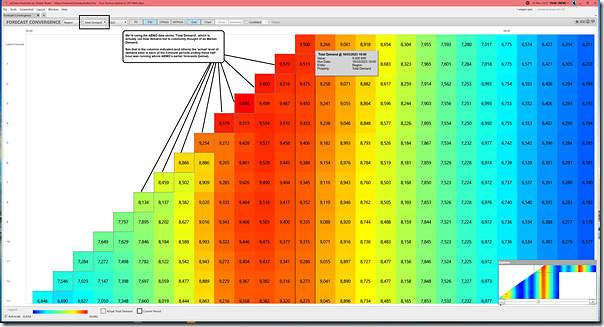
Here’s the tweet, with Dylan’s version of a ‘Forecast Convergence’ view like we have in our ez2view software:
In the image I’ve also appended Allan’s response to Dylan early on Friday morning 17th March, again pointing out the materiality of low export capability from VIC into NSW.
Using our own ‘Forecast Convergence’ widget to ‘look up the vertical’ with respect to ‘Market Demand’ in QLD, here is a zoomed-in view showing several hours leading up to the 19:00 dispatch interval:
This is a different representation than what Dylan showed for NSW* above we see that in both NSW and QLD the AEMO had a very difficult job forecasting the level of ‘Market Demand’, with earlier forecasts missing by a considerable margin. Remembering these gory details of how demand is actually ‘measured’ in real time, we need to understand that the AEMO’s difficulty will have been for some combination of both:
* I believe Dylan was looking at ‘Market Demand’ in NSW … though the story would have been the same had he been looking at the ‘Demand and Non-Scheduled Generation’ figure in the MMS as well.
1) Difficulty in forecasting the level of ‘Underlying Demand’; but also
2) Difficulty in forecasting the production that would come from rooftop PV to offset some of that Underlying Demand …
(a) Remembering that this is one of many technology types affected by high temperatures, and
(b) Also layering in the late afternoon effects,
(c) And whatever cloud cover impacts there might have been across population centres (and rooftop PV production hubs) in QLD and NSW
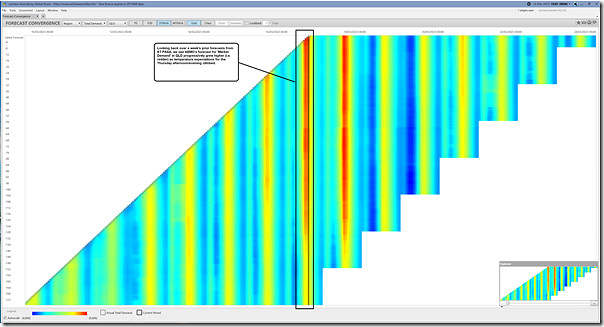
Zooming out to look back over a longer time range (i.e. a full week in ST PASA forecasts) we see that, over that time-range, AEMO’s expectations for peak demand on Thursday 16th March grew quite steadily through the week … though we note above that demand actually grew even more quickly than forecast:
In his tweet, Dylan speculated that this was one factor contributing to the unexpected return of the forecast LOR2 … and hence the unexpected mobilisation of RERT resources. With demand proving hard-to-forecast for both QLD and NSW, it’s easy to see that this would have caused some nervousness in the AEMO control rooms.
(D2) How was demand, in relation to historical range?
In his update here on LinkedIn at the time, Josh Stabler of Energy Edge asked me…
‘This was a weather driven demand electricity market event, unusually late in March with the 11th highest evening peak grid demand day. Highest in three years and highest March ever (Paul: can you confirm?)’
I’ve not had a chance yet to check on that, but would file that in the ‘if I have more time, I’d like to look into this’ basket.
(E) Available and Dispatched Supply from various fuel types
As the last piece in the puzzle for this initial review of Thursday 16th March 2023, we’ll look at the supply of generation from a range of different fuel type categories across NSW and QLD…
(E1) Contribution from coal generators in QLD and NSW
In the ez2view image above, we can see that there were several coal units not operational for the high demand levels seen on the day:
1) In the QLD region:
(a) We’ve already written about the long-term outages affecting both Callide C4 and Callide C3.
(b) In addition, the Tarong North station was offline.
… of the other units we see they were almost* all operating at close to full load for the 2-hour period that’s my focus.
* ‘almost all’ … except for Kogan Creek that was only operating at around 500MW.
2) In the NSW region we see three units of 15 in total offline
(a) One unit at Bayswater
(b) One unit at Mt Piper
(c) One unit at Vales Point
… and noting that Liddell’s remaining 3 units were operational, but only producing 856MW in aggregate at 19:00.
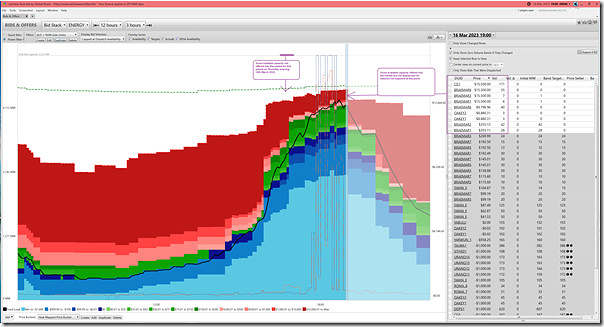
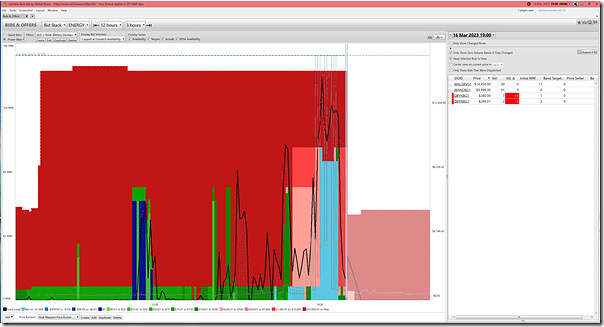
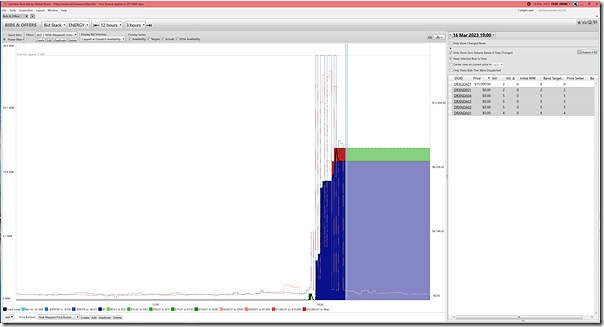
Using the ‘Bids & Offers’ widget also time-travelled back to 19:00 that evening, we see that of the coal-fired capacity available in the market (i.e. excluding the 6 units above) most of it was being dispatched at the time:
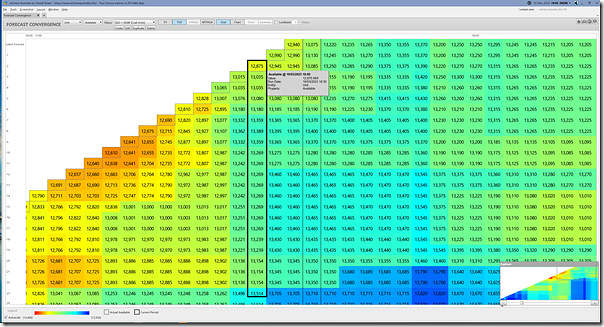
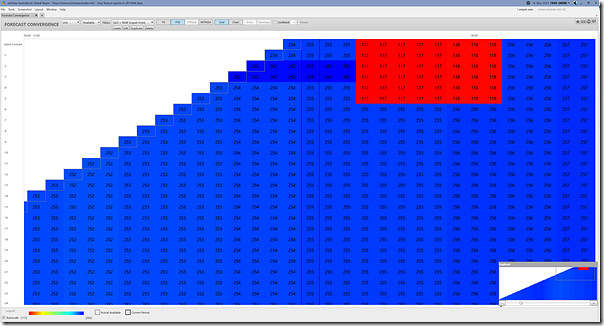
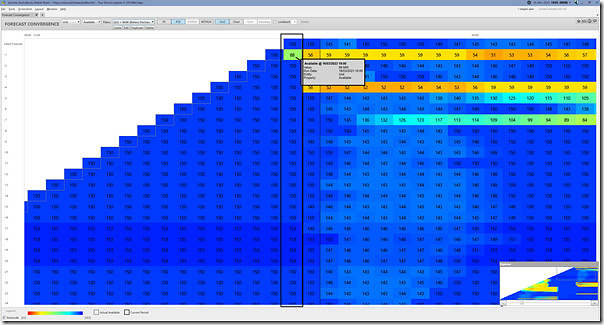
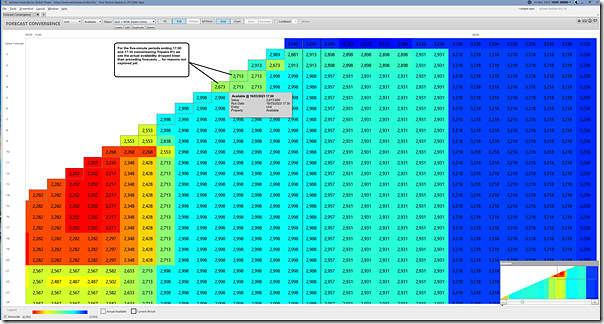
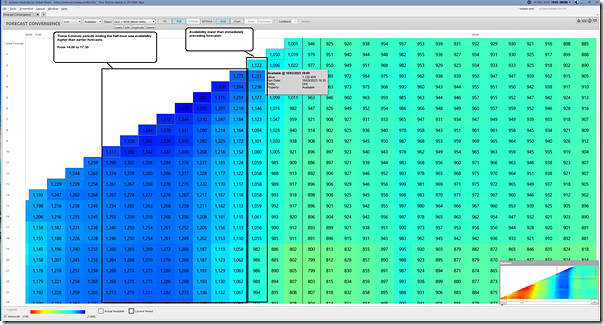
Understanding what was offered in the market and dispatched in every dispatch interval is only part of the picture. We’re also interested to understand whether there were any sudden or unforecast drops in aggregate coal unit availability offered to AEMO for the NSW and QLD regions. We can use our own ‘Forecast Convergence’ widget in our ez2view software to ‘look up the vertical’ and see ‘that other dimension of time’:
Looking up these verticals for the five-minute periods ending each half hour (remembering tripwire #1 and tripwire #2 introduced with 5MS) we see that there was a slight reduction in availability for the 18:30 interval. I’ve not had a chance yet to explore further to trace this back to particular units (and hence causes) but would also file that in the ‘if I have more time, I’d like to look into this’ basket.
Using the ‘Generator Outages’ widget (but not showing an image here), and other widgets, we quickly look at the 6 units that are out and see the following:
1) In the QLD region:
(a) We know about the long-term outages affecting both Callide C4 and Callide C3.
(b) We see Tarong North came offline on Saturday morning 11th March (so several days prior to Thursday 16th March) with an initial expectation it would be back by Sunday 19th March:
i. This appears to have been a forced outage, but one foreseen some time in advance (rebids had referenced ‘tube leak’ from as far back as 2nd February, which was shortly after its output profile was reduced from 29th January).
ii. It appears that the unit had been trying to limp through at partial load to a previously planned outage period from Friday 14th April.
iii. It appears that plans were adjusted on Friday 10th March to bring the unit down that weekend instead… which we presume was due to a combined view of factors such as (possibly deteriorating) plant condition and market opportunity (remembering at that time, as we see above, there was not the expectation that demand would be as high as eventuated).
2) In the NSW region of the 3 coal-fired units (of 15 in total) offline on Thursday 16th March:
(a) Bayswater Unit 3 was offline and not expected to be back online till 29th March 2023:
i. The unit came offline on Wednesday 1st March 2023.
ii. This was an outage planned a long time in advance.
… worth noting here the likelihood that AGL Energy took the expected operations of Liddell through this period in advance in scheduling the outage to BW03 … whether the plan would have changed had Liddell already been closed is unable to be known with certainty.
(b) Mt Piper Unit 1 was offline and not expected to be back online till 24th March 2023:
i. The unit came offline early on Thursday 2nd March 2023.
ii. This was also an outage planning a long time in advance.
(c) Vales Point unit 5 was not expected to be back online till around 11th May 2023:
i. The unit had come offline late the evening beforehand (Wednesday 15th March 2023)
ii. This was also an outage planning a long time in advance.
So in summary, of the 6 coal units offline on Thursday 16th March 2023, the only one not known about even as early as 1st January 2023 was the Tarong North outage.
(E2) Contribution from gas-fired generators in QLD and NSW
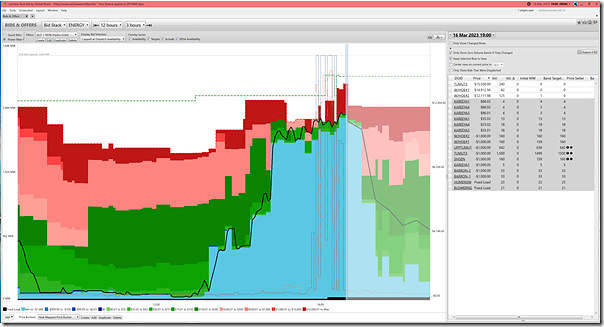
Here is the same ‘Bids & Offers’ widget with the filter instead constructed to view just gas-fuelled plant in QLD and NSW:
Again, some capacity unavailable, and some other capacity available but not dispatched … but useful thought exercise to compare to the ~800MW of generation supplied by Liddell.
Here’s the ‘Forecast Convergence’ widget, using the same filter to just look at Availability for all of the gas-fired generation in NSW and QLD:
In this case we see that none of the columns (i.e. 5 minute periods ending the half hour) showed significant drop in availability compared to expectation through the periods of particular concern.
(E3) Contribution from liquid-fuelled generators in QLD and NSW
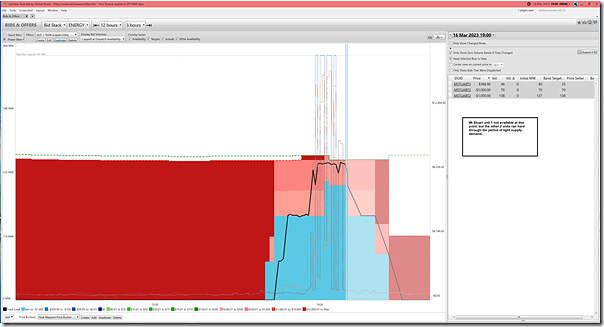
Here is the same ‘Bids & Offers’ widget with the filter instead constructed to view just liquid-fuelled plant in QLD and NSW:
In this case we see 2 of the units at Mt Stuart running hard, with unit 1 unavailable. Here’s the ‘Forecast Convergence’ widget, using the same filter to just look at Availability for all of the liquid-fired generation in NSW and QLD:
In this case we see no unexpected surprises.
(E4) Contribution from Battery Discharge units in QLD and NSW
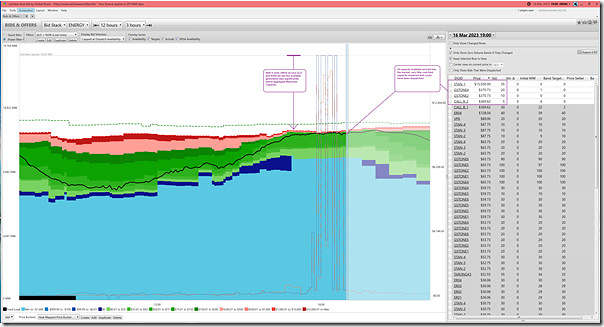
Here is the same ‘Bids & Offers’ widget with the filter instead constructed to view just BESS discharge in QLD and NSW:
There are currently only 3 x Scheduled BESS units across QLD and NSW (Queanbeyan and Wallgrove in NSW, and Wandoan in QLD). We see a burst of activity in line with the high prices (coincident with some volumes bid down at –$1,000/MWh), but output already receded back to lower points by the 19:00 dispatch interval shown in the table on the right … in line with volumes for Wandoan and Wallgrove shifted back up towards the Market Price Cap.
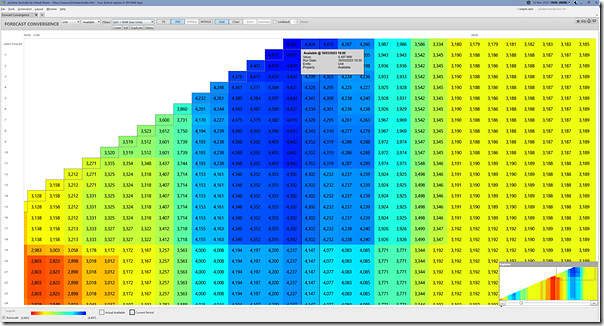
Here’s the ‘Forecast Convergence’ widget, using the same filter to just look at Availability for all of the BESS discharge in NSW and QLD:
What jumps out is the drop in availability briefly forecast for the 5-minute period ending 19:00. Another to add to the ‘if I have more time, I’d like to look into this’ basket.
(E5) Contribution from Hydro Units in QLD and NSW
Here is the same ‘Bids & Offers’ widget with the filter instead constructed to view just hydro discharge in QLD and NSW:
Remember this includes the NQ hydros, Wivenhoe, Shoalhaven, the NSW discharge point for Hume and the Snowy Hydro scheme (excluding Murray, which was allocated to the VIC region when the Snowy region was abolished from 1st July 2008).
1) For these units we see most capacity bid down at –$1,000/MWh when the market needed it most, and heavily dispatched as a result.
2) Because of the deeper storages included, in comparison to the battery units above we see the output is still quite strong at 19:00, with prices receded somewhat.
Here’s the ‘Forecast Convergence’ widget, using the same filter to just look at Availability for all of the hydro discharge in NSW and QLD:
In this case we see the noticeable drop in availability for the 5-minute periods ending 17:00 and 17:30 compared to preceding forecast produced as recently as 16:30. Another to add to the ‘if I have more time, I’d like to look into this’ basket.
(E6) Contribution from Solar Units in QLD and NSW
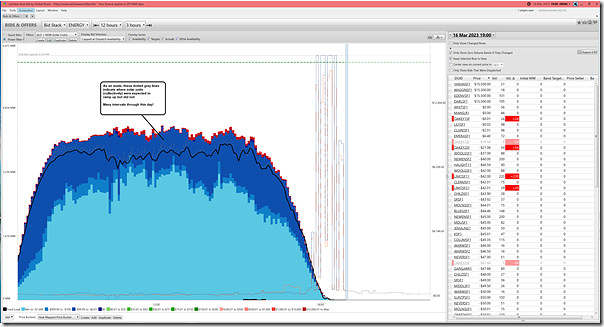
Here is the same ‘Bids & Offers’ widget with the filter instead constructed to view just Large Solar units (i.e. the Semi-Scheduled ones, with Non-Scheduled invisible in this context) in QLD and NSW:
With respect to the above:
1) The price first spiked in NSW and QLD at 17:45 (to ~$4,000/MWh).
(a) At this time we see that the aggregate Target was 778MW across the Large Solar Farms in QLD and NSW;
(b) But the ‘Bids & Offers’ widget also makes clear that the Actual Output for 17:45 was 695MW … meaning an Aggregate Raw Off-Target for this subset of units of +83MW (i.e. positive numbers being under-performance)
… we’ve seen more recently that these levels of AggROT for Semi-Scheduled units across the NEM are growing quite large, which is feeding into questions like this one.
(c) Also worth noting that the 778MW Target was slightly less than the 794MW Availability … because there were some solar farms ‘constrained down’ due to network constraints (you can see the affected icons in the NSW and QLD schematics above).
2) Thereafter it’s no surprise to see the output continued to decline, reaching 0MW output before the spell of volatility was done.
3) Finally, worth highlighting the note added to the image showing many instances of aggregate underperformance during the day.
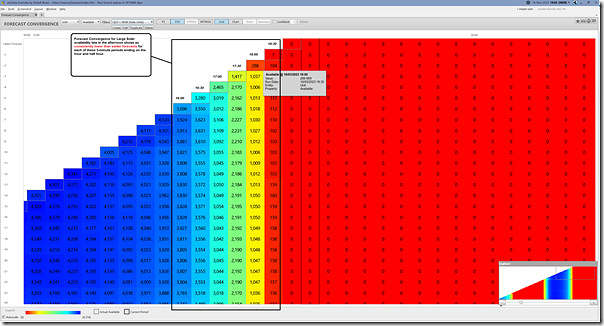
Here’s the ‘Forecast Convergence’ widget, using the same filter to just look at Availability for all of the Large Solar in NSW and QLD:
In this case we see that the expected availability AEMO forecast for these Solar Farms some hours ahead of the point of dispatch was significantly higher than actual in all cases.
(E7) Contribution from Wind Units in QLD and NSW
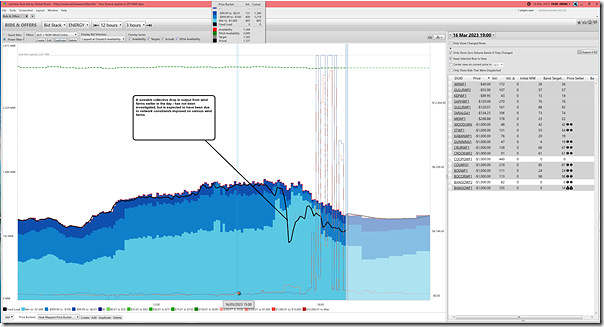
Here is the same ‘Bids & Offers’ widget with the filter instead constructed to view just Wind units (i.e. the Semi-Scheduled ones, with Non-Scheduled invisible in this context) in QLD and NSW:
In this case we see that:
1) In parallel with the period of volatility, output (black line) is lower than the energy-constrained availability in the bids … leading us to suspect some network congestion
… again, you can see units on the LHS of bound constraint equations in the QLD and NSW schematics above.
2) At 19:00 the numbers are such:
(a) 2,831MW of Maximum Capacity … understanding this is the ‘best’ method of measuring installed capacity for Wind Farms;
(b) Of this, there was 1,001MW Available at any price … which translates to a 35% instantaneous Availability Factor
(c) But some of this was not given a target (network constraints?) with a Target of only 847MW … translating to an implied instantaneous Capacity Factor of 30% rounded up
(d) However wind farms also under-performed compared with Target, but only by 30MW …
i. With Actual Output 817MW
ii. So a truer instantaneous Capacity Factor of 29% rounded up.
3) Finally on the image we’ve annotated an earlier slump in output:
(a) We suspect network constraints;
(b) But could add this to the ‘if I have more time, I’d like to look into this’ basket.
Here’s the ‘Forecast Convergence’ widget, using the same filter to just look at Availability for all of the Wind units in NSW and QLD:
This shows that the actual availability at the point of dispatch through the afternoon was oftentimes higher than preceding forecasts … with the exception of the five minute period ending 18:00, which was the inverse.
(E8) Contribution from Negawatt Units in QLD and NSW
For what it’s worth, here is the same ‘Bids & Offers’ widget with the filter instead constructed to view just Negawatt units in QLD and NSW:
We can see a maximum of 23MW dispatched through the volatility period, which is at the same time:
1) More than I think I have seen in the past;
2) But still very small, given the massive effort made over many years to implement the Centralised Negawatt Dispatch Mechanism.
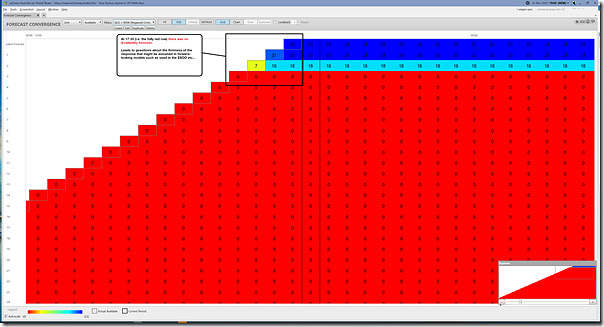
Out of curiosity I’ve added the ‘Forecast Convergence’ widget, using the same filter to just look at Availability for all of the Negawatt units in NSW and QLD:
What jumps out to me, first and foremost:
1) Is that even as late as 17:30 (despite the LOR2 warnings stretching back days) there had been 0MW forecast to be available in bids in the market … it’s only after 17:30 that we have any sign that there is any availability.
2) To me, this particular example leads me to question what availability there might be valid to consider as Firm in any modelled outcome, such as in the ESOO?
That’s all for Part 1 of this deeper dive Case Study.


There was an outage on a Victorian 220kV transmission line (one of the Thomastown ones) earlier overnight. This implemented a constraint on the Vic-NSW lines. I wonder if that was at play, constraining down Vic-NSW transfer?
Clearly one lesson that should be learnt is that “Summer” doesn’t finish on the 1st of March. It shouldn’t be assumed that scheduled maintenance can start on the 1st of March.
There needs to be greater focus and reporting by AEMO on the performance of interconnectors and major transmission lines. Too often we have seen major supply problems which would have been far less critical, or not even occur had there not been constraints on transmission.
It would be interesting to know what residential demand controls were used in QLD during these periods, such how many and how by how much were residential air conditioners ramped down.
These events show the need for almost all residential consumers to be moved to wholesale spot price linked tariffs, so residential consumers are incentivised to reduce their consumption during these periods of extreme demand.
The problem does not seem to be capacity of the interconnects themselves, after all VN1 has been upgraded and one of the justifications of the Victorian big battery was that it would allow an increase of 150-200MW of Victorian power to NSW by stabilizing the transmission link.
Despite these upgrades imports from Victoria were constrained to zero on the 16th of March and total net imports from Victoria over the last 90 days were about 500 GWh, yet way back in 2010 NSW imported 1,950 GWh in Q4 from Victoria. Further in 2010 NSW prices were only 21% higher than Victoria, now they are almost double, so the cost of transmission can’t be the issue.
How come capacity has been increased 20-30%, the price differential is as high as it has ever been and yet flows are down by two thirds. Methinks either incredibly poor grid management by Transgrid or some seriously dodgy constraint equations in the NEM dispatch engine