
Today’s release of the Generator Statistical Digest 2022 (GSD2022) by Greenview Strategic Consulting and Global-Roam Pty Ltd is a great opportunity to look at what its ten-year summary of market data, with a deeper dive into last year’s outcomes, might tell us about the imminent closure of Liddell Power Station’s three* remaining generating units.
* the station’s number three unit (LD03) produced its last megawatt-hour on April 1st 2022.
Many readers will remember that Liddell’s owner AGL set off a high-profile political storm back in 2017 when announcing (in fact confirming earlier advice from 2015) that the station would close in 2022. After various manoeuvrings and shenanigans including:
- much back-and-forth between AGL and the then-Turnbull government,
- reports from AEMO and an ad-hoc taskforce,
- political pressure reportedly exerted on AGL board members,
- speculative “offers” to buy the station made by other market participants, and
- umpteen breathless press articles which no doubt mentioned blackouts, price rises, big bad energy companies, etc etc etc,
… the full closure was slightly deferred, but its time has now come, with the station’s remaining three units due to close in April 2023.
So what will the power system lose with the exit of Liddell?
Fully answering that question might need some good old fashioned “with vs without” system modelling. I’m going to take a much simpler approach here and simply look at what (and how) Liddell has been providing in recent years, using some GSD 2022 charts and a few others, and comment generally on what might replace that contribution.
It’s also worth looking at the station’s performance relative to one or two other example plants, again using the GSD’s charts and metrics, just to illustrate why Liddell’s time seems to be up.
How big is Liddell?
An obvious starting point is to ask how much generation capacity the system will lose after Liddell’s last turbine spins down for the final time. Turns out there are multiple answers to that simple question. The GSD gives us two of the numbers that AEMO publishes for the “capacity” of each Liddell unit:
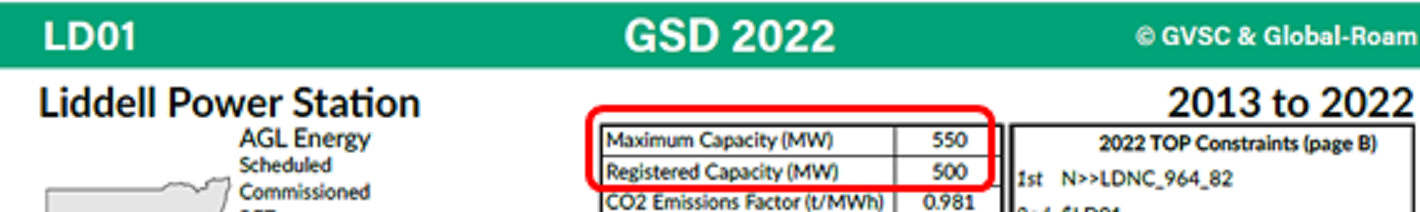
(The same values apply to LD02 & LD04). So, “Registered Capacity” 500 MW per unit and “Maximum Capacity” 550 MW per unit. That would now make Liddell a 1,500 MW or 1,650 MW station? On paper, yes, in reality: not by a long way. If we look at what the GSD shows us for daily maximum output available and achieved output range for Liddell’s unit 1 (LD01) over 2022, we see this:
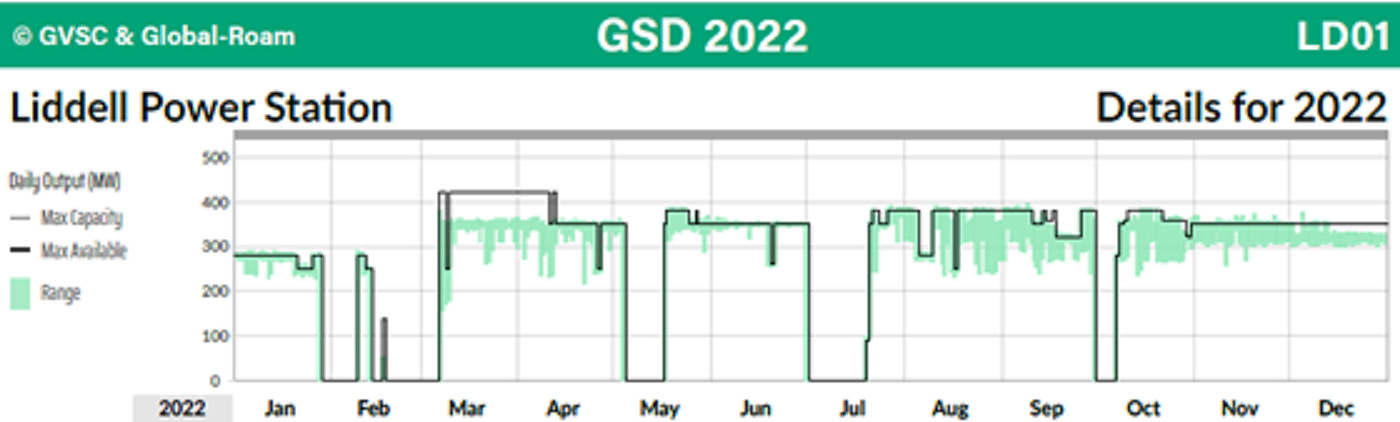
The thick grey line at the top is the 550 MW “Maximum Capacity”, but the chart shows offered Maximum Availability (what the unit could actually put into the market based on its operator’s bids) only rarely getting above 400 MW, and actual daily output range (vertical green bars) never exceeding that level.
The story for Liddell’s other units in 2022 was pretty similar – here are all four units (including LD03 up to its closure) for 2022 – rarely above 400 MW for any of them.
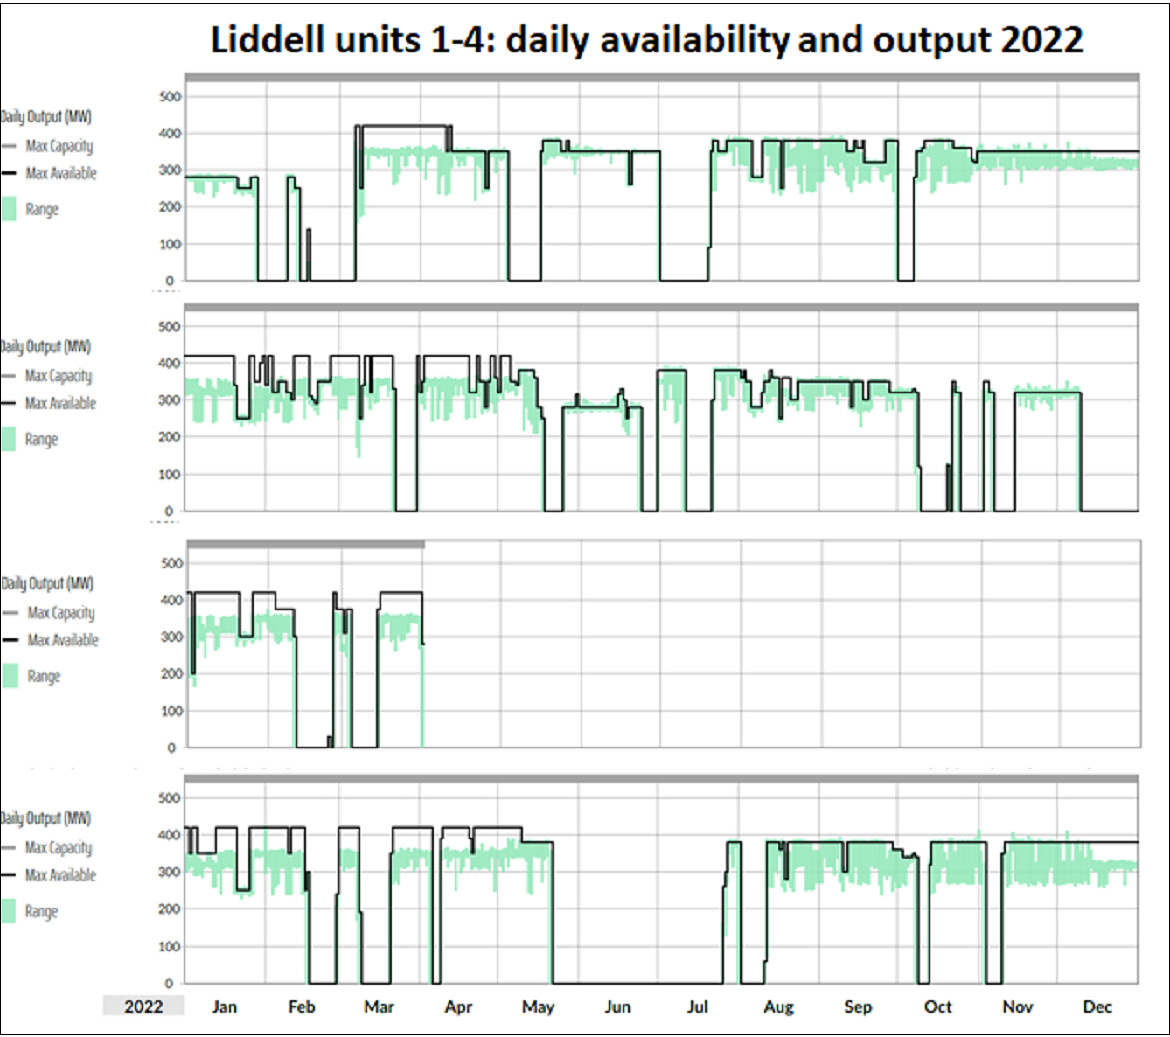
So even before closure of LD03, Liddell was barely acting like a 1,600 MW station and with its current three units it’s probably more like 1,200 MW. We can confirm this by looking at an “availability duration curve” over the past thirteen months for the station’s remaining units (leaving out LD03’s contribution):
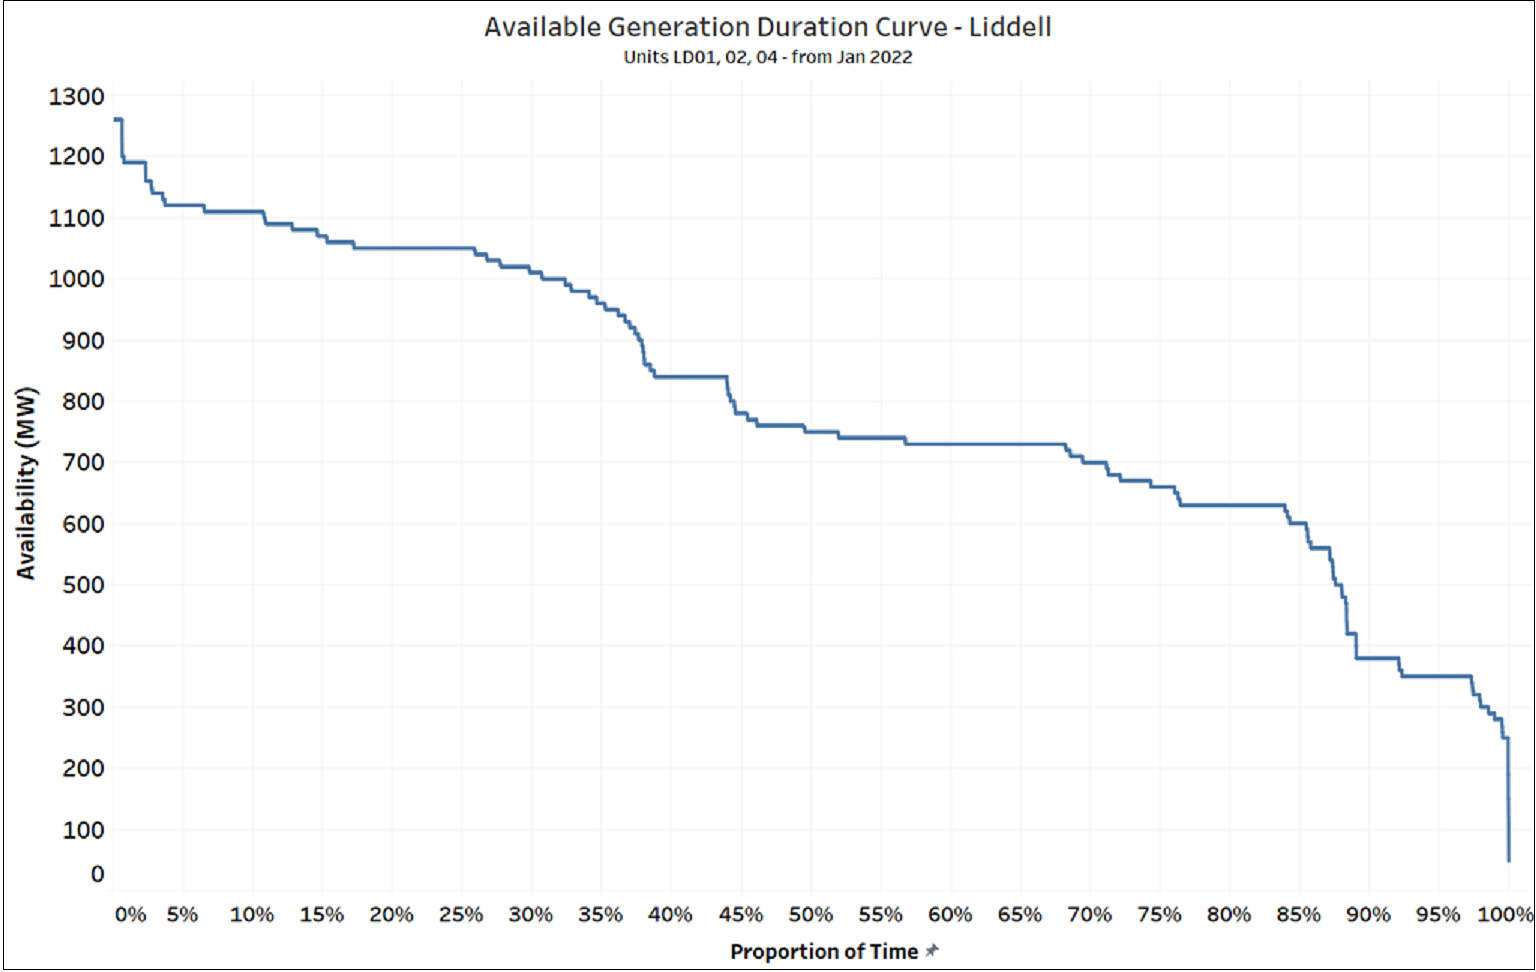
The chart is based on half-hourly aggregate availability of those units (as offered to the market), ordered by descending quantity, and shows that the maximum offered was just over 1,250 MW and exceeded 1,200 MW in only a few percent of all the half hourly periods over the last thirteen months. The average was 800 MW.
Obviously what this reflects is that after fifty-odd years of service, these units are no longer able to be operated – or at least operated safely – anywhere near their original design capacities. (For anyone wondering why AEMO still publishes the Registered and Maximum capacity figures that it does: that’s a whole other rabbit hole, but there are other AEMO processes that ensure that actually achievable capacities, not “nameplate” values, get used in reliability studies, system planning and so on.)
In a strange way, this is a good news story: the system isn’t losing 1,650 MW of real maximum capacity, nor 1,500 MW – only perhaps 1,200 MW at most. A further important takeaway from this chart is that much of the time the capacity available from these Liddell units was well below this level – median three-unit availability was only about 750 MW.
How decrepit is Liddell?
Before hopping into discussions of what might replace Liddell, this is as good a point as any to contrast the performance shown above against a couple of other coal-fired power stations. As Liddell is the smallest four-unit station in New South Wales, as well as its oldest, for comparison I’ve selected a couple of relatively old four-unit stations in Queensland with smaller unit sizes. Tarong is a forty year old 4 x 350 MW plant, while Stanwell, 4 x 365 MW, is about thirty years old.
Lining up the ten-year output profiles for these stations by mashing together a dozen charts from the GSD 2022 we see:
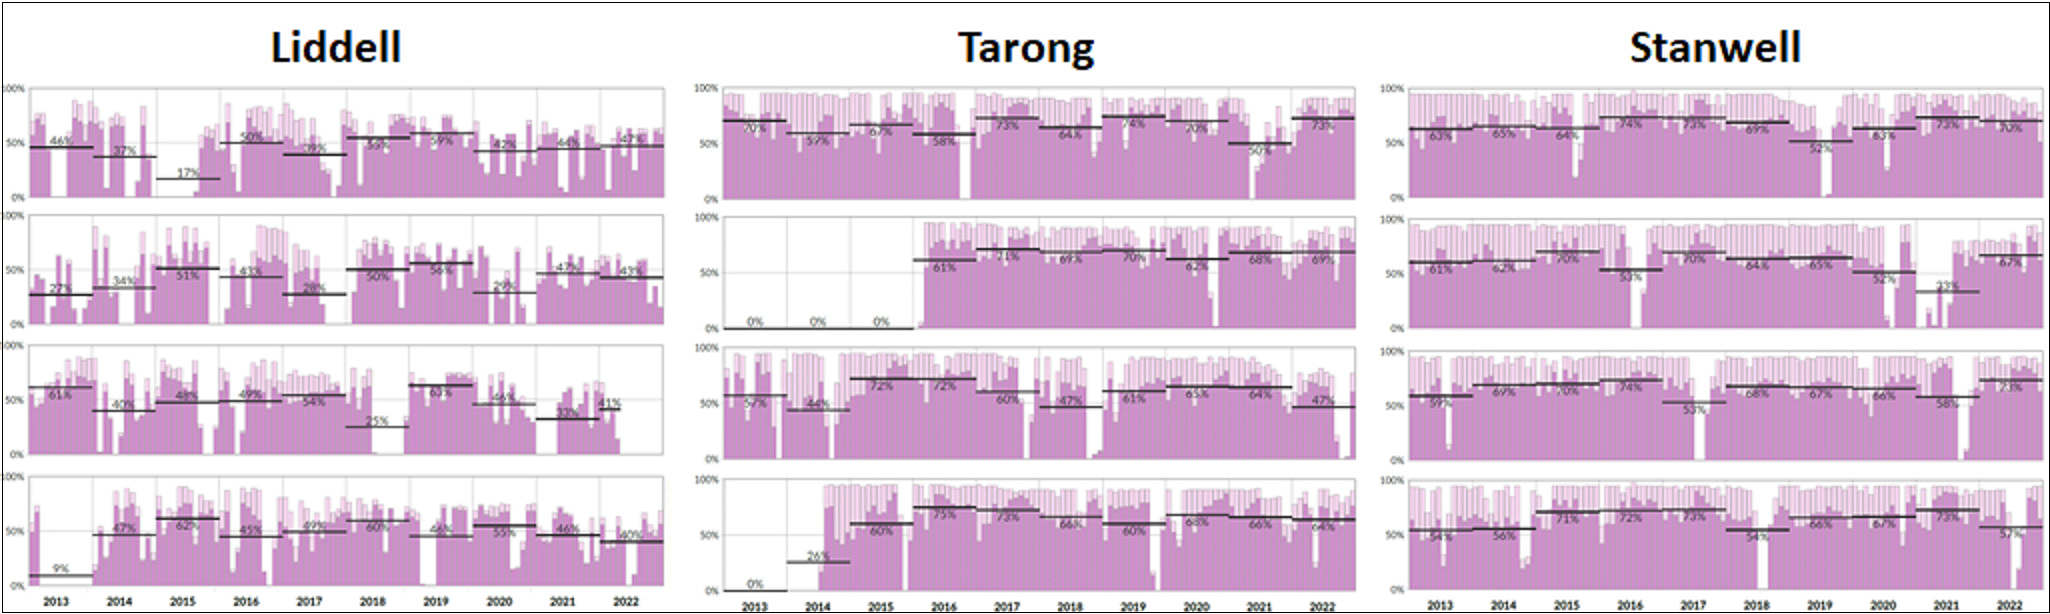
Without reading off any numbers or calculating detailed metrics, it’s immediately obvious just how patchy Liddell’s performance has been for the entire last decade in comparison with its not-quite-as-old Queensland cousins. Both the declining maximum capacity of the Liddell units (in effect represented by the top of the lighter column sections on the charts) and their much more frequent outages are readily apparent.
For those wondering why Tarong units 2 and 4 show zero output for the first three years and first 18 months respectively of the period: for economic reasons (due to oversupply in the QLD region) they were “mothballed” over the duration of the carbon pricing regime (July 2012 – June 2014), with a longer extension for unit 2.
Looking at 2022 in more detail, using a comparison drawn from the GSD’s “B” pages which provide visualisations of daily output and availability data for each unit, we again see just how affected Liddell’s performance has been by outages and reductions in maximum availability:
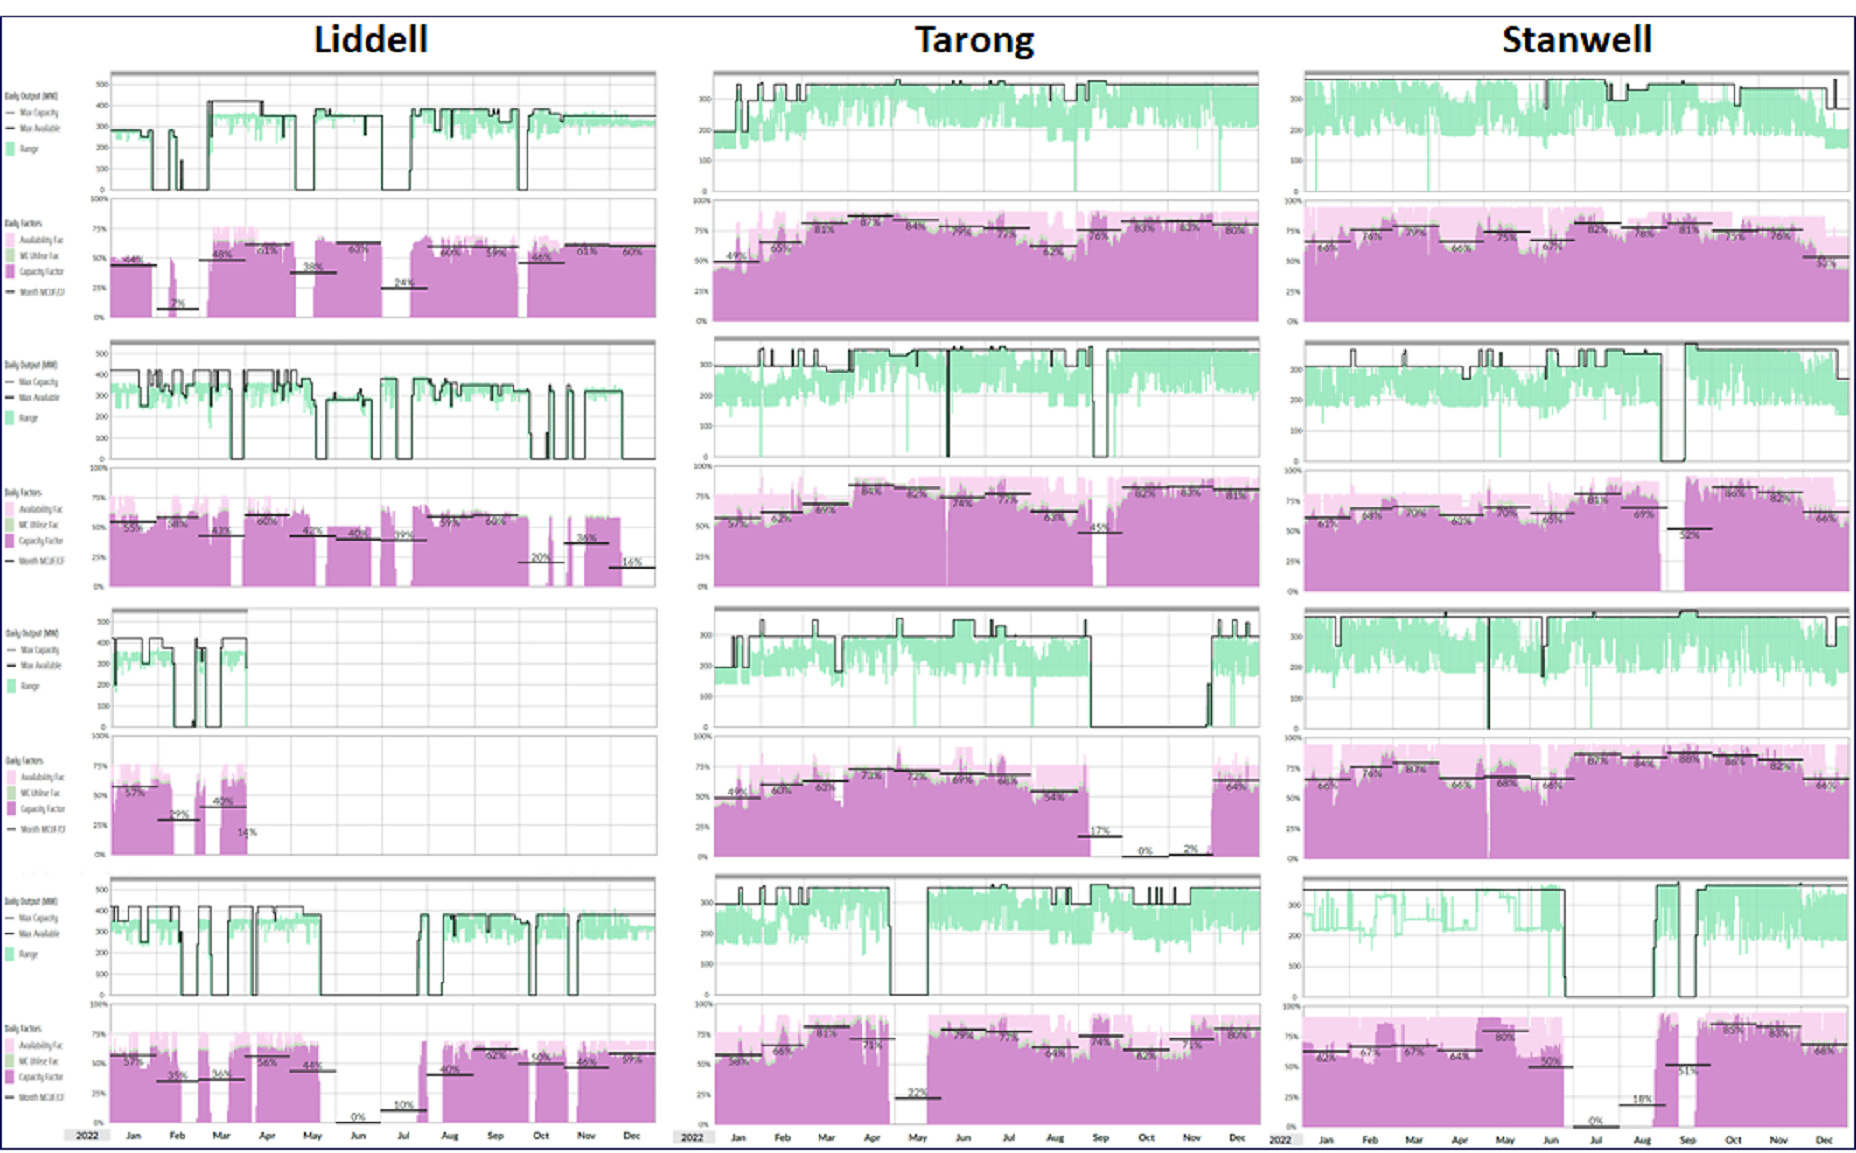
Each of the current Liddell units had five to eight offline periods in 2022, most of which would have been forced outages (breakdowns). By contrast none of the Tarong or Stanwell units had more than two substantial outages, and three of these eight units had no long outages at all. It’s also clear that when online their availability in relation to maximum capacity is consistently far higher than Liddell’s.
Finally – not that it needs emphasis – the much poorer reliability of Liddell over the last decade is highlighted when we look at another GSD metric, the annual number of starts for each unit, which I’ve summarised in this table:

I’ve highlighted clear outlier data for the Stanwell units across 2016-2019, where lengthy recommissioning and testing processes following major outages and control system upgrades at each unit required an abnormally high number of deliberate, short duration unit stops and starts. Taking those out, the annual average numbers of starts per unit were around eight at Liddell, three at Tarong, and only two for the Stanwell units, emphasising just how much more likely to break down the Liddell units have been.
Replacement capacity?
What might cover the (somewhat ragged) capacity gap left by Liddell’s closure? For a quick, high level answer we can look at AEMO’s Generation Information resources which provide information on the status of existing and potential new generation across the NEM. Here’s a summary table from the latest published workbook on that page:
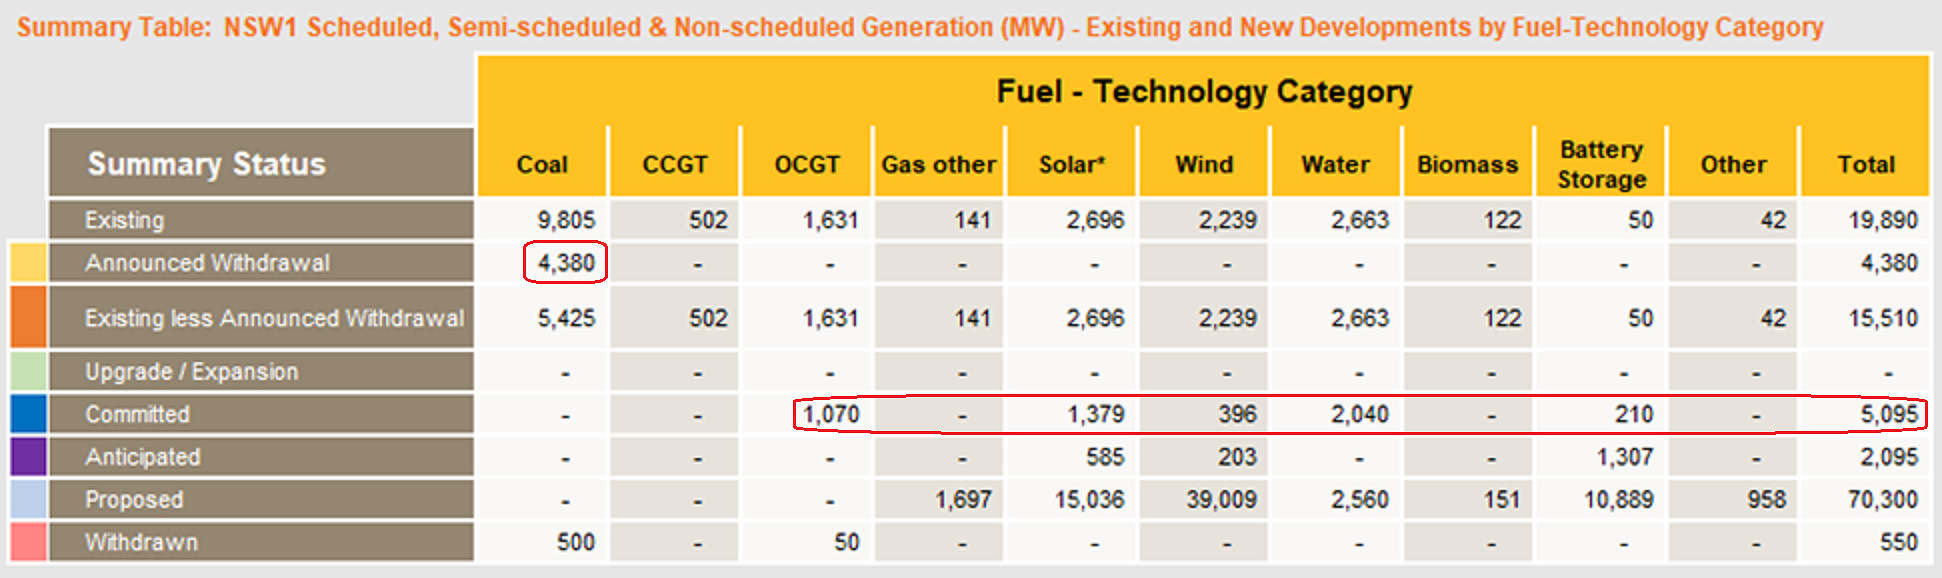
Liddell’s remaining units account for 1,500 MW of the highlighted 4,380 MW of coal-fired capacity listed as “Announced Withdrawal” – which also includes Eraring’s 2,880 MW. Data in this table are reported by AEMO using “nameplate capacity” (usually the same as Registered Capacity). I’ve also highlighted over 5,000 MW of new capacity highlighted as “Committed”. (There’s a lot of detail in AEMO’s documentation on what “Committed” actually means, which I’ll skip over here for brevity.)
There’s no indication on this summary table about when committed new capacity might become available, but a more detailed schedule in AEMO’s workbook provides information on project timing:
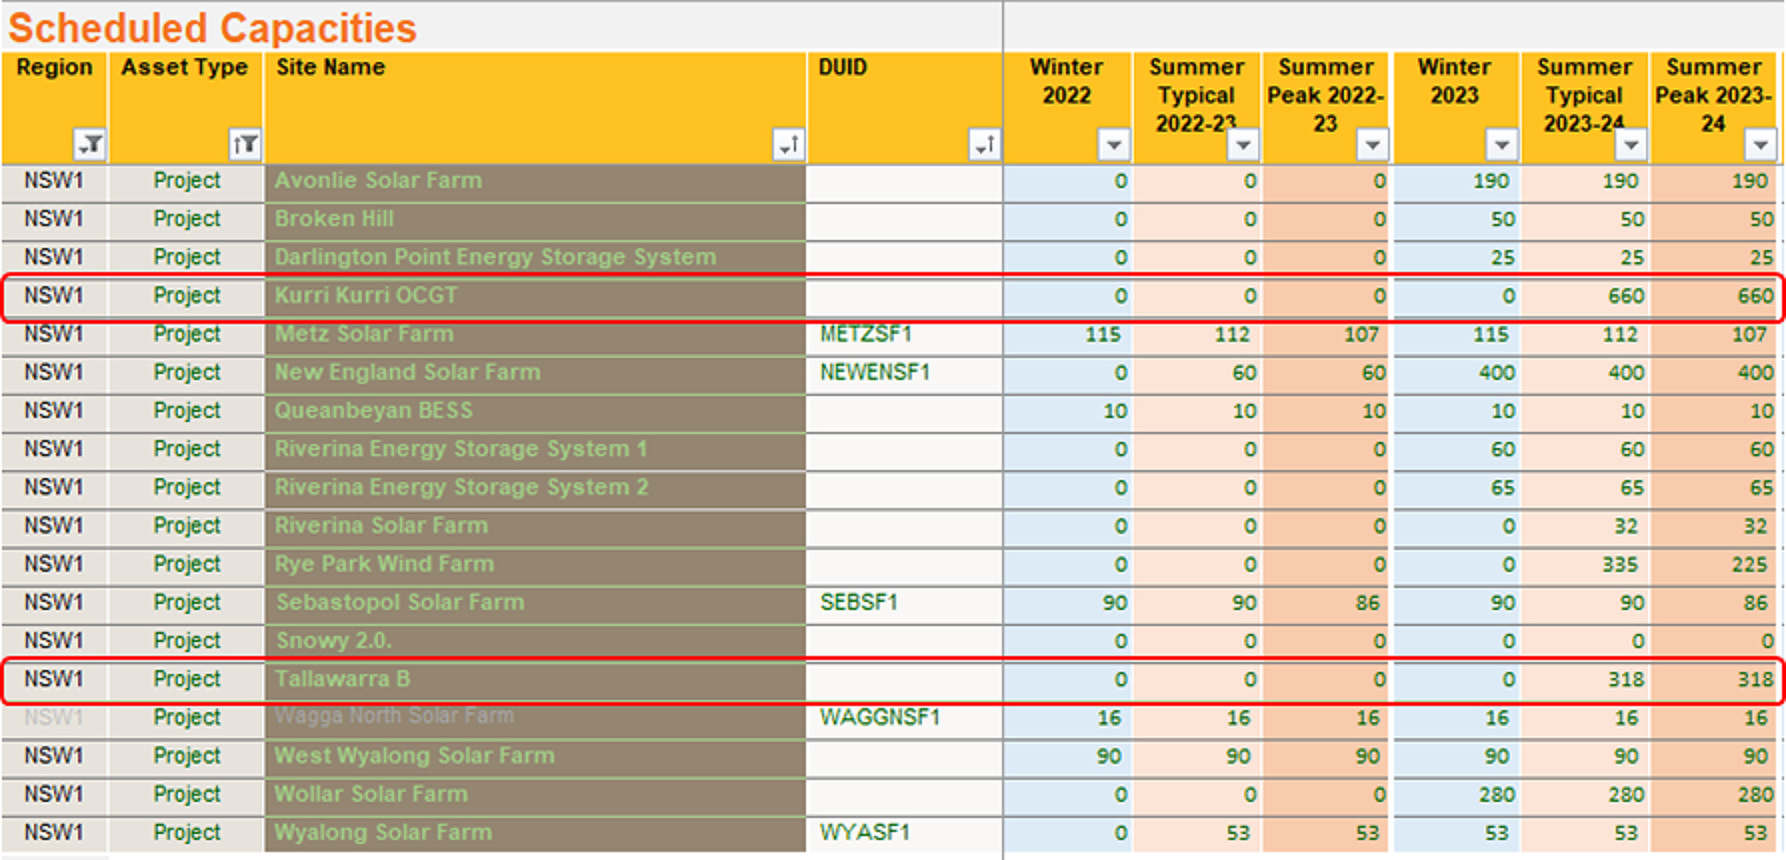
Notably the two new gas-fired peaking projects in New South Wales, Snowy Hydro’s Kurri Kurri (aka Hunter Power Project) and EnergyAustralia’s Tallawarra B are shown as being available for summer 2023-24 (but not winter 2023). These two projects total 978 MW on this schedule (although their combined nameplate capacity as per AEMO’s earlier summary is 1,070 MW.)
Putting aside any arguments (and there have been plenty) about whether these projects – particularly Snowy’s which is being funded by the Federal Government – are strictly necessary for reliability reasons, or economically justified, they are being constructed and their dispatchable capacity will pretty much cover the loss of Liddell’s remaining units.
This does leave (at least) winter 2003 where Liddell will be gone and this new gas-fired dispatchable capacity will not be available. Currently, AEMO’s MTPASA medium-term supply-demand outlook is not highlighting any reliability gap over this period, noting that the ez2view chart below does not explicitly include import capability into New South Wales via the Queensland and Victorian interconnections:
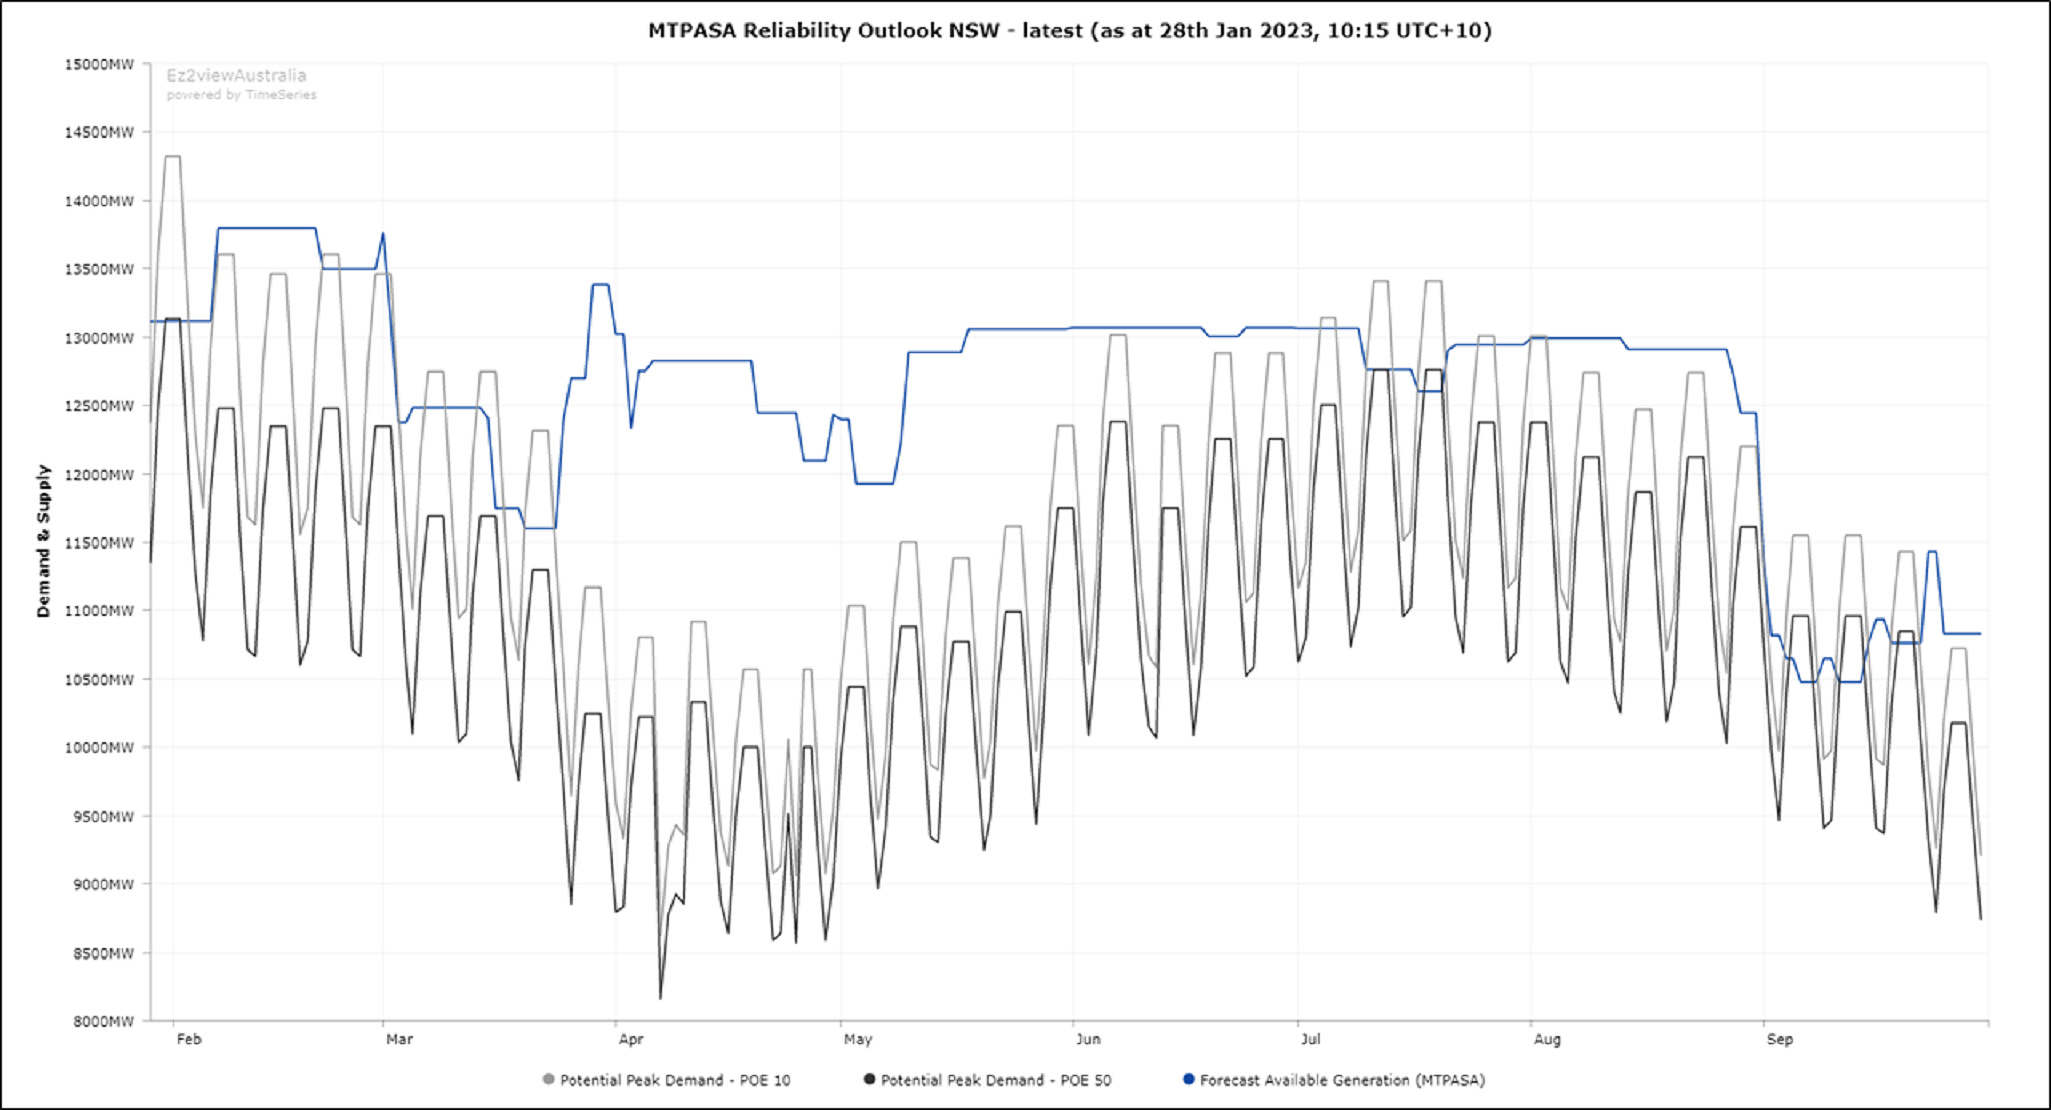
but as always this projection does assume “normal” levels of reliability from other New South Wales generation. Abnormally high levels as experienced going into last winter would again be problematic. There’s no such thing as certainty in reliability modelling.
Of course there’s also plenty of new renewable generation and battery capacity as well as Snowy 2.0 (capacity 2 GW) making up the balance of the 5 GW listed as committed by AEMO, with most of the non-Snowy projects expected to be in service sometime in 2023 – but comparing intermittent and dispatchable capacities is an apples and oranges exercise we’ll leave others to fight about on Twitter.
So the bottom line on capacity is that Liddell’s closure will remove at most 1,200 MW of actual capacity from the market, and for much of the time a lot less than that, given the station’s recent availability performance. By next summer, AEMO is expecting enough new dispatchable capacity to be in place to in essence fully replace that.
But what about energy?
Open-cycle gas turbines like those being built at Tallawarra B and Kurri Kurri are peaking capacity providers, and certainly won’t provide material amounts of “bulk energy” to the system, especially at current gas prices. What will replace Liddell’s lost production, a bit under 7 TWh in 2022 (or “enough energy to power over 1.5 million homes” for those who unaccountably prefer that obscure measure)?
Well, it turns out that’s already been more than taken care of. It’s a question people were asking back in 2017, so let’s look at annual energy production from Liddell and from renewable sources in New South Wales over the last decade:
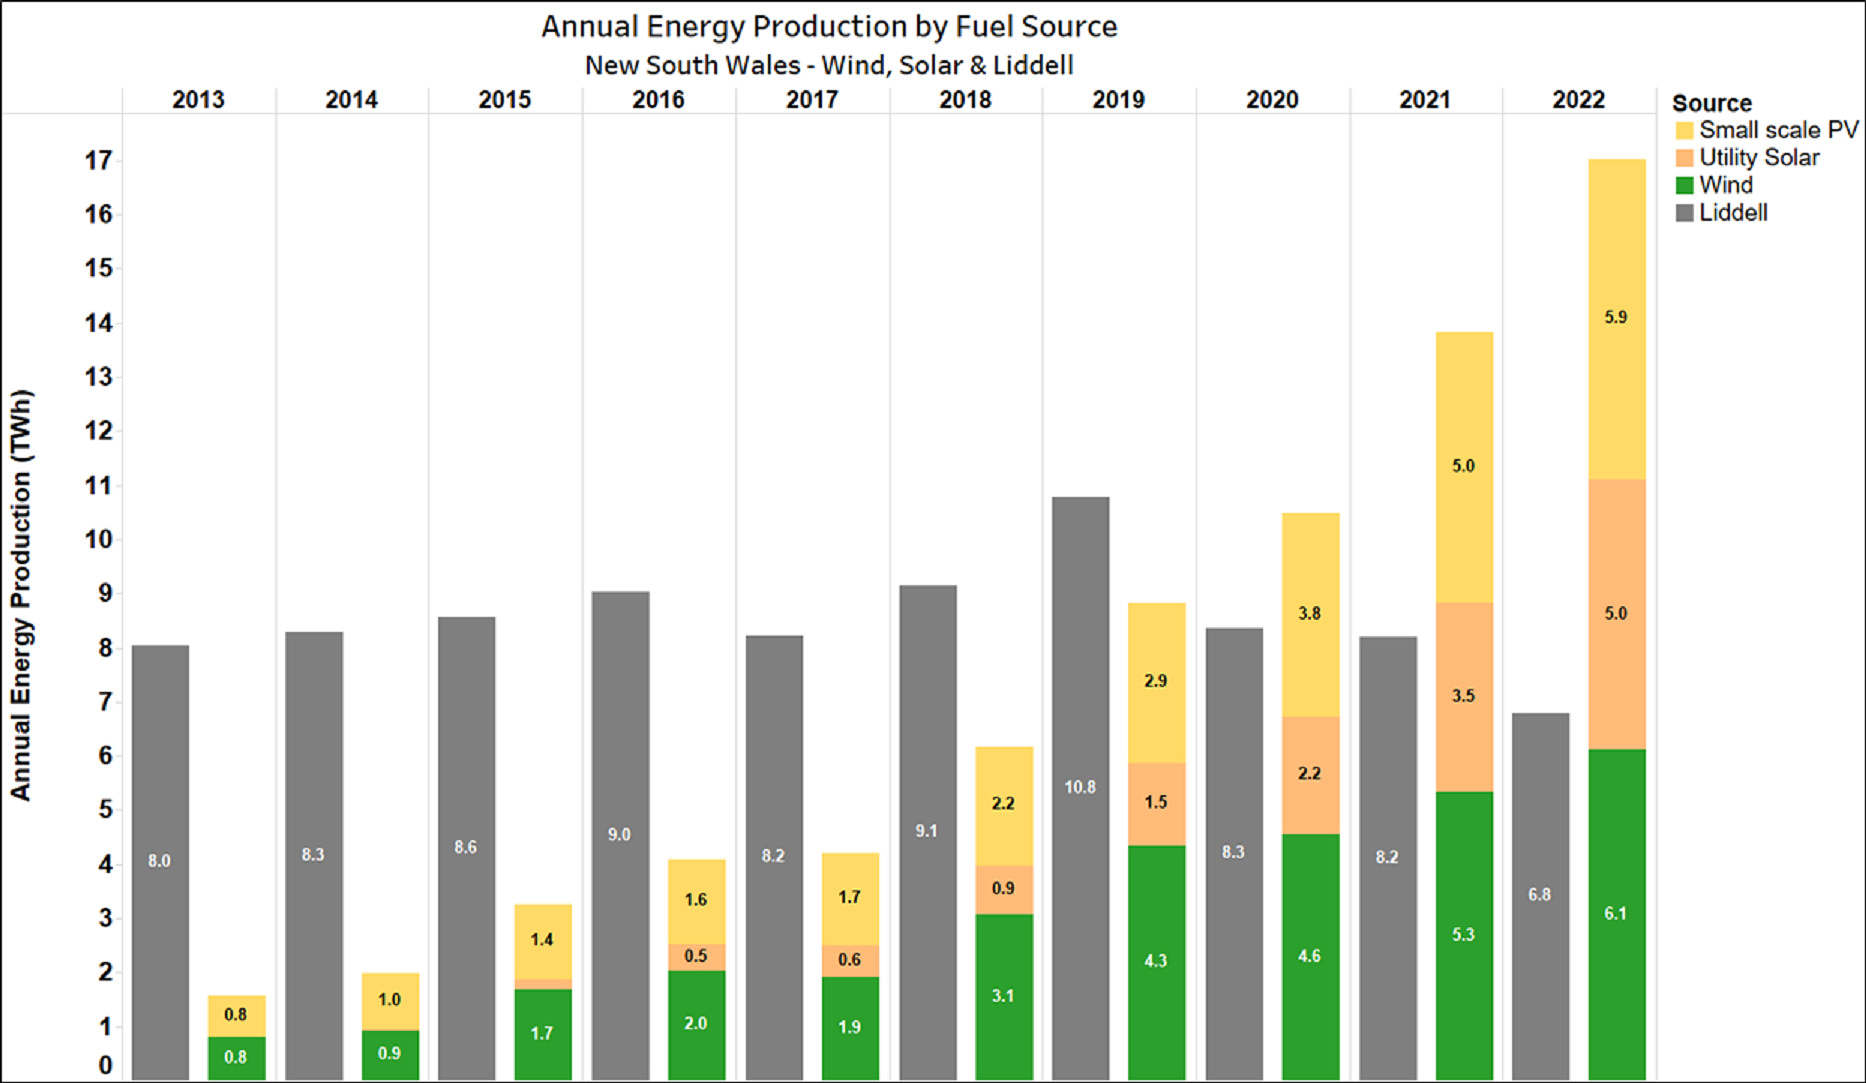
Back in 2017 Liddell produced 8.2 TWh (that’s over 1.8 mega-homes). Large and small-scale renewables in New South Wales produced 4.2 TWh. By 2022 New South Wales renewables produced 17 TWh, growth in output of more than ‘1.5 Liddells’ (to coin another new unit of measure). Without looking any further afield at renewables growth in the rest of the NEM, it’s pretty clear that the energy question has already been answered.
That might seem a bit glib, in that 7 TWh of additional renewable energy isn’t going to be produced in New South Wales in 2023 (although overall NEM-wide renewable production is growing at around 8 TWh per year), and not necessarily at the same times that Liddell might have produced it.
In practice Liddell’s lost energy over the balance of 2023 will be made up from a mix of renewables growth and some increases in production from other existing plant, both in New South Wales and elsewhere in the NEM. But the overall point is that with pretty flat consumption growth in New South Wales since 2017, more than enough new bulk energy capability has already been added in that region alone to cover what Liddell was producing back when its announced closure prompted all the “sky will fall in”-style commentary mentioned at the start of this article.
I guess the moral of the story is that while it’s easy to point to gaps that closure of specific assets appear to create, it’s harder to be specific about what will cover those gaps – until we have the benefit of hindsight and reports like the GSD to make more measured assessments.
=================================================================================================
About our Guest Author
 |
Allan O’Neil has worked in Australia’s wholesale energy markets since their creation in the mid-1990’s, in trading, risk management, forecasting and analytical roles with major NEM electricity and gas retail and generation companies.
He is now an independent energy markets consultant, working with clients on projects across a spectrum of wholesale, retail, electricity and gas issues. You can view Allan’s LinkedIn profile here. Allan will be ocassionally reviewing market events here on WattClarity Allan has also begun providing an on-site educational service covering how spot prices are set in the NEM, and other important aspects of the physical electricity market – further details here. |
Guessing this should say “winter 2023”
This does leave (at least) winter 2003 where Liddell will be gone and this new gas-fired dispatchable capacity will not be available. Currently, AEMO’s MTPASA medium-term supply-demand outlook is not highlighting any reliability gap over this period, noting that the ez2view chart below does not explicitly include import capability into New South Wales via the Queensland and Victorian interconnections:
nice topic
Farewell Liddell – thanks for the memories! For sliding doors, safety glass, and mirrors, visit us at sliding door Services.