It’s the end of the working week that included both:
1) the All Energy conference in Melbourne, at which there was much discussion about the energy transition, along with some one-on-one conversations about the notion some hold that ‘the NEM is terminal’ (or words to that effect – more about that in GenInsights Quarterly Updates for Q3 2022).
2) there were also a number of interesting reports released – including:
(a) The QED for Q3 2022; and
(b) The preliminary report into the major incident in Tasmania on Friday 14th October 2022; and
(c) The Scheduling Error Report about the operating glitch on 10th August 2022.
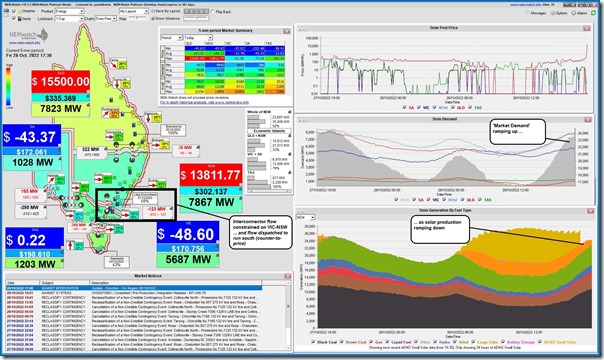
At 17:30 we saw the prices spike sky-high in QLD and NSW regions, as captured at the time in NEMwatch:
I don’t have much time this evening, but still wanted to have a quick initial look…
(A) Constrained flow on VIC-NSW
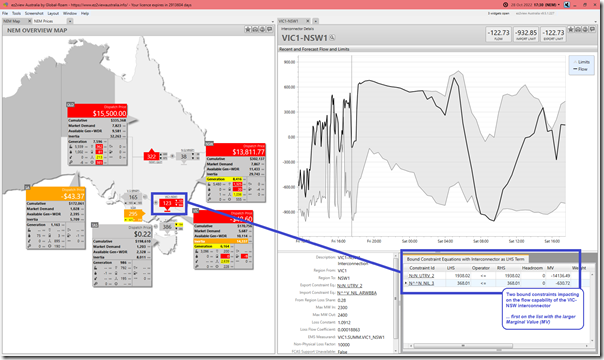
To do this, I’ve opened up ez2view and time-travelled the display back to 17:30:
1) still within the current day, so no ‘next day public’ data like bids yet …
2) but providing an ‘end-of-interval’ view of what happened for the 17:30 dispatch interval:
From this image I’d like to highlight:
1) Via the colour coded alerts on the map that:
(a) In NSW production levels rose, in aggregate:
i. There’s a large increase in generation from hydro (1,325MW – up from 874MW);
ii. Wind production fell noticeably (from 1140MW down to 1036MW) – whether due to a downturn in wind, or congestion, I have not looked.
iii. BESS output is coloured red because of a large percentage increase, but from a low base;
(b) In VIC, we see:
i. Wind production also fell noticeably (from 2926MW to 2639MW) – whether due to a downturn in wind, or congestion (or the negative price) I have not looked; and
ii. The negative price drove down BESS production to 0MW.
2) It’s also worth noting (from the chart of the interconnector) that we see the target flow on VIC-NSW went:
(a) from +273MW at 17:25 (i.e. remembering positive numbers mean flow north)
(b) to –123MW at 17:30 (i.e. at
3) As highlighted on the image, there are two constraint equations bound that are affecting the
(a) There’s the ‘N^^N_NIL_3’ constraint equation, which is also referred to as the ‘x5 constraint’ which:
i. Has been discussed in other articles here on WattClarity; but
ii. Won’t be explored further in this one.
(b) On this occasion it is the ‘N::N_UTRV_2’ constraint equation that sees the much larger Marginal Value, which (at –14,136.49) suggests it is the one that is leading to the price separation between regions.
So let’s have more of a look…
(B) The ‘N::N_UTRV_2’ constraint equation
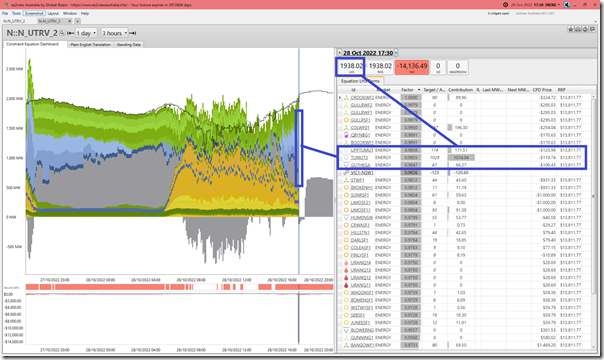
So with the advantage of the newly released ‘Constraint Dashboard’ widget in ez2view v9.5 we’ll have a look at this particular constraint equation:
With respect to this equation:
1) it’s not shown in the visible part of the widget captured above, but:
(a) this constraint equation is a member of the ‘N-RVYS_2’ constraint set,
(b) which relates to outage of the Ravine -Yass(2) 330kV line outage;
(c) which is an outage running through until 5th November (and then, after a couple day break) through until 25th November 2022.
(d) this equation is only one of 13 equations in this particular set currently.
(e) Note that this constraint set has featured in prior articles on WattClarity.
2) This particular equation imposes a stability limit (Snowy-NSW) for fault at various location between Yass and South Morang area
3) There are a large number of DUIDs that are components of the left-hand side (LHS) of the equation:
(a) which readers will remember are the terms that NEMDE tries to optimise in dispatching the market with respect to a RHS that is effectively a fixed quantity for a Dispatch Interval.
(b) remember that Dispatch Targets are not public in real time (only published ‘next day’, as with bids and other data) so this widget today is showing an approximation of LHS contributions using FinalMW values (i.e. assuming units are following their targets closely).
4) Of the LHS terms shown in the visible part of the table shown here, the hydro units contribute more than half of the aggregate LHS….
(a) and in particular the TUMUT3 unit contributes (approx 1014MW) more than half of the LHS (1938MW).
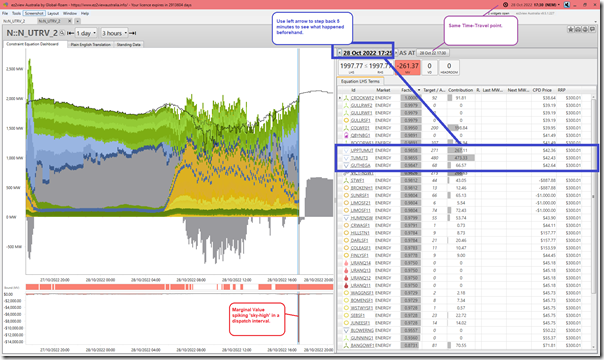
(b) If we step backwards in the table 5 minutes, we see that the contribution from TUMUT3 was much lower 5 minutes beforehand:
In conjunction with the sharp increase in production from hydro (noted above) we see that the aggregate LHS contribution from hydro at 17:25 was much lower than it was at 17:30.
————
This will be something of interest to return to tomorrow or later, when we have more data available to understand what’s happened.
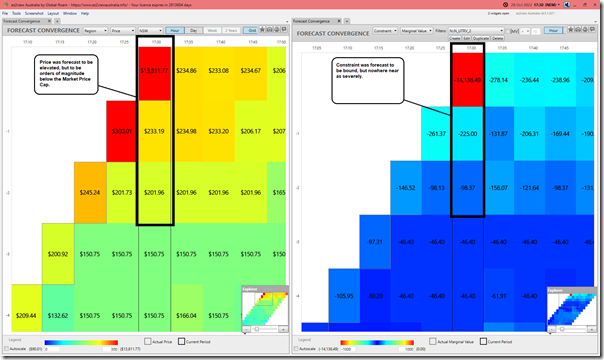
(C) Forecast Convergence
Remembering the value of ‘looking up a vertical’ to review that other dimension of time, we’ve opened up the ‘Forecast Convergence’ widget in ez2view and composed a window of 2 widgets to show the following:
In this window we see that:
1) Not only did the price spike come with an element of surprise;
2) So did the severe binding of the constraint equation (which makes sense, as they are related).
That’s all for now…


Leave a comment