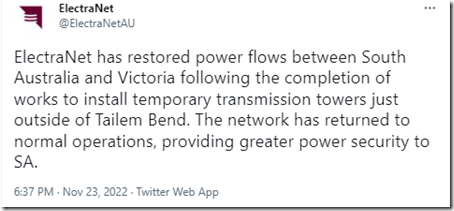
Late yesterday (Wed 23rd Nov 2022) ElectraNet reported that they’d completed some of the first stage repairs on the damaged Heywood interconnector:
The tweet above was accompanied by the note added to this news article here:
‘Wednesday 23 November update – 7.00pm (i.e. this would be SA time, so 18:30 NEM time)
ElectraNet has restored power flows between South Australia and Victoria following the completion of works to install temporary transmission towers just outside of Tailem Bend.
The network has returned to normal operations, providing greater power security to the state and reducing the need for generation constraints.
ElectraNet’s Chief Operating Officer, Rainer Korte, said, “On Saturday, 12 November, a severe weather event damaged a 275 kV transmission tower just outside Tailem Bend, temporarily disconnecting South Australia from the National Electricity Market. Power supply to ElectraNet’s customers was not impacted as a result of the incident.”
“Between 40 and 50 ElectraNet staff and contractors have been working hard on site since the storm event to remove the damaged tower, undertake necessary civil works and install two temporary bypass circuits.”
“Planning is now underway to get a new, permanent transmission tower for the site”, Rainer said.’
This update prompts me to provide the following quick and initial overview of events over the past twelve days since the islanding occurred.
(A) Trending over the week
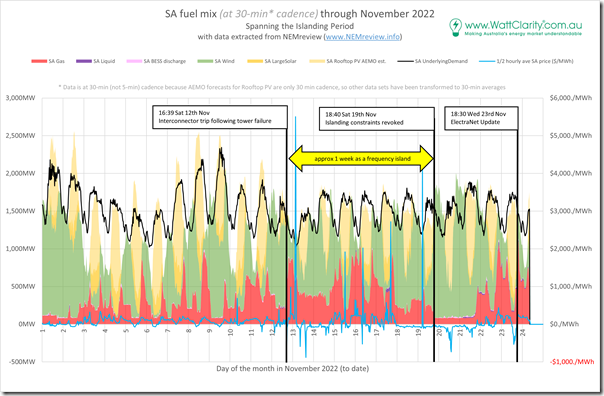
With data extracted from NEMreview v7 I’ve prepared the following trend and added some annotations to help the reader visualise some of what happened through the period:
We can see that the islanding itself lasted almost exactly one week – but it should be noted that ‘the event’ could be viewed as much broader than that – as noted below…
(B) Day by day through the period
With the chart above as the reference, here’s a quick recap of what we saw as it unfolded:
| Day | Description |
|---|---|
|
Sat 12th November |
There was an intense storm (this article provides some context) that contributed a large number of lightning strikes. Linton and Adam have since performed analysis of different aspects of wind farm performance on the day leading up to the islanding. — At 16:39 the Heywood interconnector tripped as a result of storm damage: 1) it was Sunday when we saw first picture of the damage, and 2) Monday when Electranet provided this update about what had happened. — In terms of the effects of the trips … 1) we subsequently provided this review of several dispatch intervals either side. 2) Dan showed how there were some frequency fluctuations as a result (thanks to Solar Analytics data), as would be expected: (a) South Australia, being the smaller region that had been exporting at the time, shot up to 50.5Hz measured on 5 second snapshots (probably higher with high-speed readings); (b) The eastern NEM, being the larger zone with higher inertia as well, saw the frequency drop by by a much smaller extent. 3) First night living on the island saw some volatility emerge … this is visible in the chart above, from which we can also see some other broader macro factors that probably contributed. 4) We also posted this forward-looking view of the week ahead.
|
|
Sun 13th November |
Curtailment of rooftop PV occurred on Sunday 13th November – indeed, so much curtailment was required that SAPN resorted to requests on social media. |
|
Mon 14th November |
Curtailment of rooftop PV occurred on Monday 14th. On this day Allan provided this review of FCAS prices in South Australia before and after the event. Dan also noted that the APC was applied to FCAS prices in South Australia on this day. |
|
Tue 15th November |
Curtailment of rooftop PV occurred on Tuesday 15th. We also noted that AEMO experienced some challenges with P5MIN file creation latency, which we think are (at least in part) a result of the more complex network. |
|
Wed 16th November |
Curtailment of rooftop PV occurred on Wednesday 16th. |
|
Thu 17th November |
Curtailment of rooftop PV occurred on Thursday 17th. This was the day that ElectraNet had noted it was particularly concerned about, given the forecast sunny conditions and expectations of high rooftop solar yield. In the chart above we also see it was a day of modest Underlying Demand as well (the whole week was like that), making the challenge of low Market Demand more acute. The chart above captures some effect of the volatility reported on the day. |
|
Fri 18th November |
There was no curtailment of rooftop PV … because of cloudy weather perhaps? |
|
Sat 19th November |
Curtailment of rooftop PV occurred on Saturday 19th. A noted at the time, the island was reconnected Saturday evening 19th November with a temporary structure in place. |
|
Sun 20th November |
No observations at this point. |
|
Mon 21st November |
No observations at this point. |
|
Tue 22nd November |
No observations at this point. |
|
Wed 23rd November |
Wednesday evening, ElectraNet provided us the update noted above. |
|
Thu 24th November |
… which brings us to today. Note that Administered Pricing still applies to FCAS prices in the South Australian region. |
Hopefully the table above, when read in conjunction to the chart, will be useful.
(C) A broader view of the event
I’m taking a break for a couple weeks, but wanted to quickly flag a few questions that occur to me … inspired partly by these ‘13 headline questions and observations’ from back in 2020 with the islanding event at that time:
| Period | Description |
|---|---|
|
Pre-event conditions |
Prior to the event there are other questions I have about the conditions occurring prior to that time. 1) Linton and Adam have since performed analysis of different aspects of wind farm performance on the day leading up to the islanding – but there are also similar questions about performance analysis for solar PV: (a) The few Large Solar Farms in South Australia – but potentially broader eastwards as well, with the storm front; (b) But also rooftop PV (e.g. questions such as ramps up and down as the storm front past, how forecastable it was, and so on). 2) I’ve not had time to think much about the extent to which the ‘lessons learnt from the SA System Black’ have helped with this particular response: (a) What was the network configuration, noting up-front that there’s an important distinction between: i. In the SA System Black Heywood was called on to import massively above its limit following simultaneous trip of wind farms; ii. Whereas in this case SA was exporting at the time of the trip; (b) What other preparations were taken? 3) There are also broader questions about weather forecasting: (a) How well forecast was this event; and (b) What’s likely to happen into the future as we deal with a climate-changed world (but also increasing investment and sophistication in forecasting methodologies). 4) Was there anything notable in Market Participant preparations (e.g. in terms of plant being made available, or bid differently, and so on)? … plus others |
|
Event trigger |
It was another transmission tower failure that triggered this event (and follows closely on the tower failure due to landslide in Tasmania). 1) This makes me wonder what we might find in some form of longitudinal review of the frequency of these events, and what we might expect in future as the climate continues to change? 2) It makes me wonder what’s being assumed for transmission line/path forced outage rate in modelling performed of the NEM: (a) Not just in headline reports such as the ISP and the ESOO; (b) But also in the consultant-based modelling that feeds into individual business case assessment of particular projects? … for instance, the modelling completed for Project Energy Connect is topical today (re the early closure announcement for Torrens B) – what did this assume, in terms of the reliability of the Heywood and SA-NSW links? … plus others |
|
Stabilisation (milliseconds, seconds, minutes, hours) |
There’s a whole series of questions about the types of automated responses in place for this event: 1) Dan’s started to explore some frequency fluctuations, but there are layers of questions in there – will wait to see the AEMO Interim Report on this: (a) How did the level of inertia affect the rate of increase of frequency in SA? (b) What was the effect of the synchronous condensers (or, at an even more basic level, how many were operational – I’ve not looked)? (c) What else triggered to arrest the rise in frequency: i. What was the contribution of PFR? ii. What happened with Regulation? iii. What happened with Contingency FCAS? 2) The above types of questions were related to the ‘automatic at a physical level’ type of responses (a timeframe of milliseconds) – but there are also the ‘automatic at a commercial level’ type of responses (a timeframe of Dispatch Intervals) – speaking of automated rebidding. There are questions in there about who did what and when? … plus others |
|
Recovery and restoration (days) |
Once past the initial hump in frequency there were the other steps manually taken on the Saturday evening that would also be good to explore. 1) Such as the constraint sets that were invoked; 2) Such as bids manually entered for physical plant as a whole, and individually. 3) Such as the curtailment of rooftop PV … we’ve written a few articles, and shared some others as well, but there’s much I have not had time to learn about these processes 4) Electranet has provided some reporting of their physical repair process to get this far with temporary structures – I’m assuming a more formal report will be prepared at some point. … plus others — In the chart above we can see that the fuel mix in SA was noticeably different for much of the 7 day period when SA was islanded (e.g. more thermal generation) compared to the period beforehand (e.g. less thermal generation). This is a reason why in our recent upgrade of ‘the NEMwatch widget’ we added in real time percentages for VRE and Renewables in the NEM – but not for individual regions: 1) In our view, as an actionable metric a view such as ‘% Renewables’ for an individual region is overly simplistic to the point of being misleading because if obscures/ignores any role of interconnection and the role the neighbouring region(s) play. … one might call it a ‘Vanity Metric’ rather than a really Useful Metric. |
|
Longer-term repairs (weeks and months) |
Now that the ‘temporary’ link is up and running, attention will switch to the implementation of a permanent repair. I have not looked to see what the timeframe might be for this. |
That’s all I have time for now…


Leave a comment