
On Saturday 13th of November, thunderstorms and strong winds caused multiple trips within South Australia’s transmission network and brought down a transmission tower that forms part of the Heywood interconnector – which links the region with Victoria. The loss of the interconnector meant that SA was ‘electrically islanded‘ from the rest of the NEM, this forced the curtailment of some rooftop solar PV systems across the state along with causing a handful of other operational issues.
If you’ve somehow missed our coverage, Paul’s play-by-play review of Saturday afternoon and Allan O’Neil’s investigation into the ensuing price spikes in the FCAS markets will help get you up to speed with the details and implications of Saturday’s events.
Today I’ve done a quick analysis of 5-second frequency data (courtesy of Solar Analytics) in SA and VIC to show the resulting swings in frequency after the region was disconnected.
A messy separation
Power systems in Australia, including the NEM, operate on a nominal frequency of 50Hz which would represent a perfect balance of supply and demand. In order for the system to operate safely and securely, it needs to operate at a frequency as close to 50Hz at all times.
In the NEM, the Normal Operating Frequency Band (NOFB) is the acceptable range of frequency under regular conditions and it is currently set at between 49.85Hz and 50.15Hz. If frequency strays too far outside of the range for too long, generators and other equipment may start disconnecting from the system in order to protect themselves against damage, which can then start a cascading effect, further causing system insecurity. During large unexpected events (e.g. the trip of an interconnector..), contingency mechanisms and other emergency schemes are used to arrest the variation and return the power system back to a safe operating frequency as quickly as possible while attempting to minimise consumer impact.
I’ve made the chart below using 5-second frequency data from hundreds of devices across SA and VIC. This has been trended over one hour to show the frequency separation between SA and VIC once the interconnector tripped.
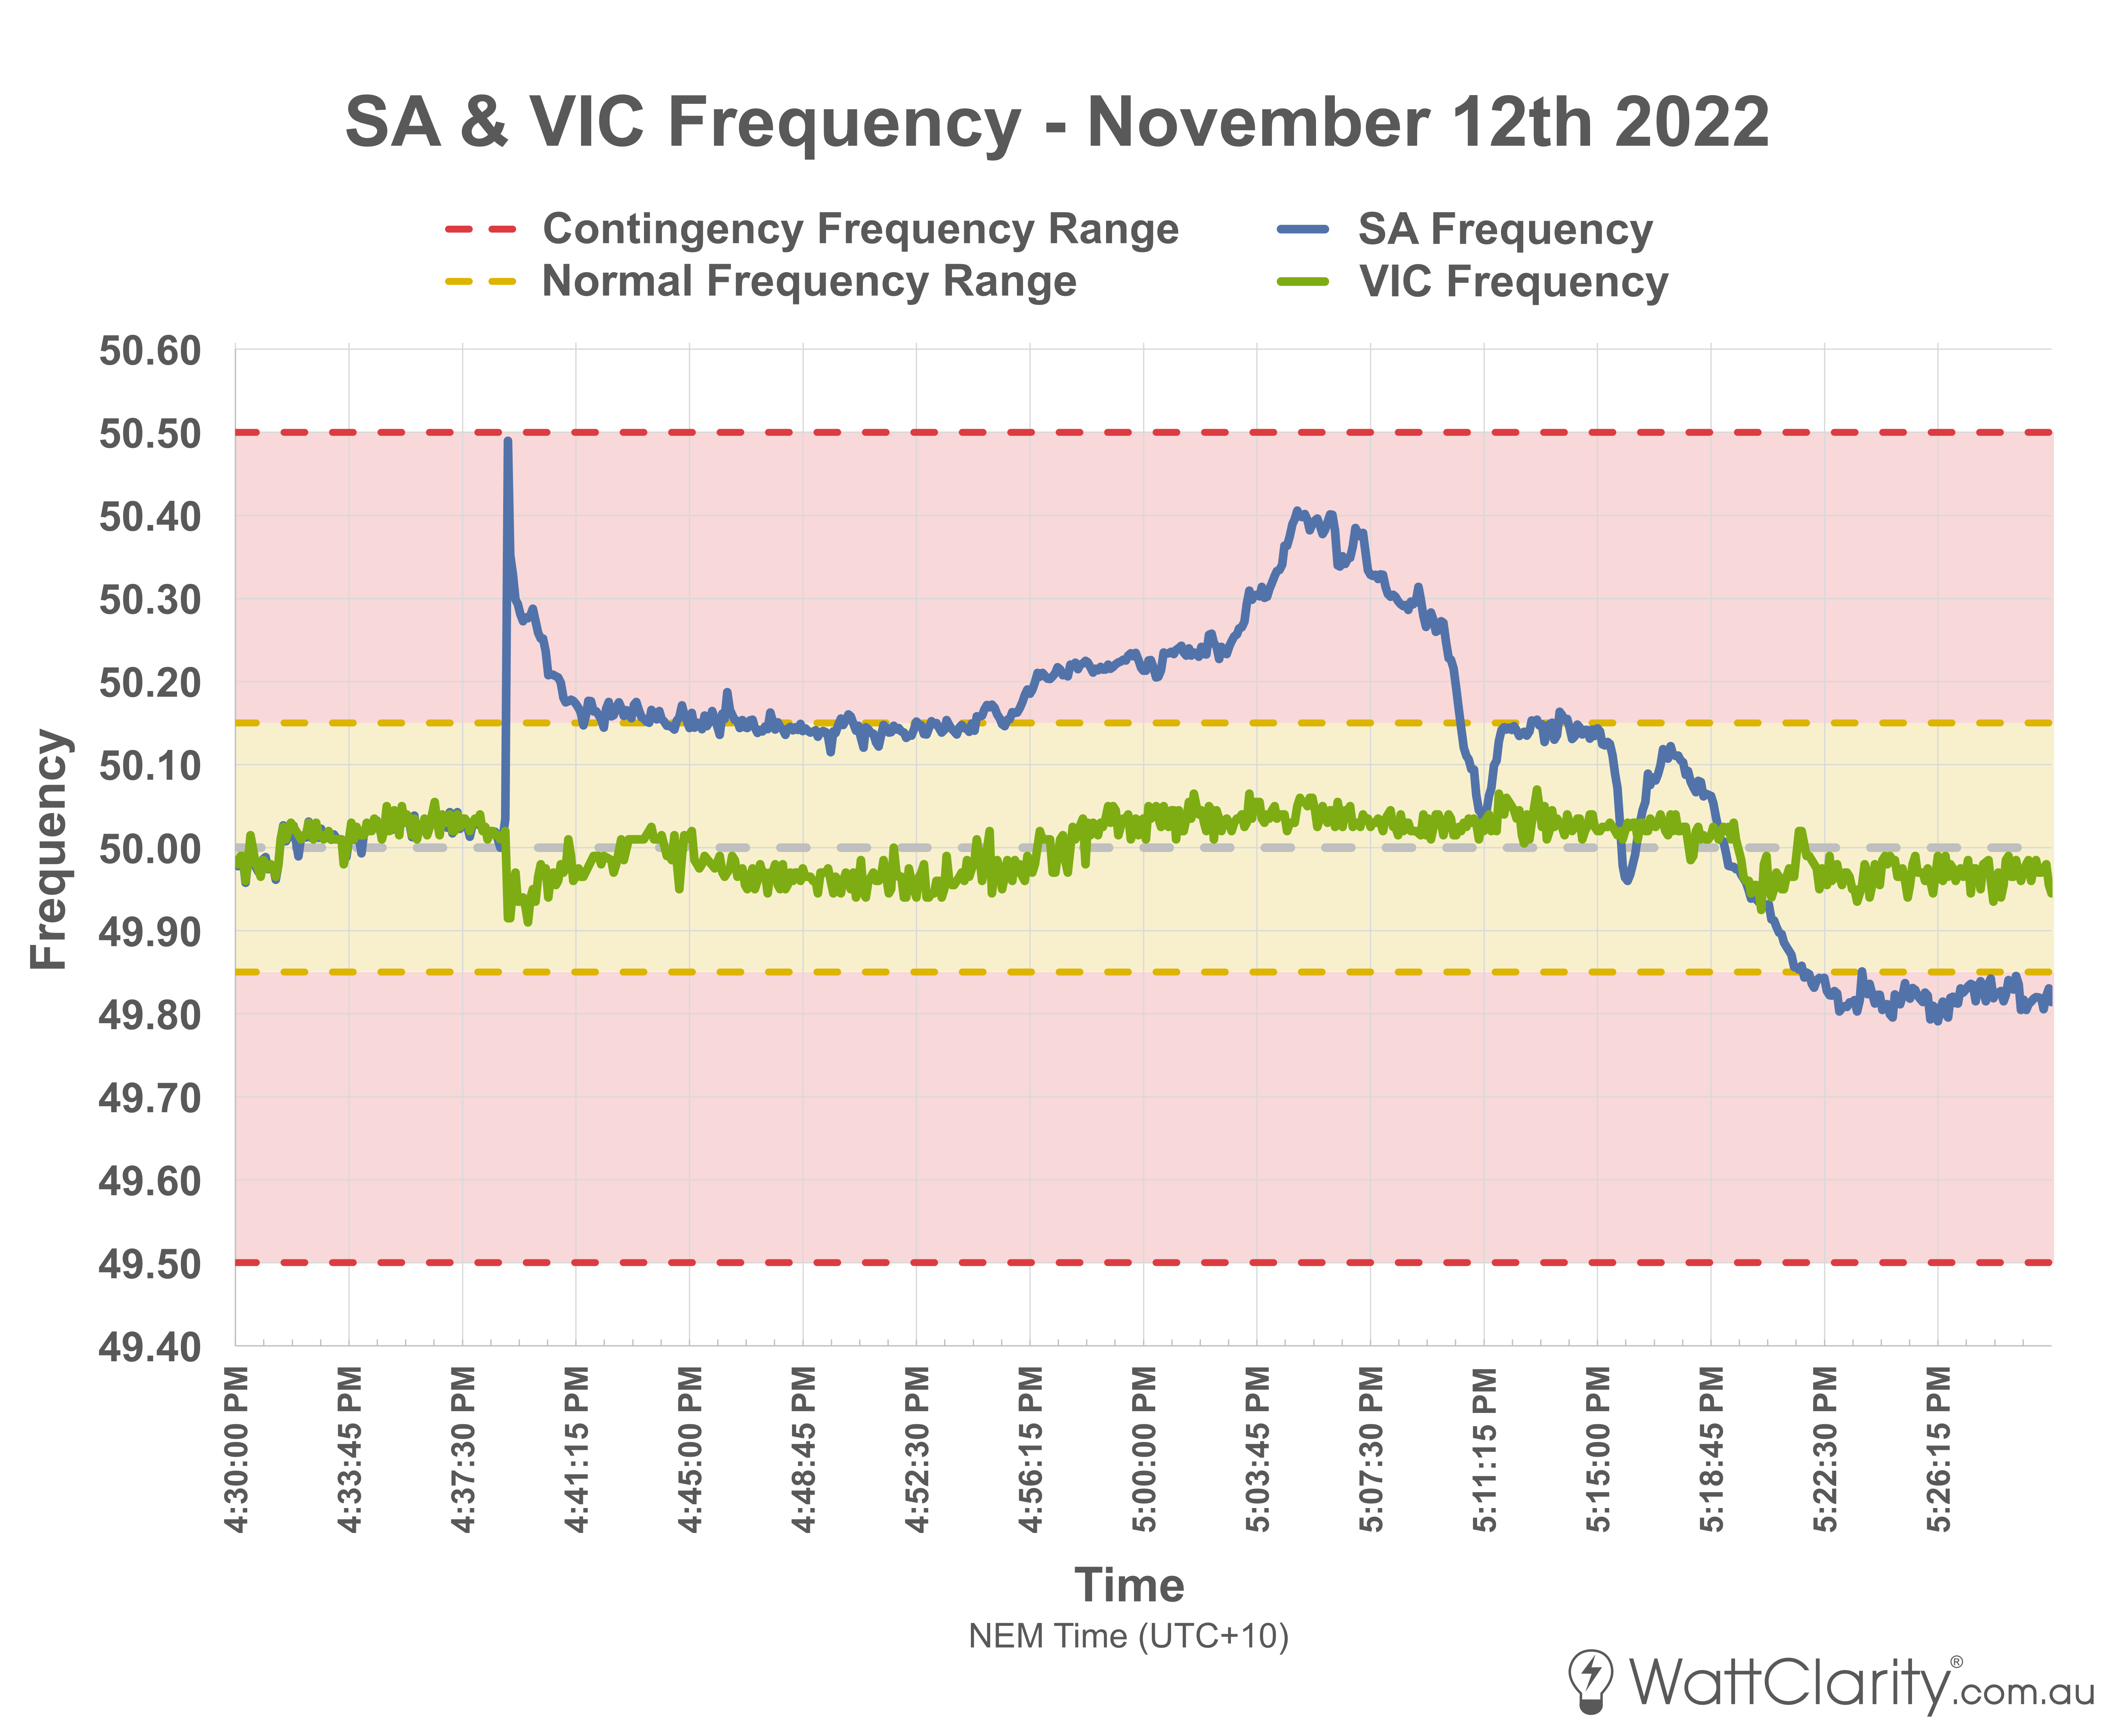
SA and VIC frequency go their separate ways once Heywood trips, with SA taking the break-up a little harder than VIC.
Data Source: Solar Analytics
Frequency ranges shown are as defined by the AEMO.
A disturbance in the SA frequency can be noted at 4:39PM (NEM Time), around when the Heywood line went down. At the time, SA was exporting to VIC which is why you can see its frequency jump higher once the interconnection was lost. During the initial spike, SA frequency hit the limits of the contingency range, taking four minutes to be contained back to normal operating territory. Around 14 and a half minutes later, it rose back outside of the normal operating range.
Frequency Operating Standards
The AEMC defines operating standards for frequency during normal operation and for supply scarcity and other contingency events.
The standards, last amended in January 2022, include guidelines for acceptable bands during islanding events. For convenience, I’ve copied the relevant table from that document below.
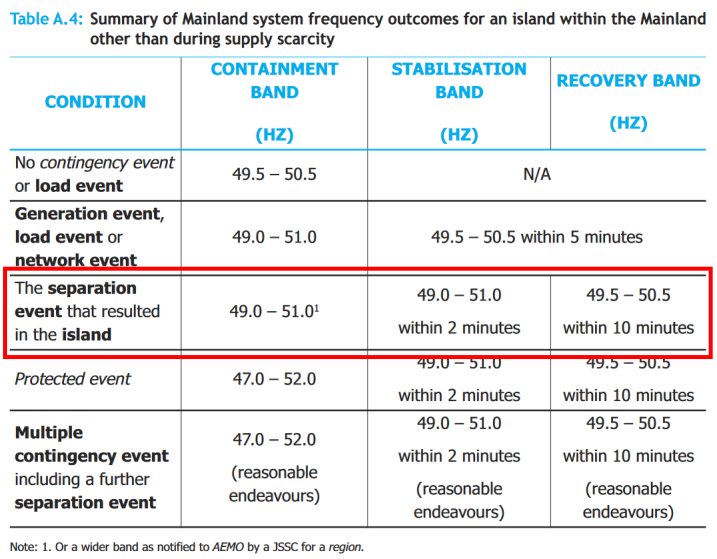
The NEM’s mainland system frequency standards during islanding
Source: AEMC Frequency Operating Standards
On Saturday, frequency (at least at a 5-second cadence) does not appear to have strayed above the 51.0 Hz stabilisation limit within the first 2 minutes.. but a high-speed trace will undoubtedly show more detail.
The tortuous rebound..
In the chart below, I’ve extended out SA frequency into late Saturday evening to show the subsequent six and a half hours after the line went down.
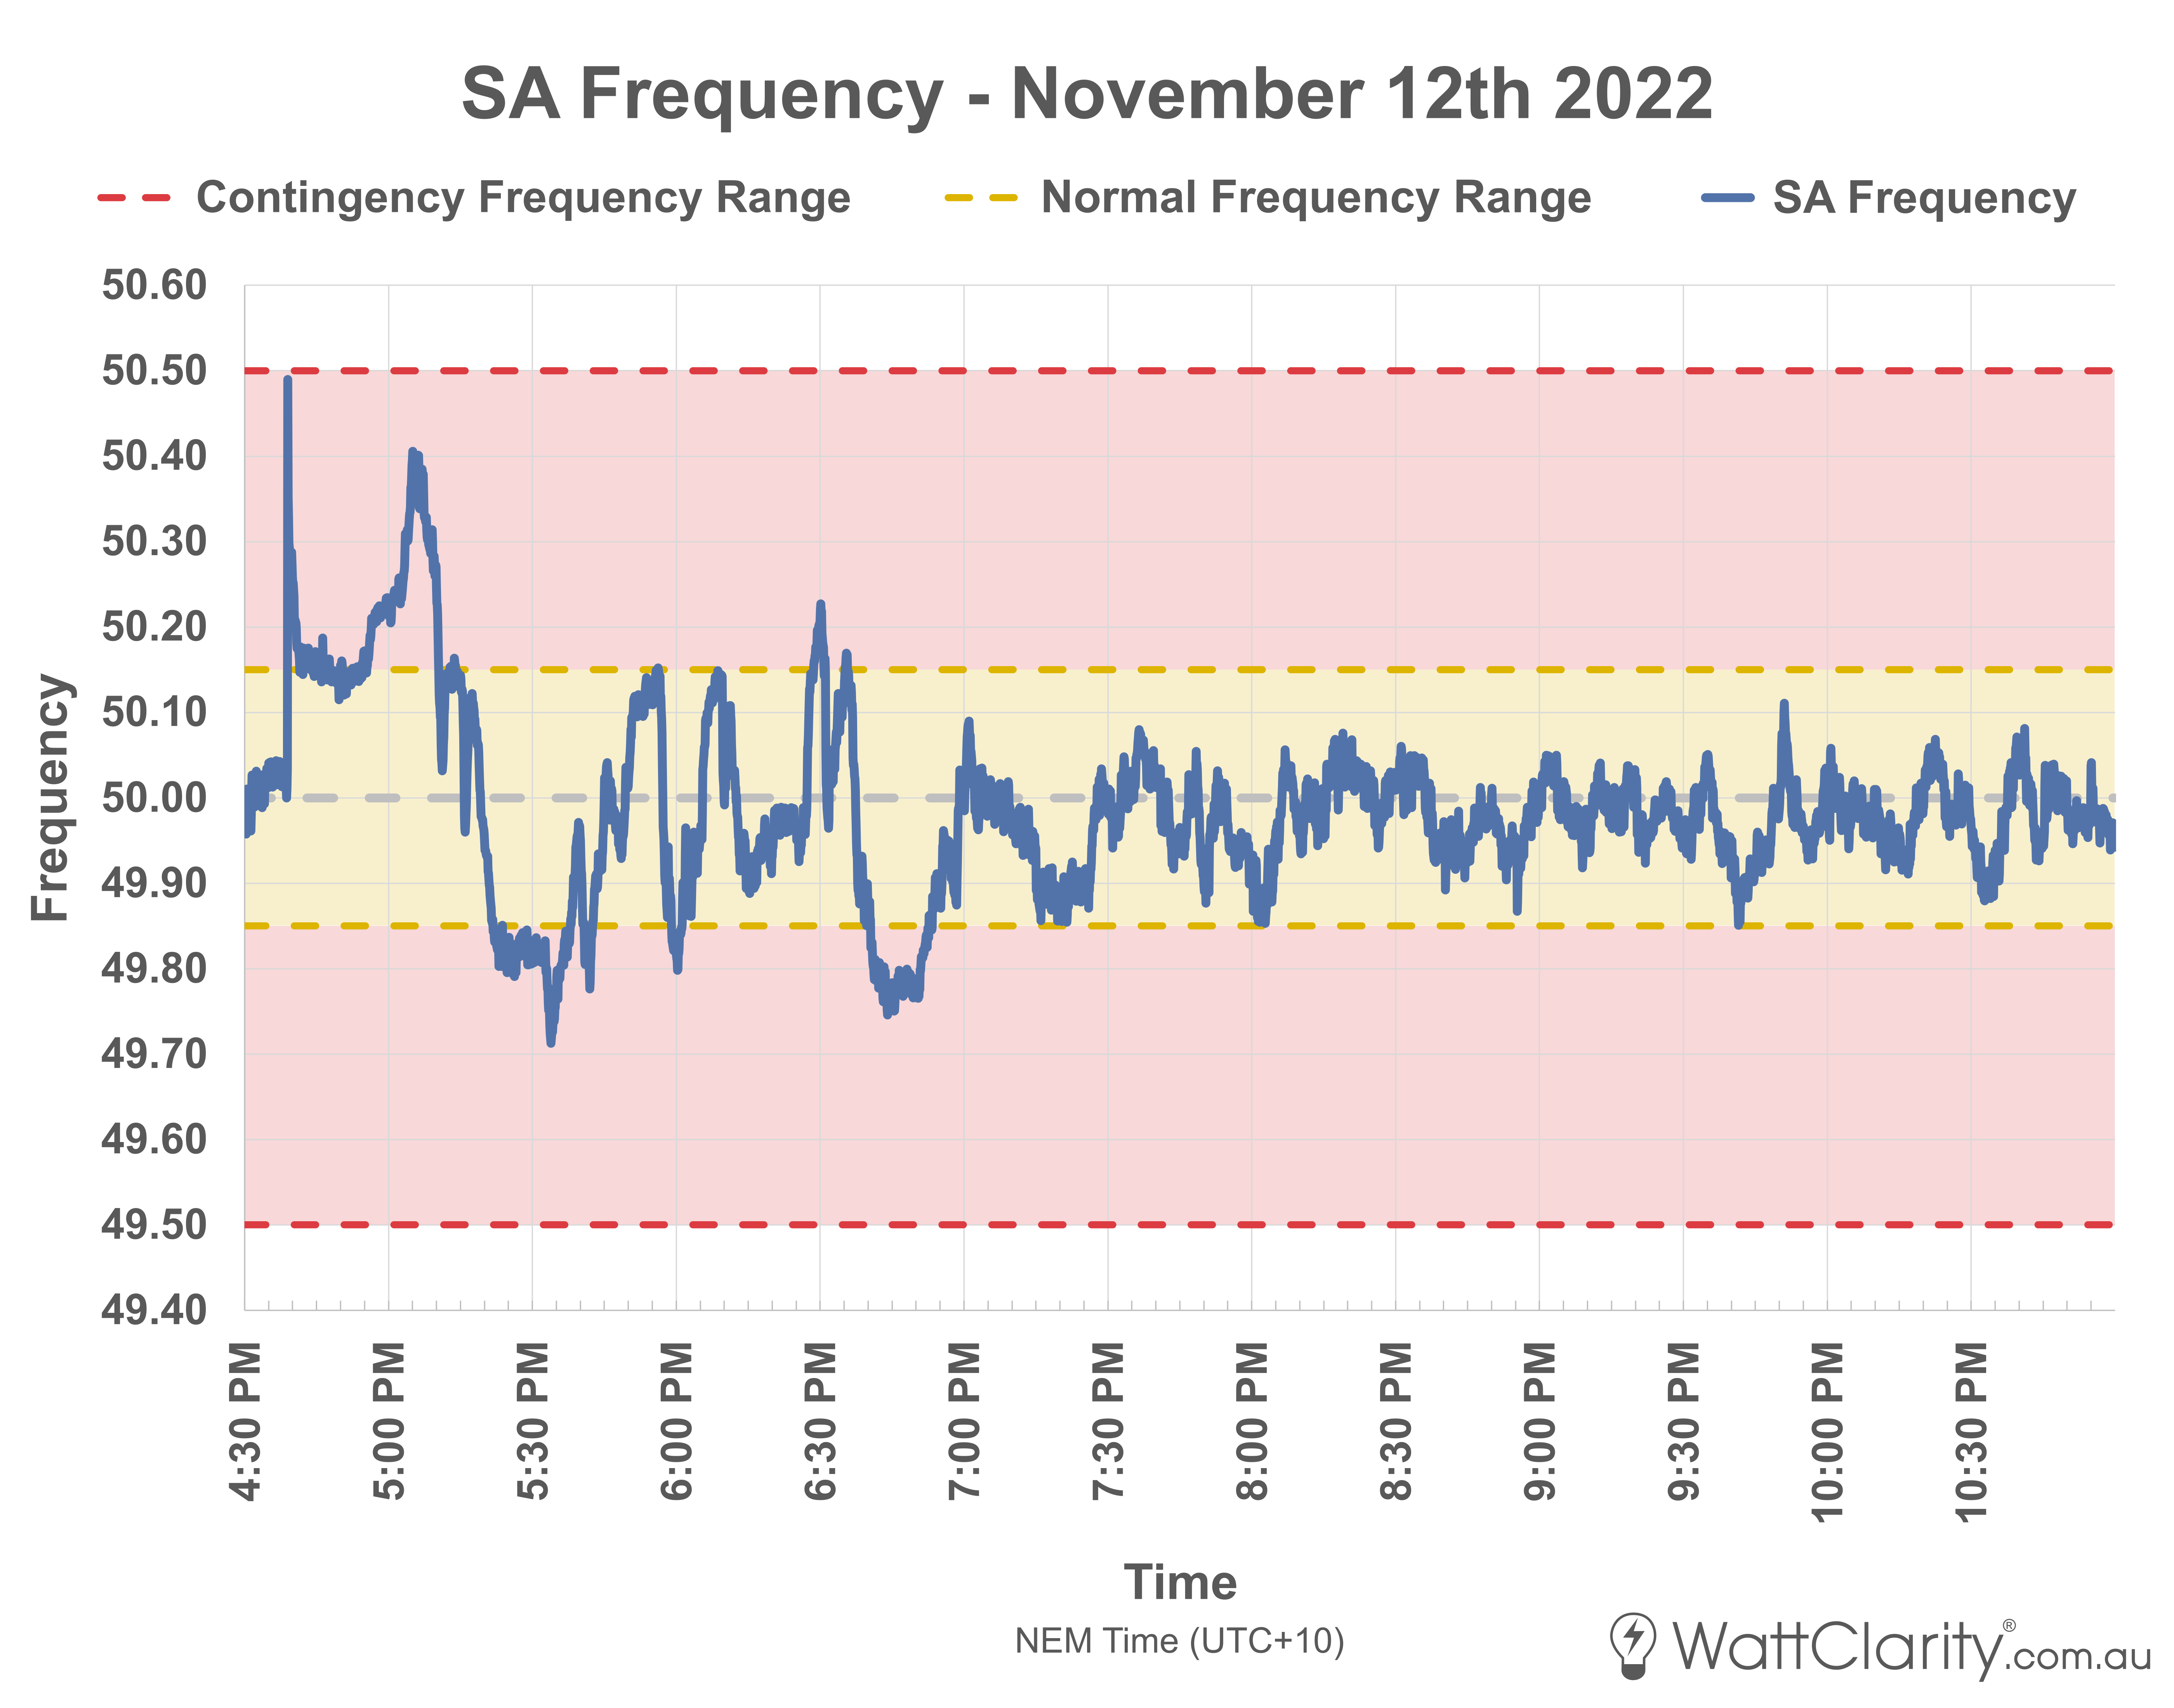
SA frequency was still wandering outside of normal bounds more than 2 hours after the Heywood trip.
Data Source: Solar Analytics
Frequency ranges shown are as defined by the AEMO.
We can see that SA frequency continued to swing after the separation. This included a dip outside of the normal bounds between 6:40PM and 6:52PM (NEM Time), approximately two hours after the initial trip.
Thanks Dan. Good analysis, but I’m not sure I’d agree with the headlines. These frequency traces seems remarkably good compared to previous separations. It would be worth comparing to reports on them in AEMO reports.
Separation circumstances are always different, but I suspect we are seeing the beneficial effect of fast acting inverter equipment.
Thanks Ben. I will post a follow-up when the AEMO publishes a report on the incident, and try to compare to previous separations for a full picture.