
“On Saturday afternoon, Adelaide and much of southern South Australia endured one of the strongest thunderstorms in recent memory,” reported Weatherzone.
The storms contributed to the trip of the Tailem Bend – South East 275kV #1 and #2 lines which led to the islanding of SA, and sent many electricity poles and lines down around the state leaving more than 80,000 without power. We reviewed the the sequence of events immediately around the trip on WattClarity.
In this article we explore the impacts on wind power generation as the storms passed through, in the leadup to the transmission line trip at 16:39 (NEM time, reflected in the market by the 16:45 interval).
Surely, one would think, with this extraordinary weather, the wind turbines would be turning extra hard.
Despite the impressive storm activity, however, wind power output was hit-and-miss, and in aggregate, wind output was maintained at a fairly stable level. From some viewpoints, Saturday started out largely as just another day on the grid for the typical SA wind farm, dealing with the usual network constraints, scheduled outages and wind variability.
Yet at the individual wind farm level, there were many things going on to drive output in various directions, including:
- Localised wind variability
- Predictability of dispatch availability
- Network conditions
- Bids
- Local conditions indicating high wind cut-out conditions
As such, we’ve aimed to present examples of the variety of features that drove wind farm output on the day, although readers should note this is not necessarily a complete picture of the day, rather just some observations that stood out to us in the time available to compile this article that might be of interest to readers.
Localised Wind Variability
For context, at around 15:30 NEM time a squall line of storms rolled across Adelaide and brought damaging wind gusts.
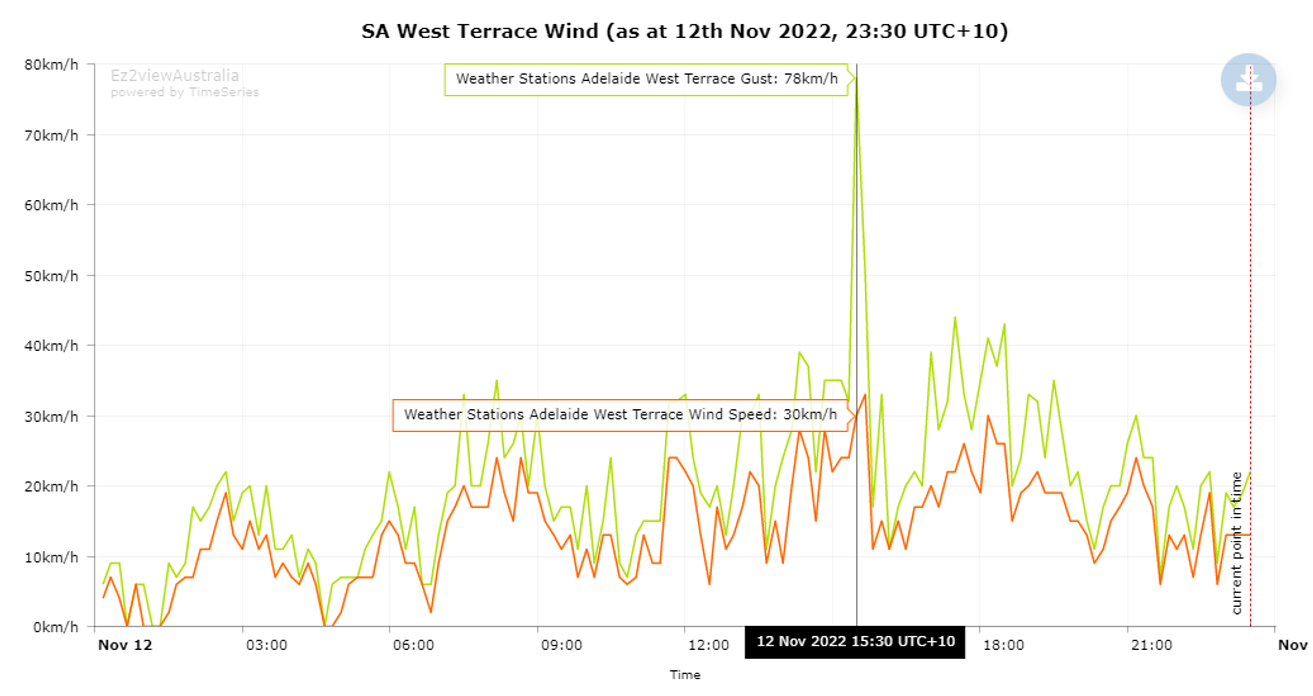
At this time wind gusts in Adelaide were nearly triple the average: wind gusts at Adelaide West Terrace were recorded at 78 km/hr. Yet either side of the gust we note underlying wind speeds were not noticeably higher on average than recent days.
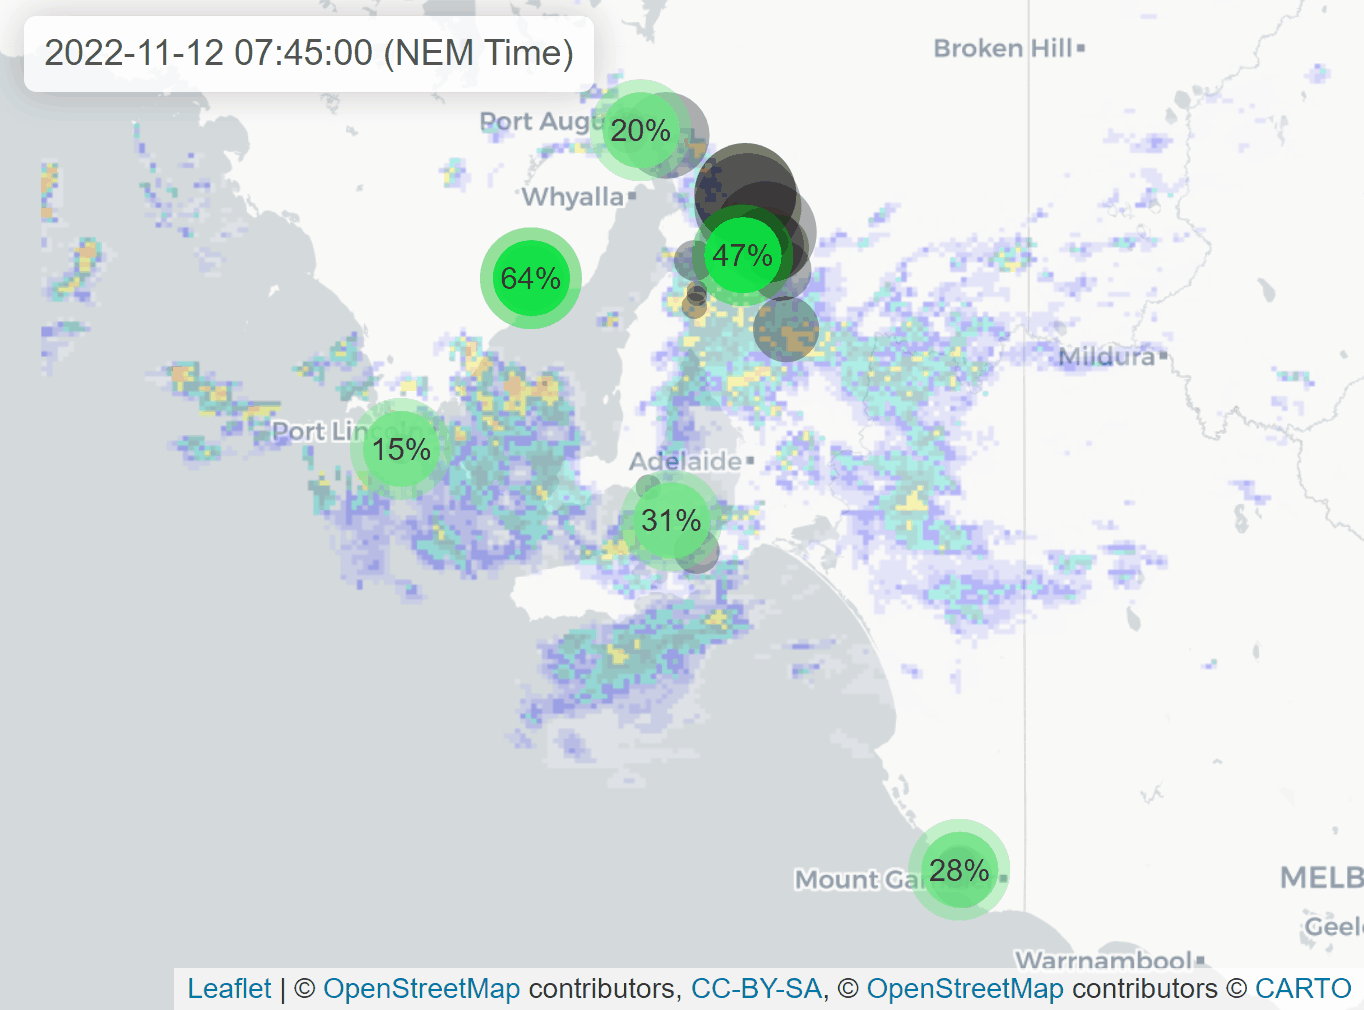
To get a sense of overall wind farm performance, we’ve animated the progression of the storms between 07:45 and 18:30 (NEM time which is 30-minutes behind local time). We used radar rainfall intensity as a surrogate for storm intensity and plotted the power output of wind farms in SA.
- There’s a grey circle for each wind farm and its size represents the power output of each.
- The green circle is labelled with percentage output as a proportion of aggregate maximum capacity. We added this to summarise overlapping wind farms, by grouping them into six clusters.
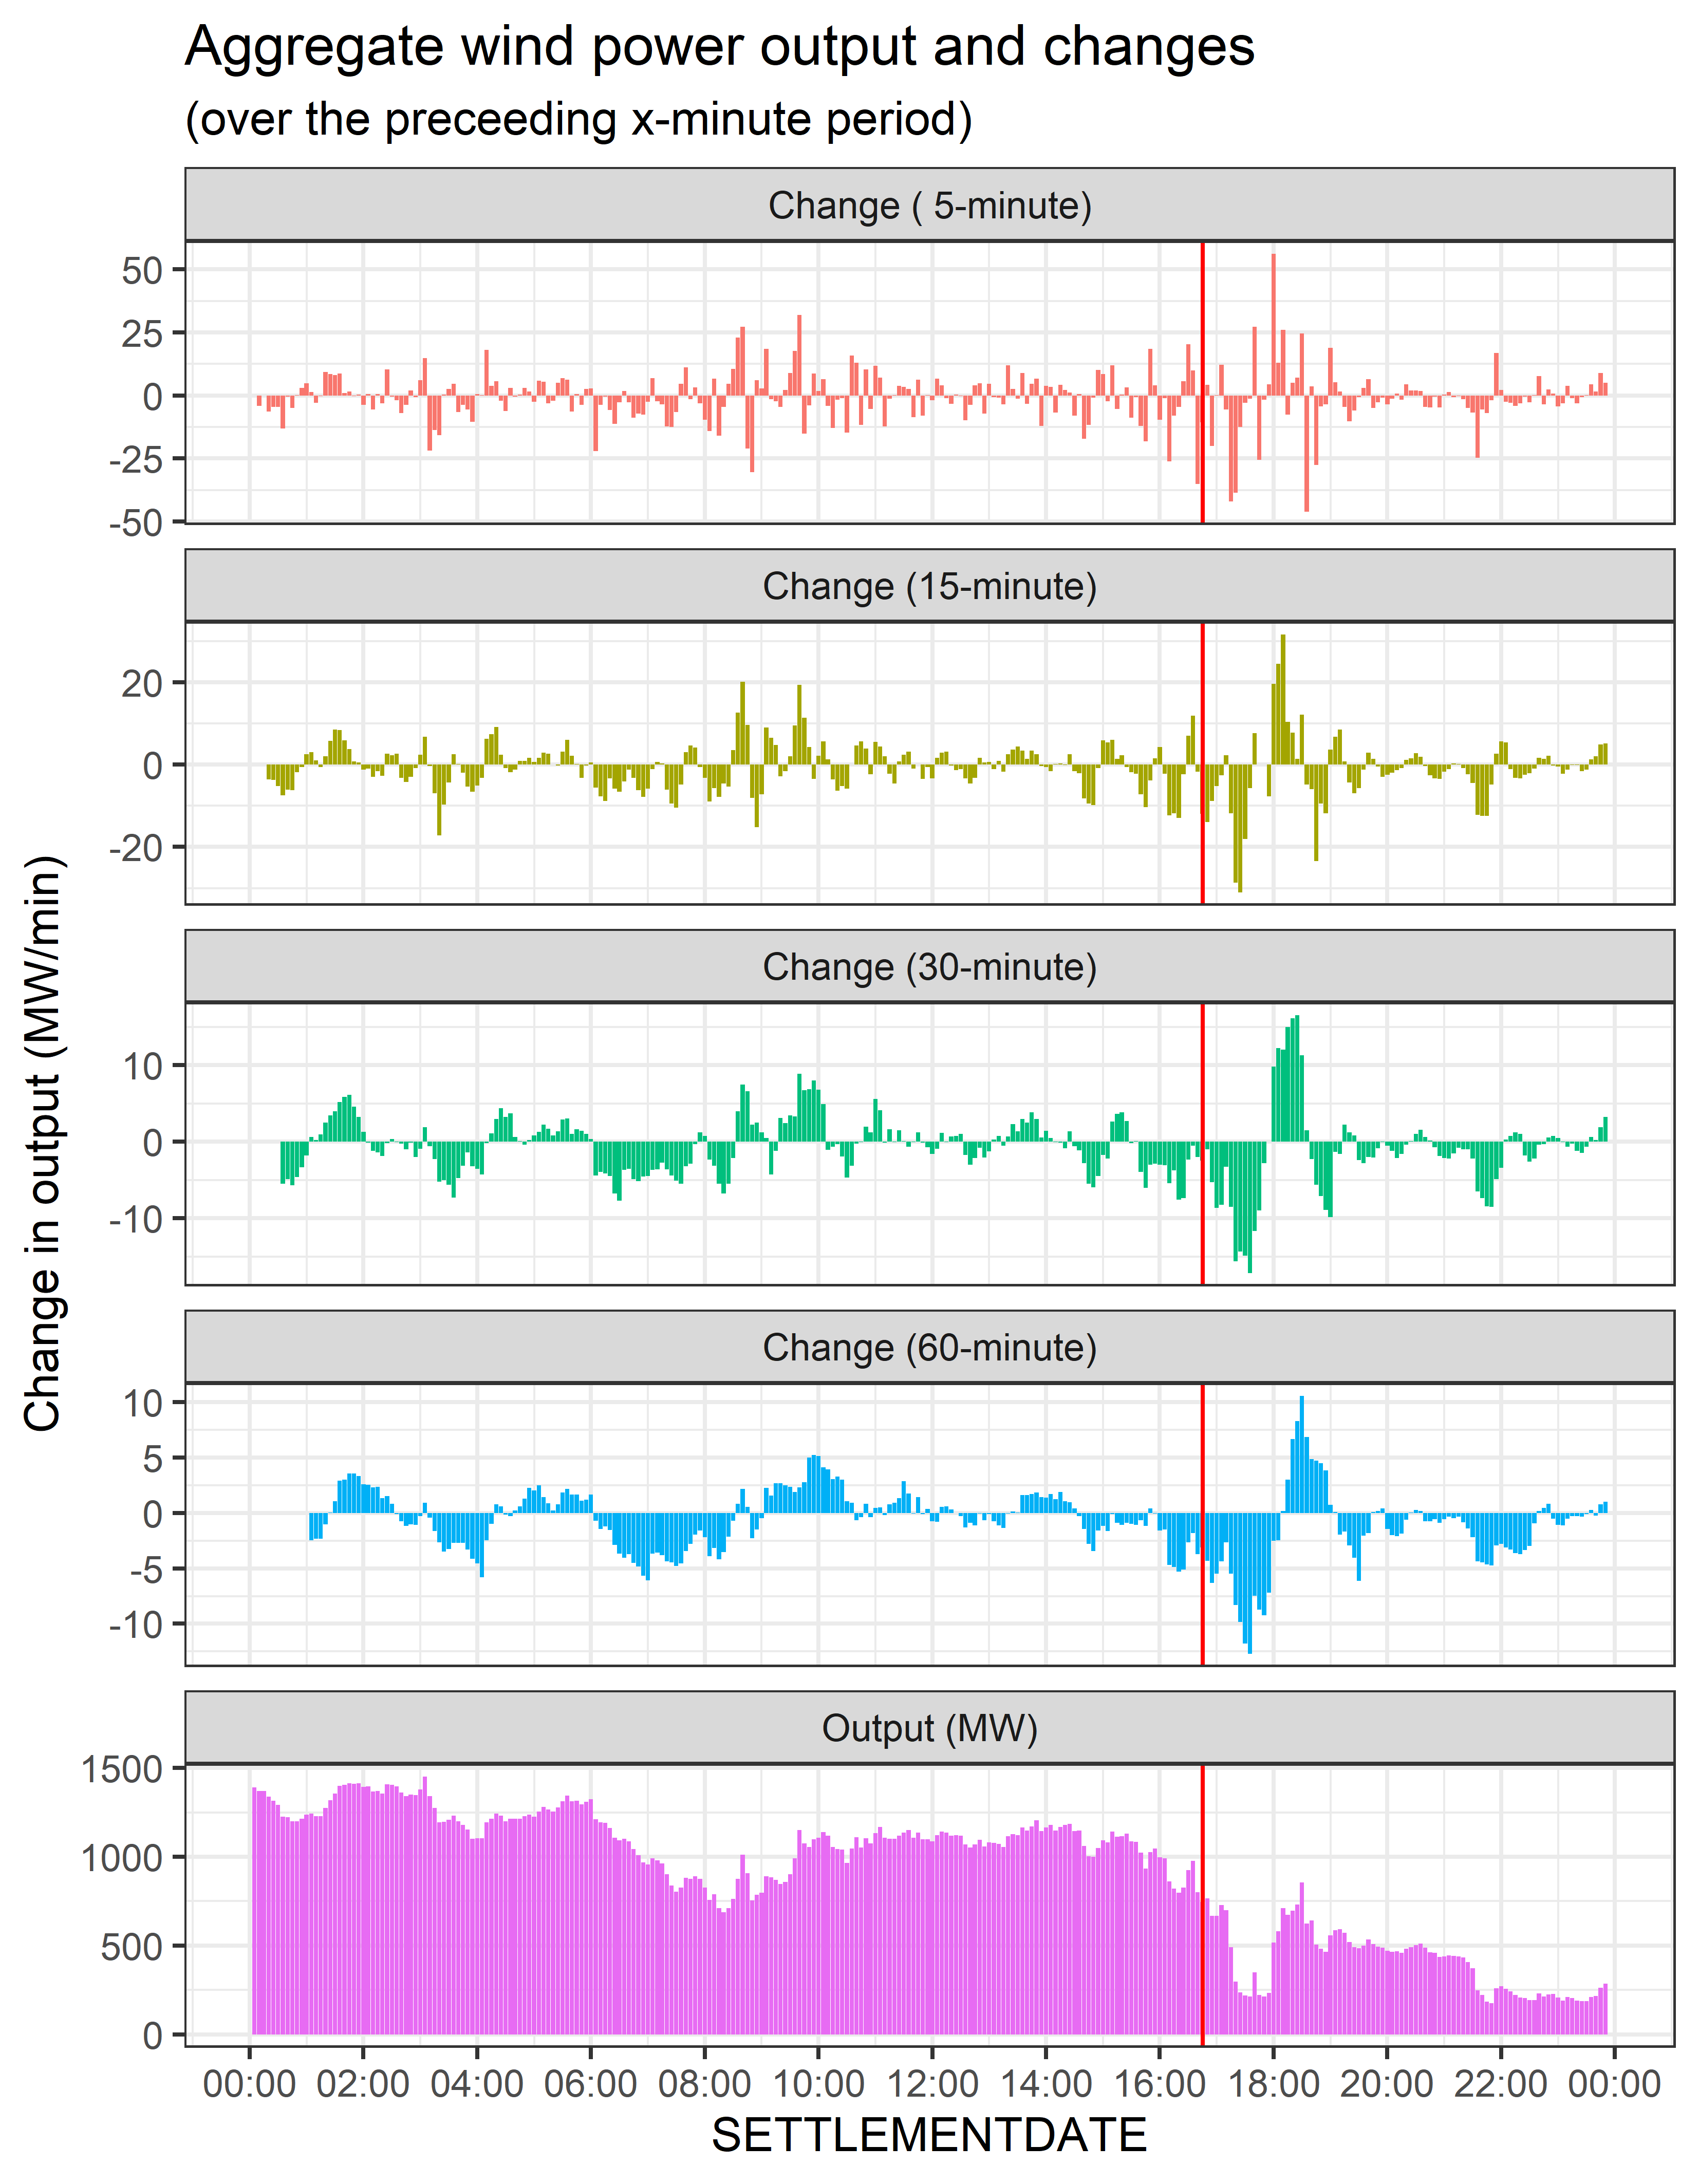
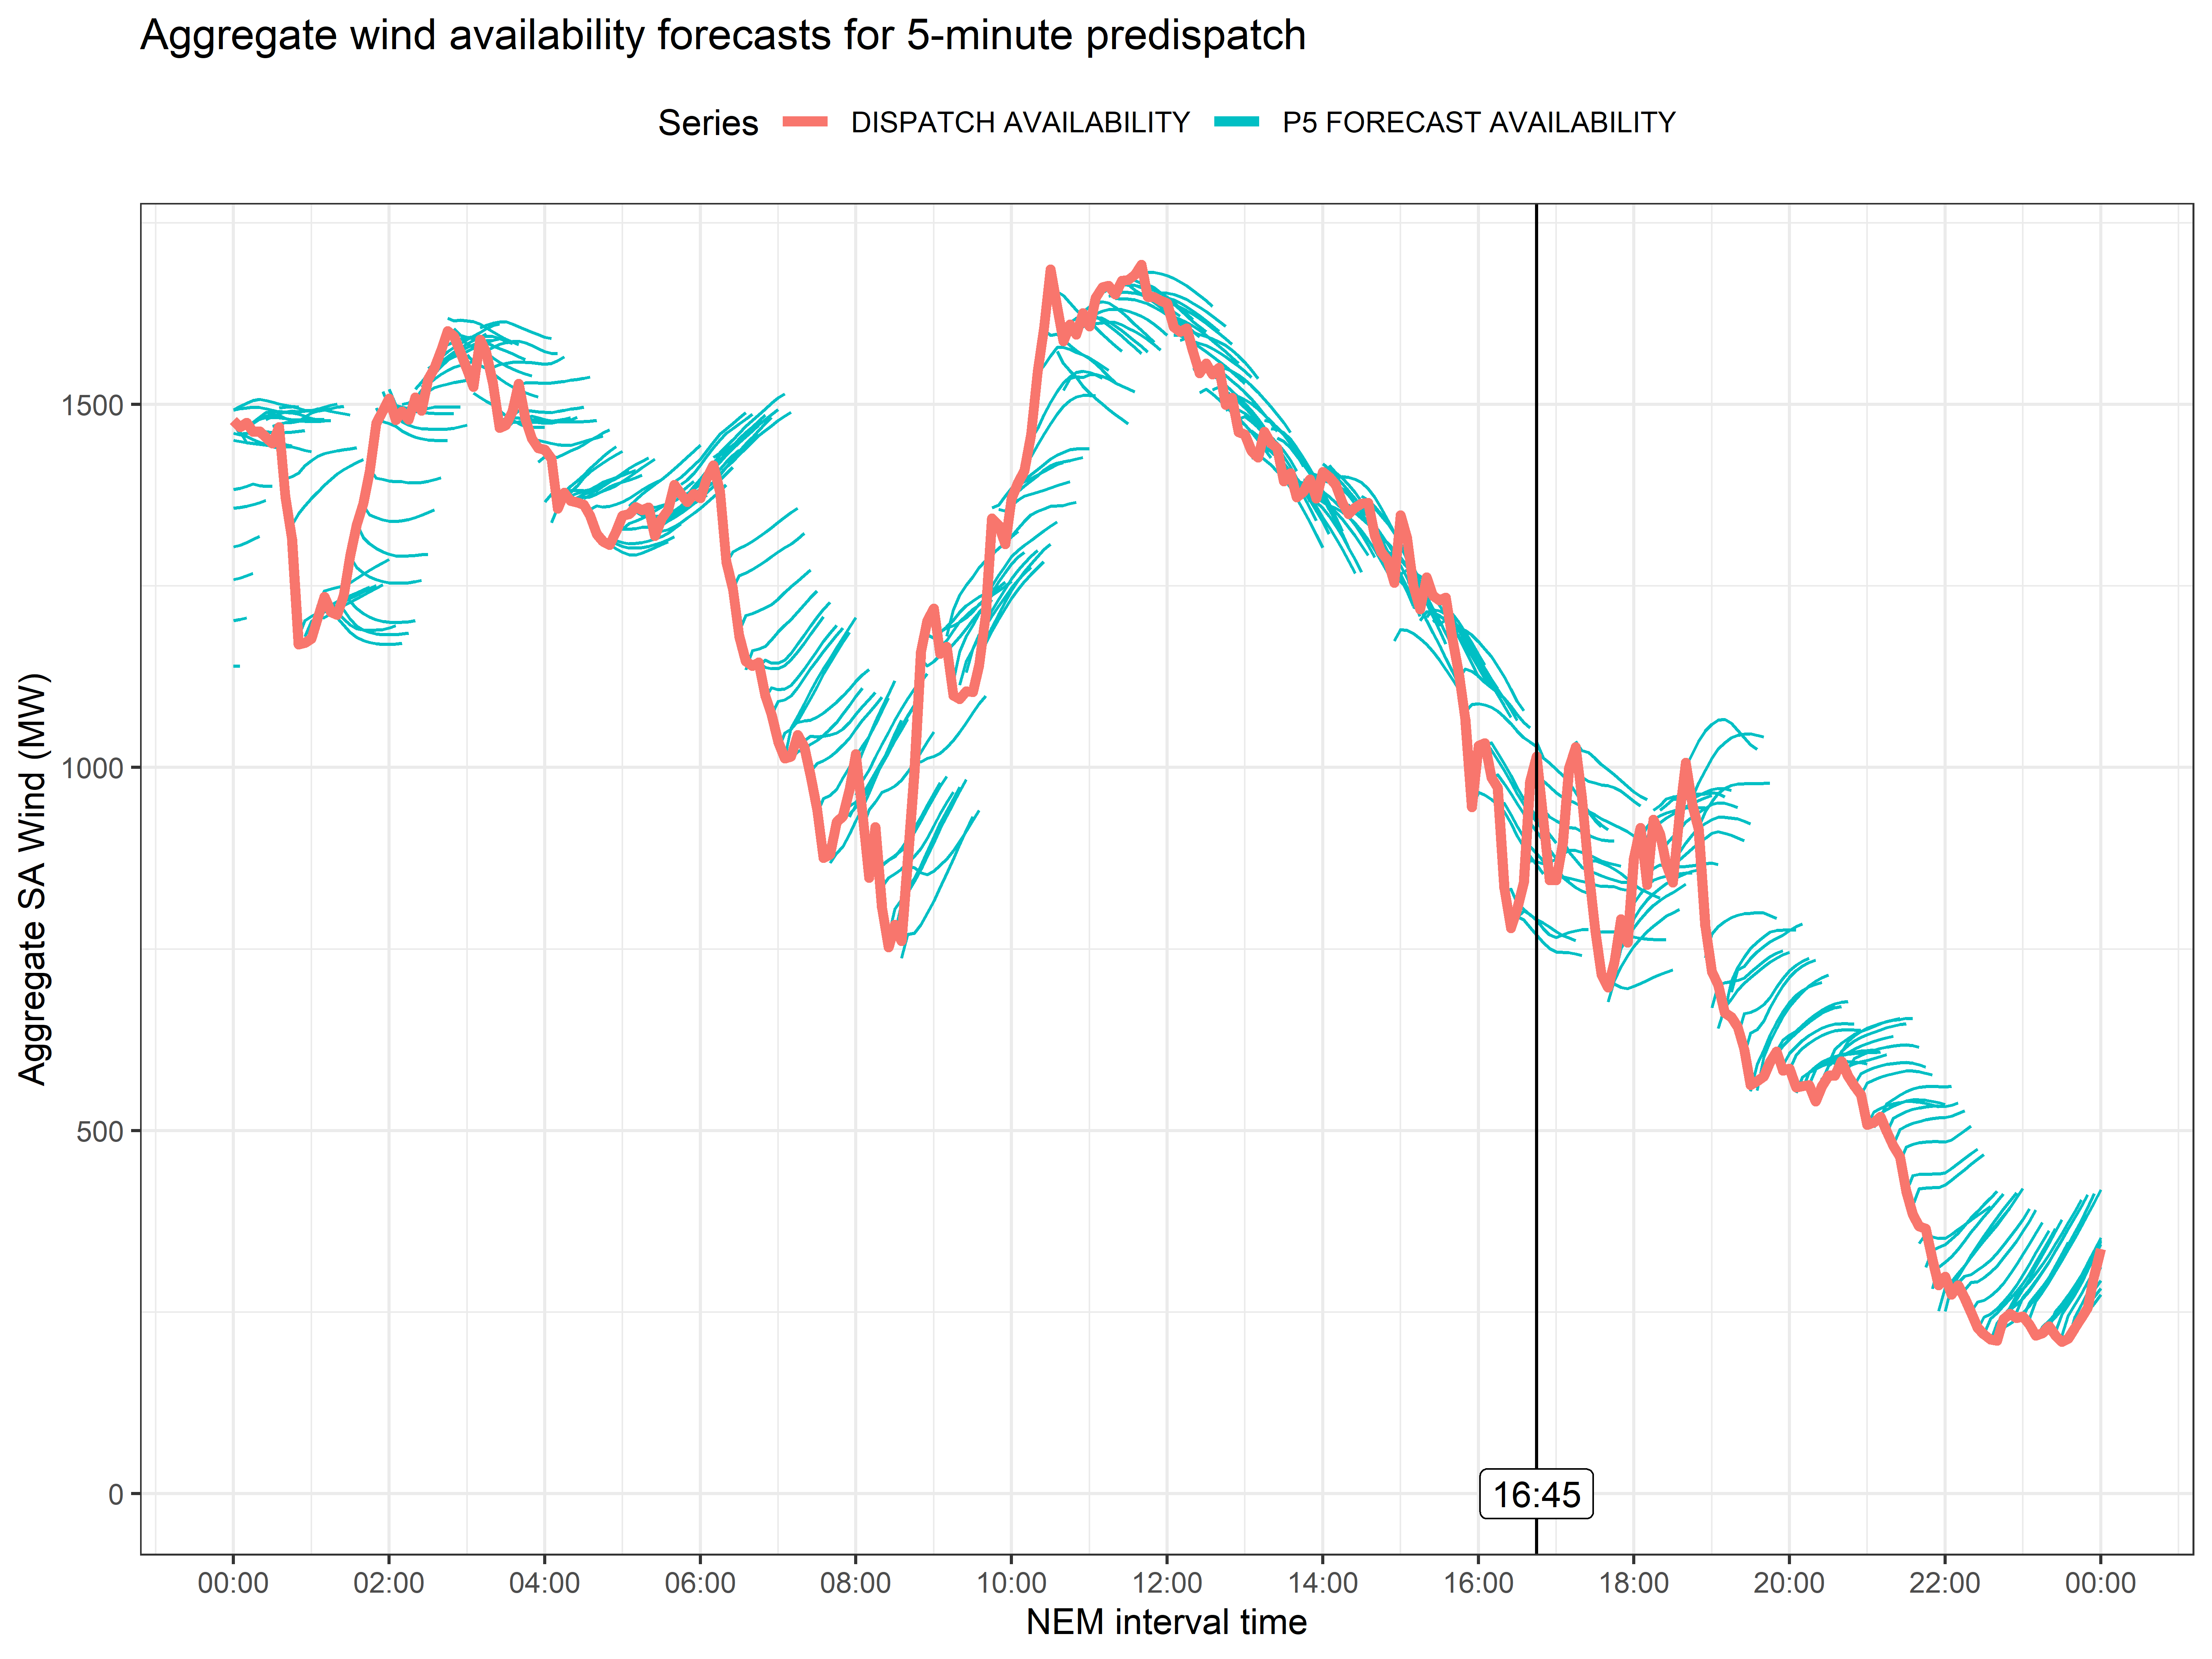
Wind output in aggregate was around 1400 MW at 00:00 Saturday morning, and had gradually reduced to 750 MW by around 08:30. It rallied back to 1200 MW by about 15:00 before reducing again into the islanding event just before the 16:45 dispatch interval (marked by the vertical red line) in the chart below.
Ramp rates, calculated as changes in output over a defined period are charted below. We can see that the strongest ramps occurred after the islanding. Before the islanding aggregate wind output was not particularly variable.
To dive into some more detail, let’s first remember that wind power output is not simply a 1:1 match with the wind speed. It depends on:
- The wind which dictates unconstrained generation potential,
- Market and network conditions which can limit output,
- Bidding, and whether a generator bid low enough to be dispatched, and
- Site conditions and local limits which might include high wind cutouts.
Predictability of dispatch availability
Looking at the 30-minute predispatch forecasts, below, fluctuations in dispatch availability appeared difficult to capture by the forecasts. Especially earlier in the day. The misalignment appears greatest when the blue forecast trajectories don’t line up with the actual dispatch availability in red.
The chart (which is a reworked version of our ‘Forecast Convergence’ widget in ez2view) indicates a drop in wind generator availability from 06:00 was not well captured in predispatch. A price spike at 08:20 (at just over $1000/MWh) may have been supported by the low and availability. Similarly, the rise in dispatch availability was not captured in intensity or magnitude between 08:30 and 12:00.
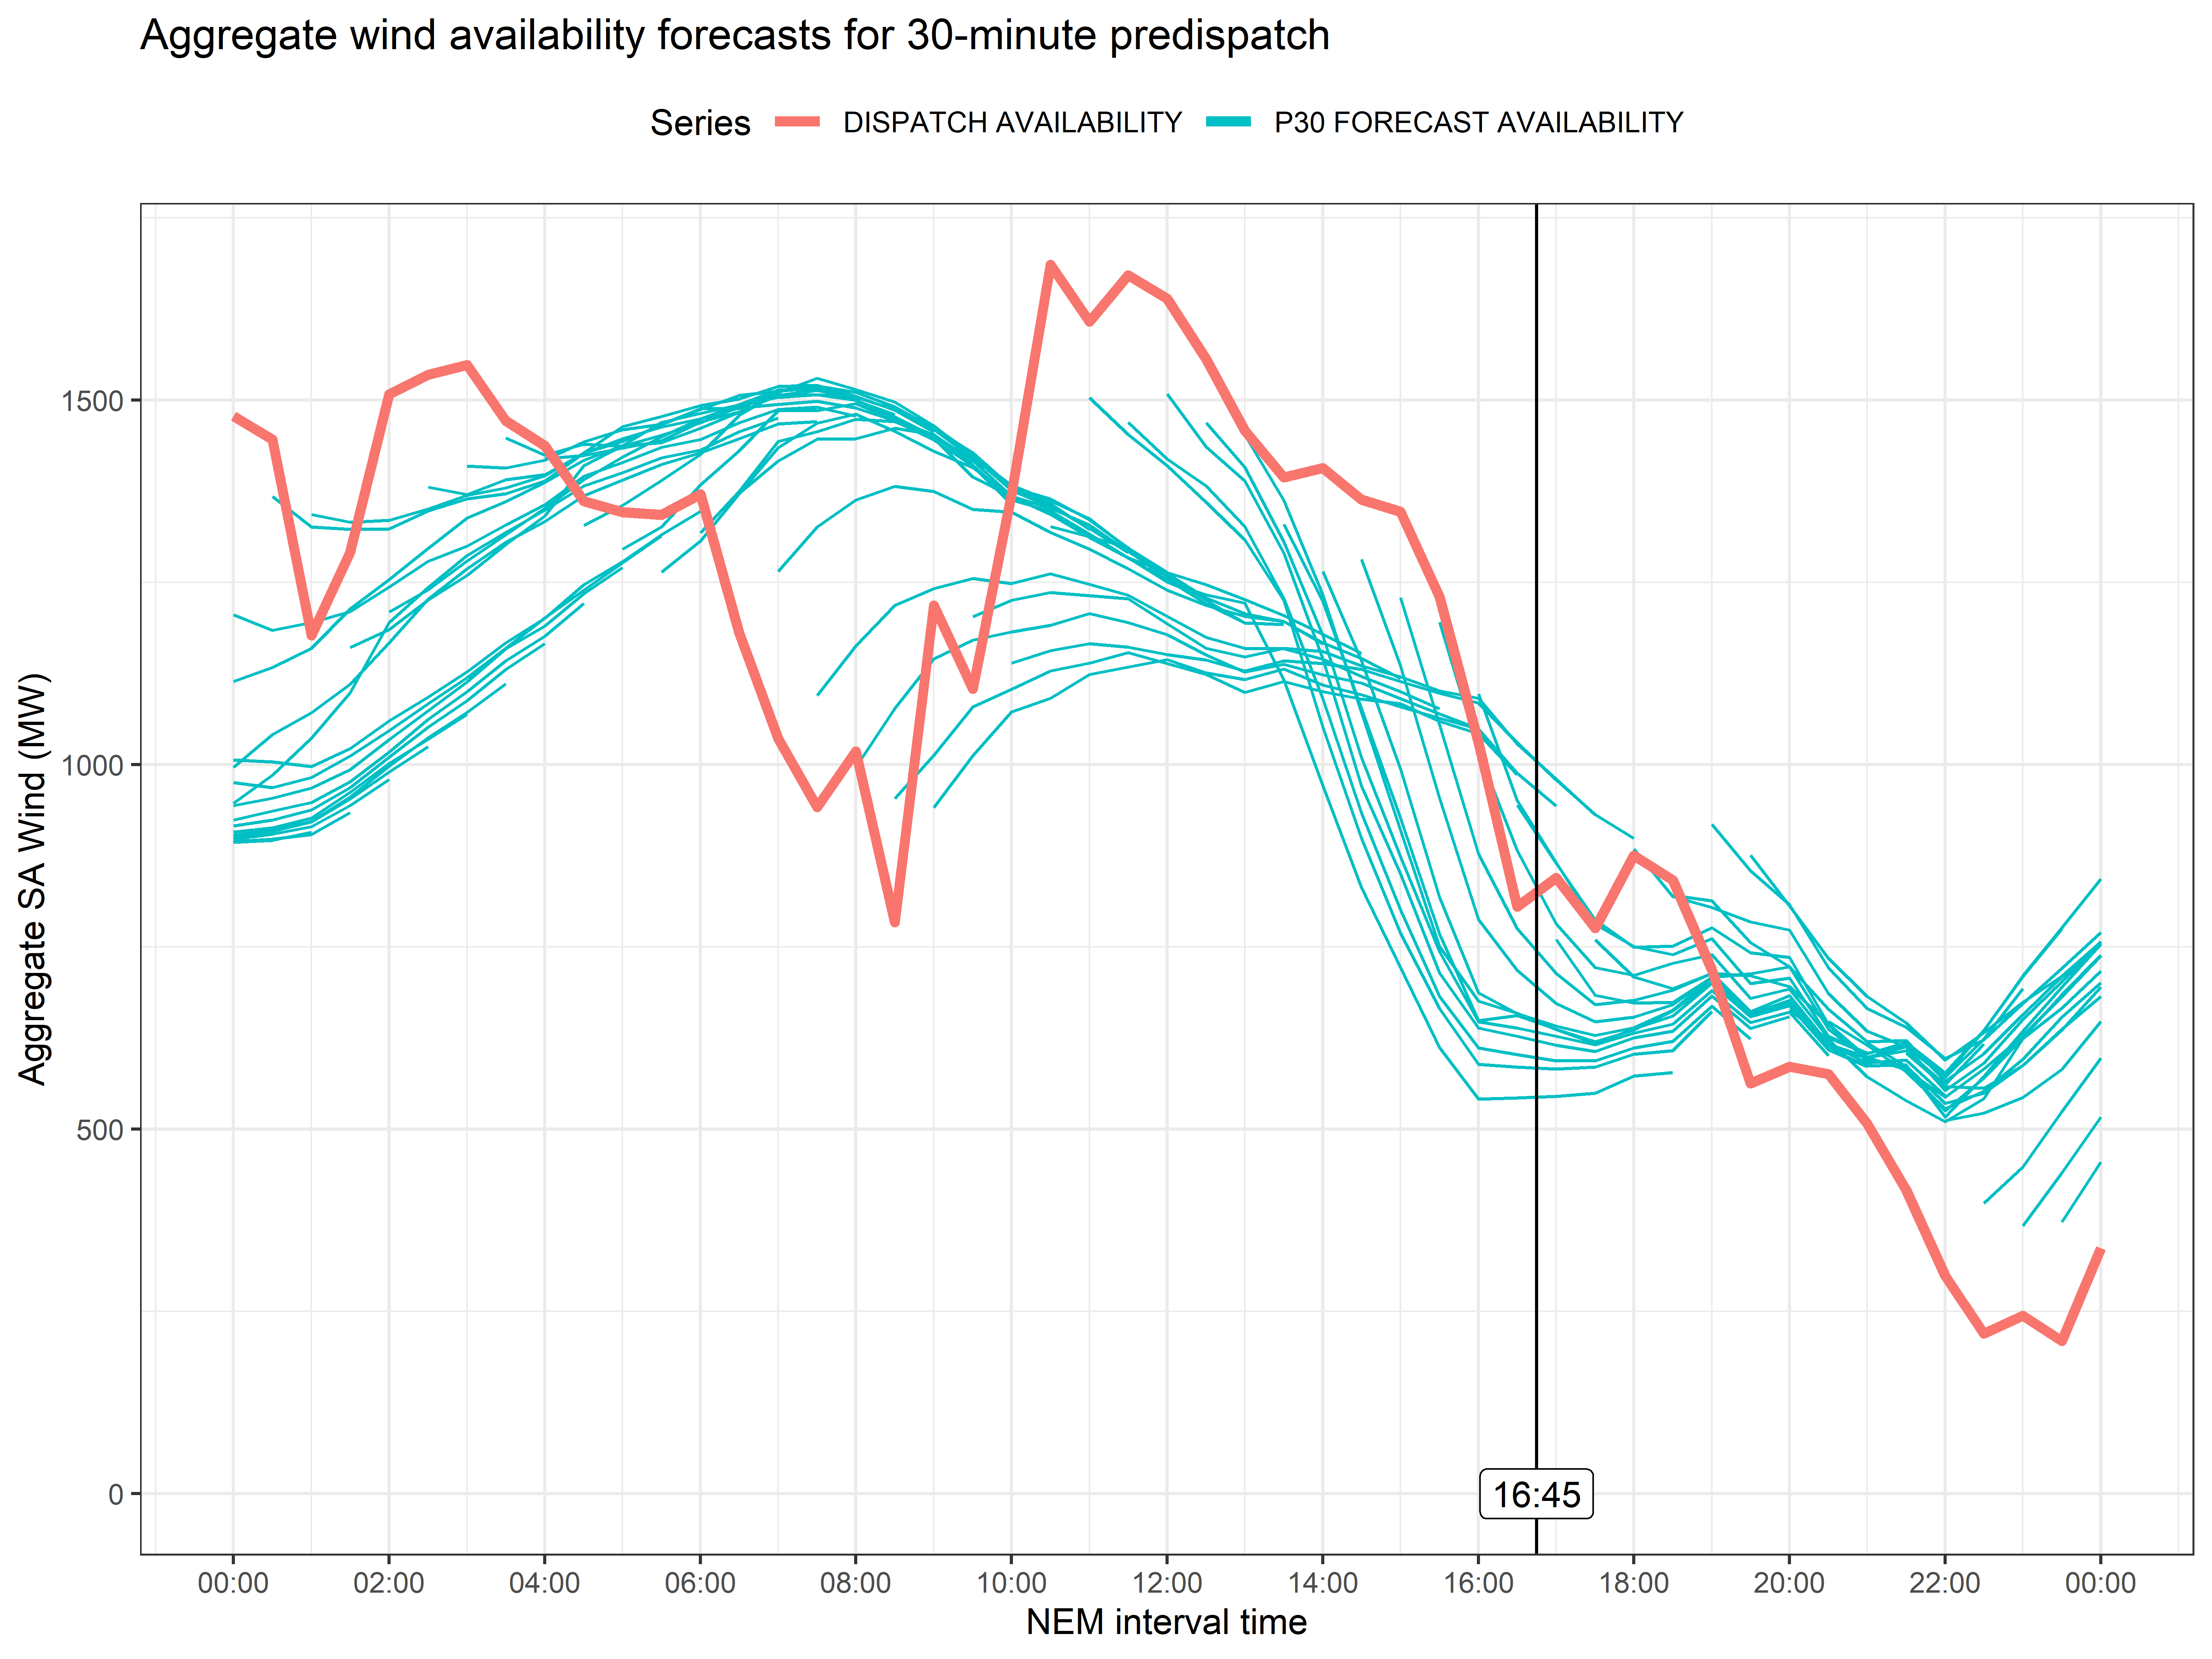
A similar story goes for the misalignment in the 5-minute predispatch wind availability forecasts. A successful run of forecasts is evident between 12:00 and 15:00 where steadily decreasing availability was forecast and did eventuate.
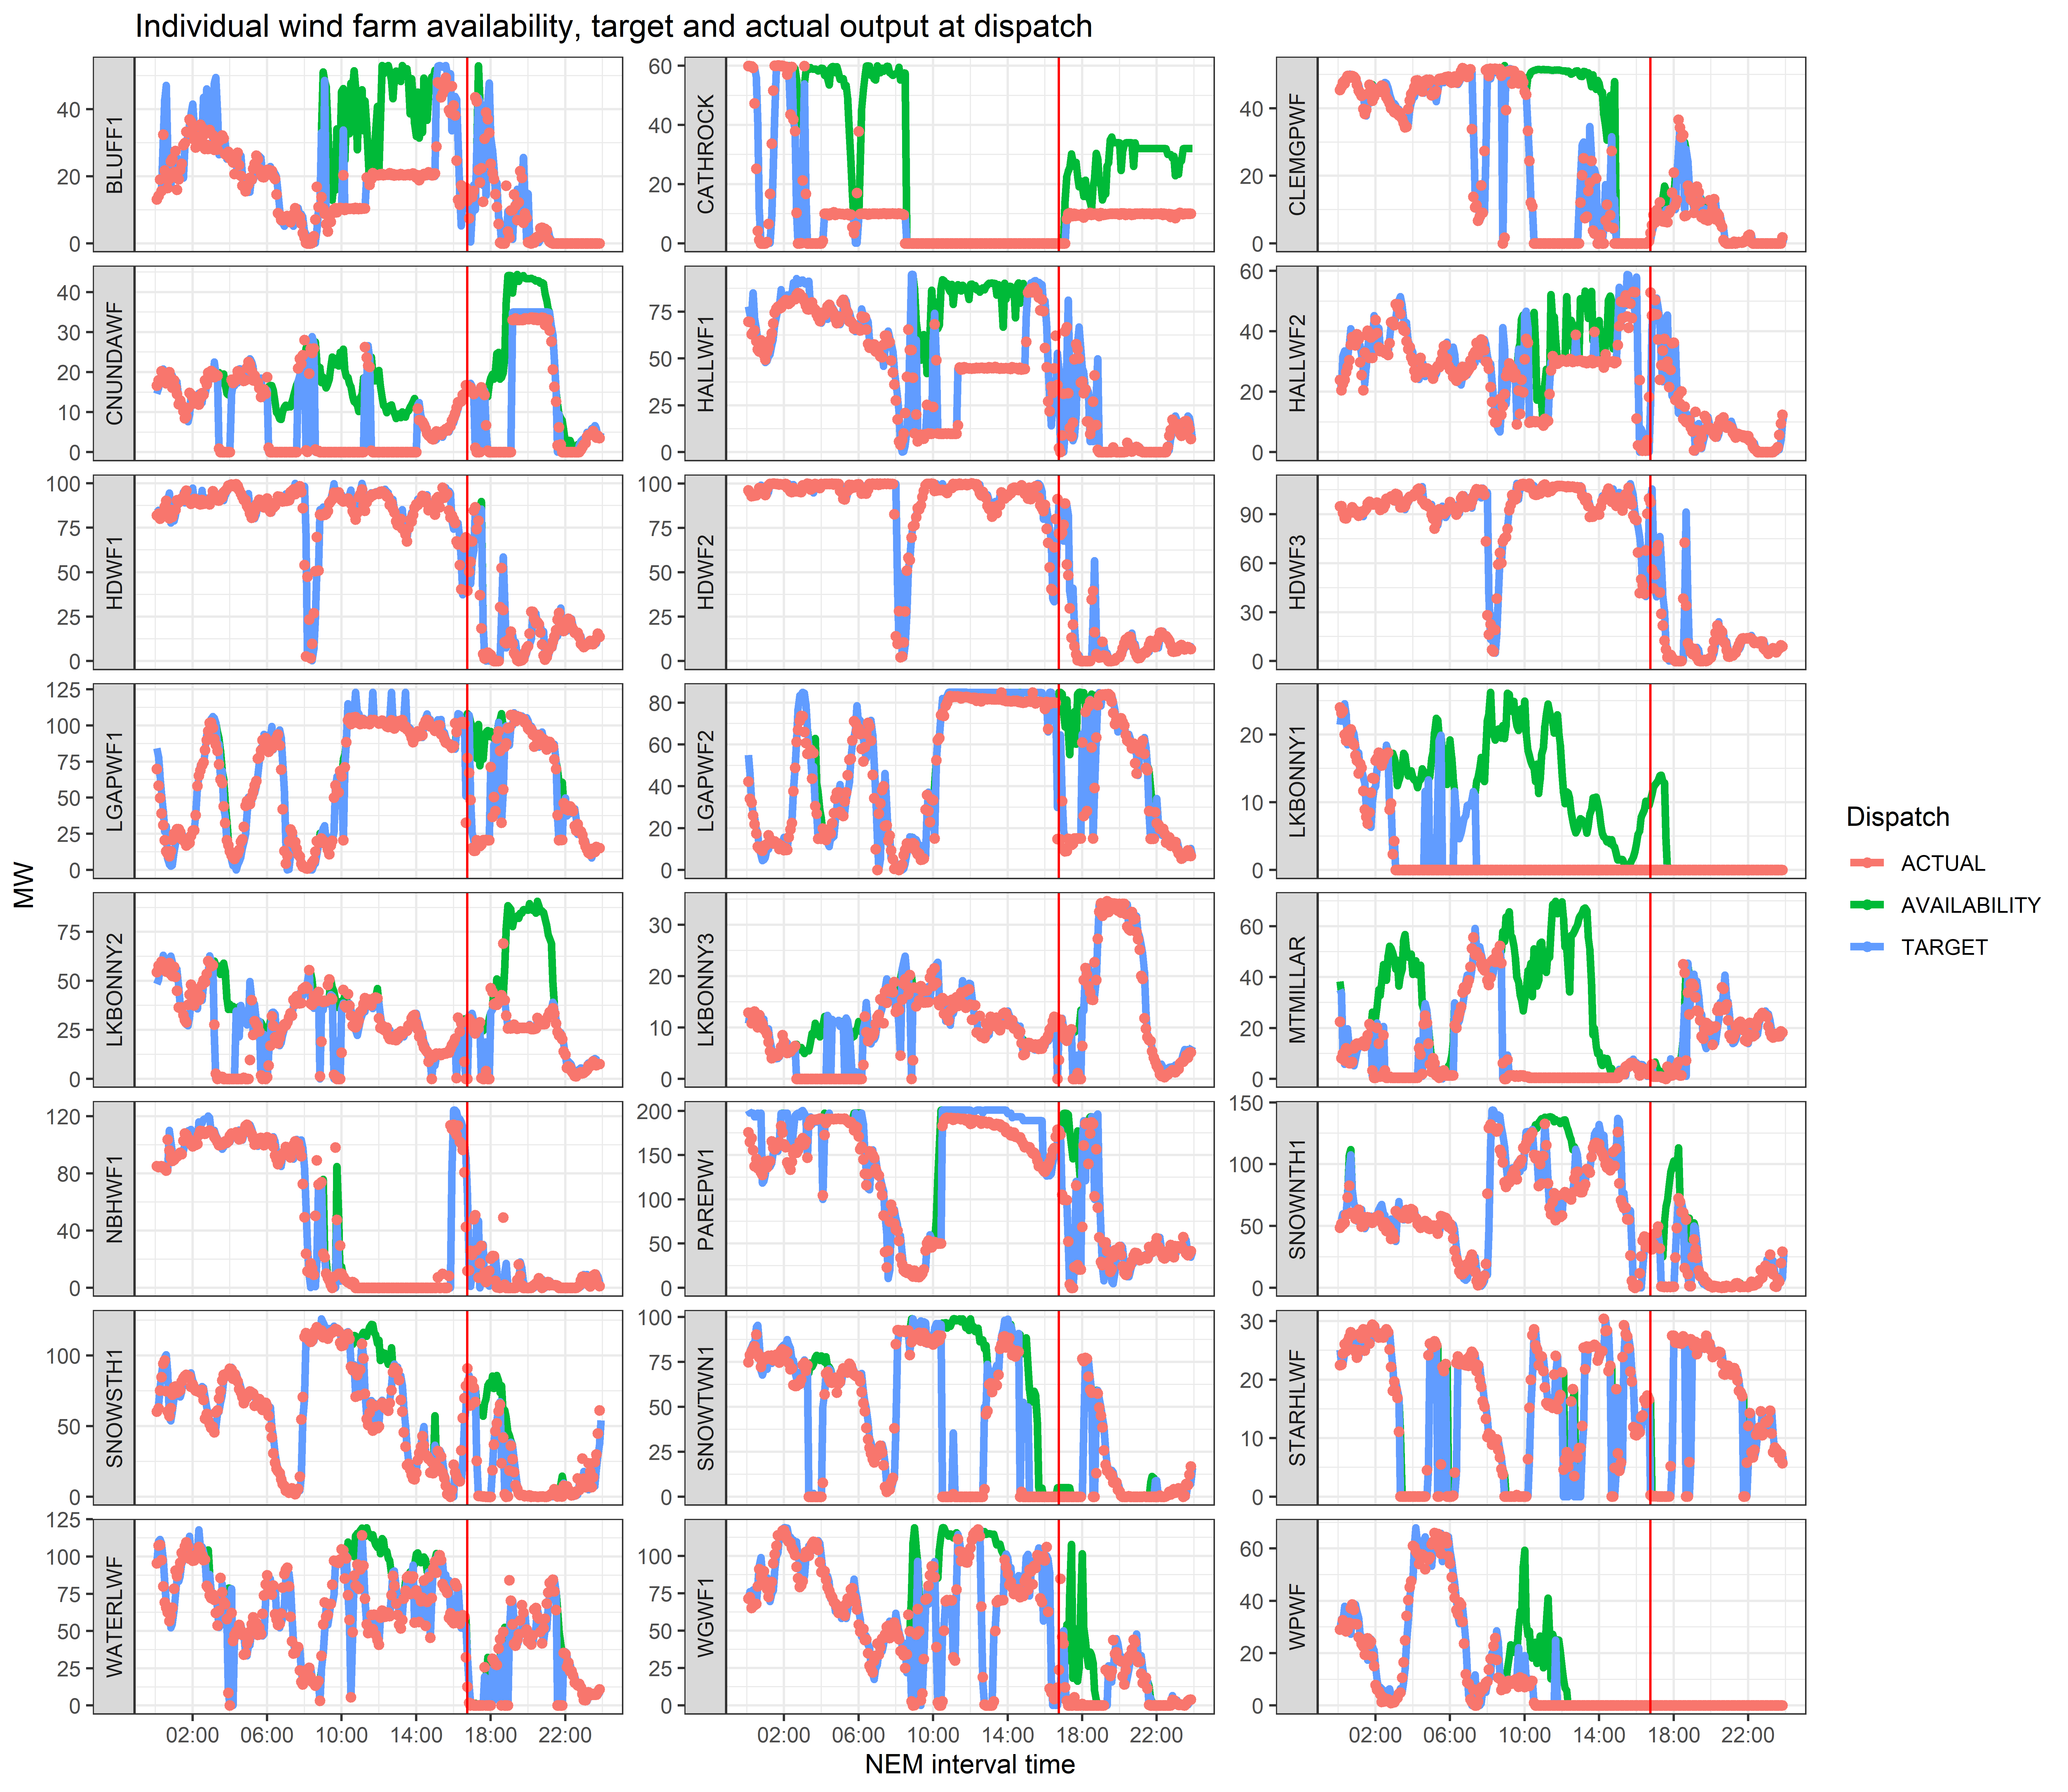
Availability, Targets and Actual Output
We’ve used the following chart to delve some interesting aspects that we found to stand out at individual units.
Network conditions
Cathedral Rock was constrained to 10 MW, 0 MW and then 10 MW again for planned outages.
Lake Bonney farms were constrained down to 60 MW in aggregate due to a prior outage on the Heywood to South East 275kV line, as part of the I-HYSE constraint set.
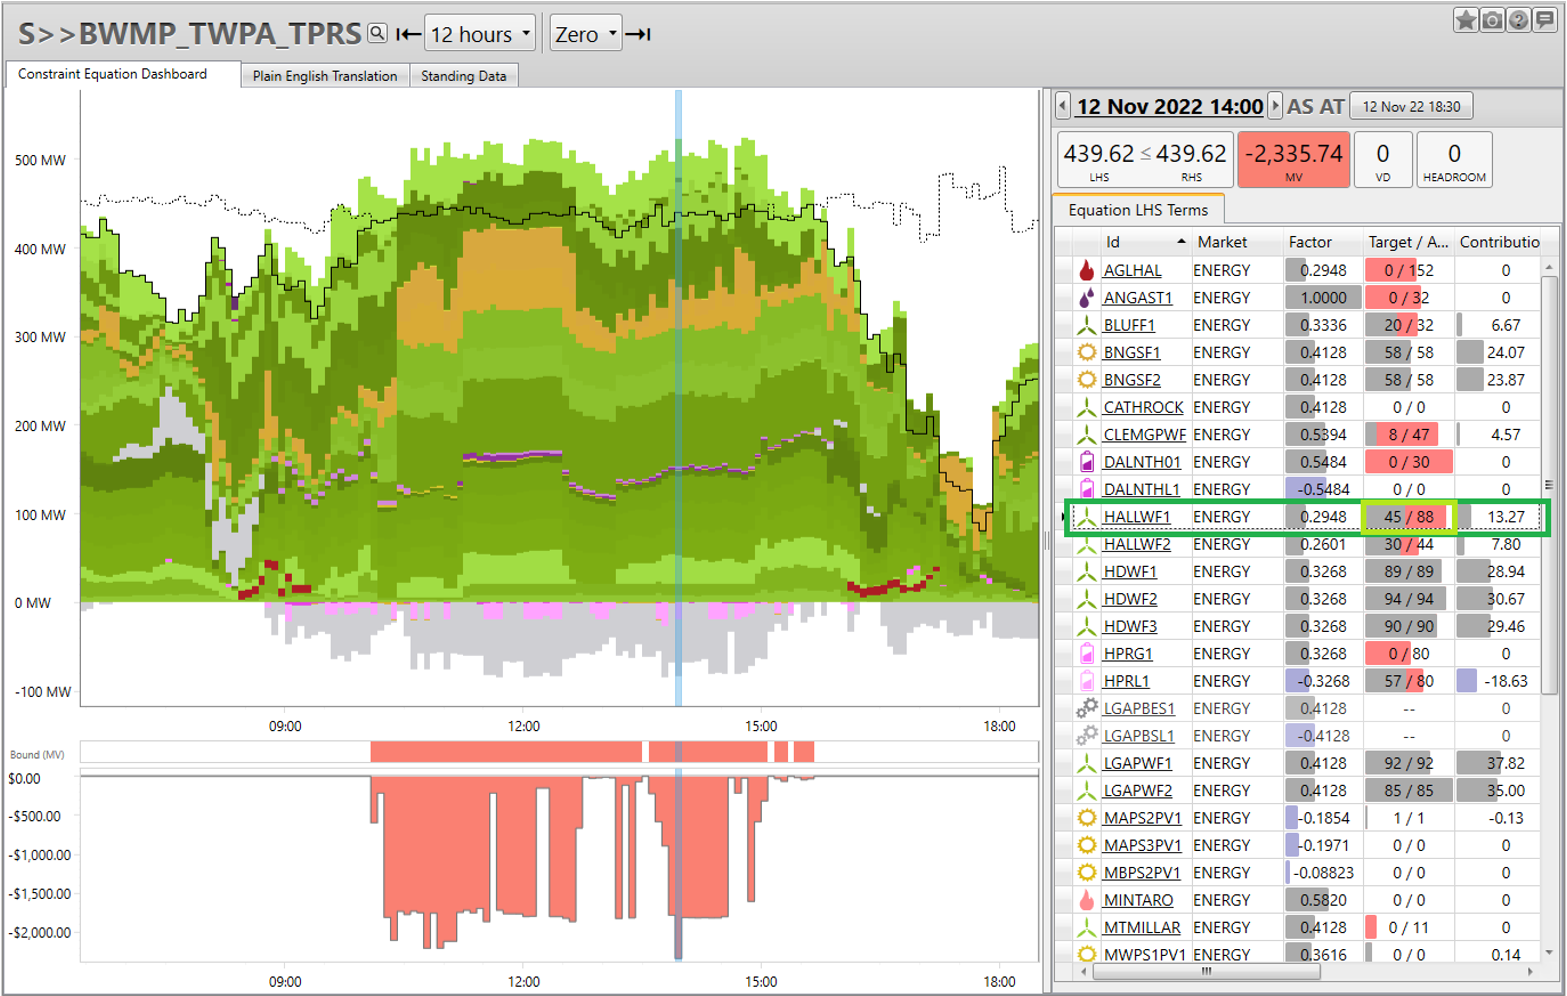
The constraint set relating to an outage for the Blyth West- Munno Para 275kV line and Munno Para-Para 275kV line was invoked and led to constraints in the set binding and curtailing windfarm output throughout the day.
One constraint included in this set is S>>BWMP_TWPA_TPRS designed to avoid an overload of the Templers-Roseworthy 132kV line on a trip of Templers West-Para 275kV line.
This constraint when viewed in ez2view’s ‘Constraint Dashboard’ widget shows it binding from the 10:10 dispatch interval (the lower chart with the red columns). At the selected interval (14:00) HALLWF1 was constrained to a target of 45 MW from an availability of 88 MW.
Bidding
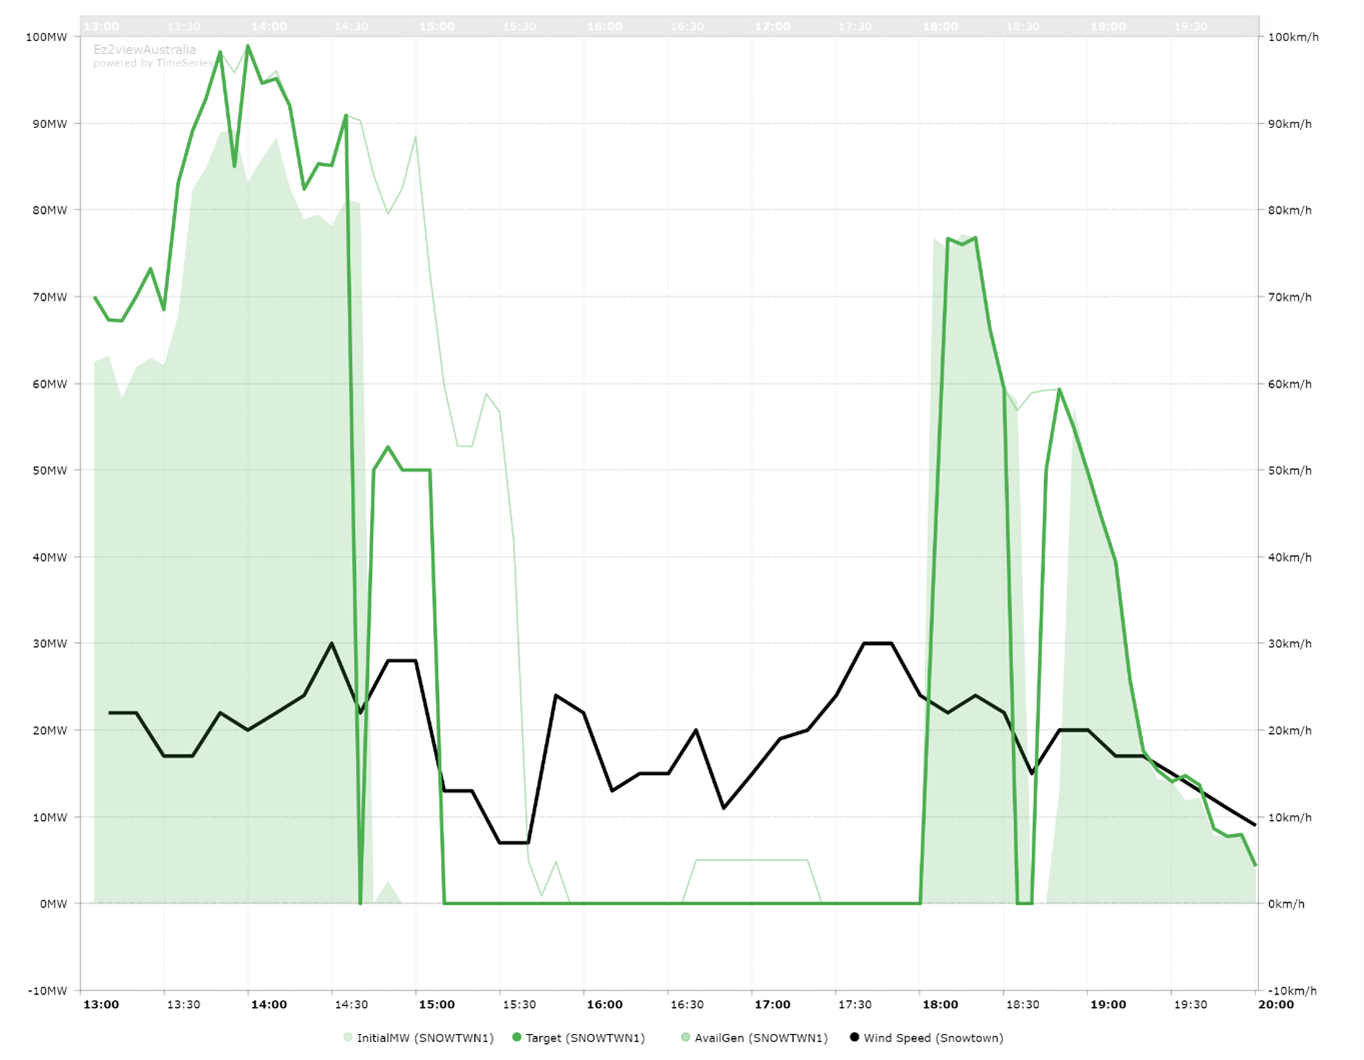
Snowtown 1 unexpectedly tripped at approximately 14:45 NEM time, with a subsequent rebid indicating “Plant Failure”. The wind farm was back online again by 1800 NEM time. This chart shows the relevant period.
Mt Millar had good availability but was not dispatched for much of the day due to transmission outage constraints (e.g. S>>BWMP_TWPA_TPRS) and the level of their bid.
Local limits
During the dispatch timeframe wind farms can inform AEMO of limits to their availability using the SCADA Local Limit signal. This is one option for sites dealing with or managing high wind speed turbine cut-out conditions or deratings related to high wind speeds. Another option is to signal the number of turbines available to operate, but not operating due to specific wind conditions.
Unfortunately, these signals are only sent between the site and AEMO and aren’t published in the MMS. So, identifying high-wind speed cut-out is not an exact science. We’ve manually looked for indicators related to dispatch availability:
- A sudden drop in availability, as the main indicator,
- Combined with the absence of constraints setting inverter limits to 0,
- Generally high output in the preceding dispatch intervals, and
- Resulting dispatch availability at or close to zero.
We tend not to consider actual output as this can be restricted by other drivers such how the unit bid (and the dispatch target received) and constraints.
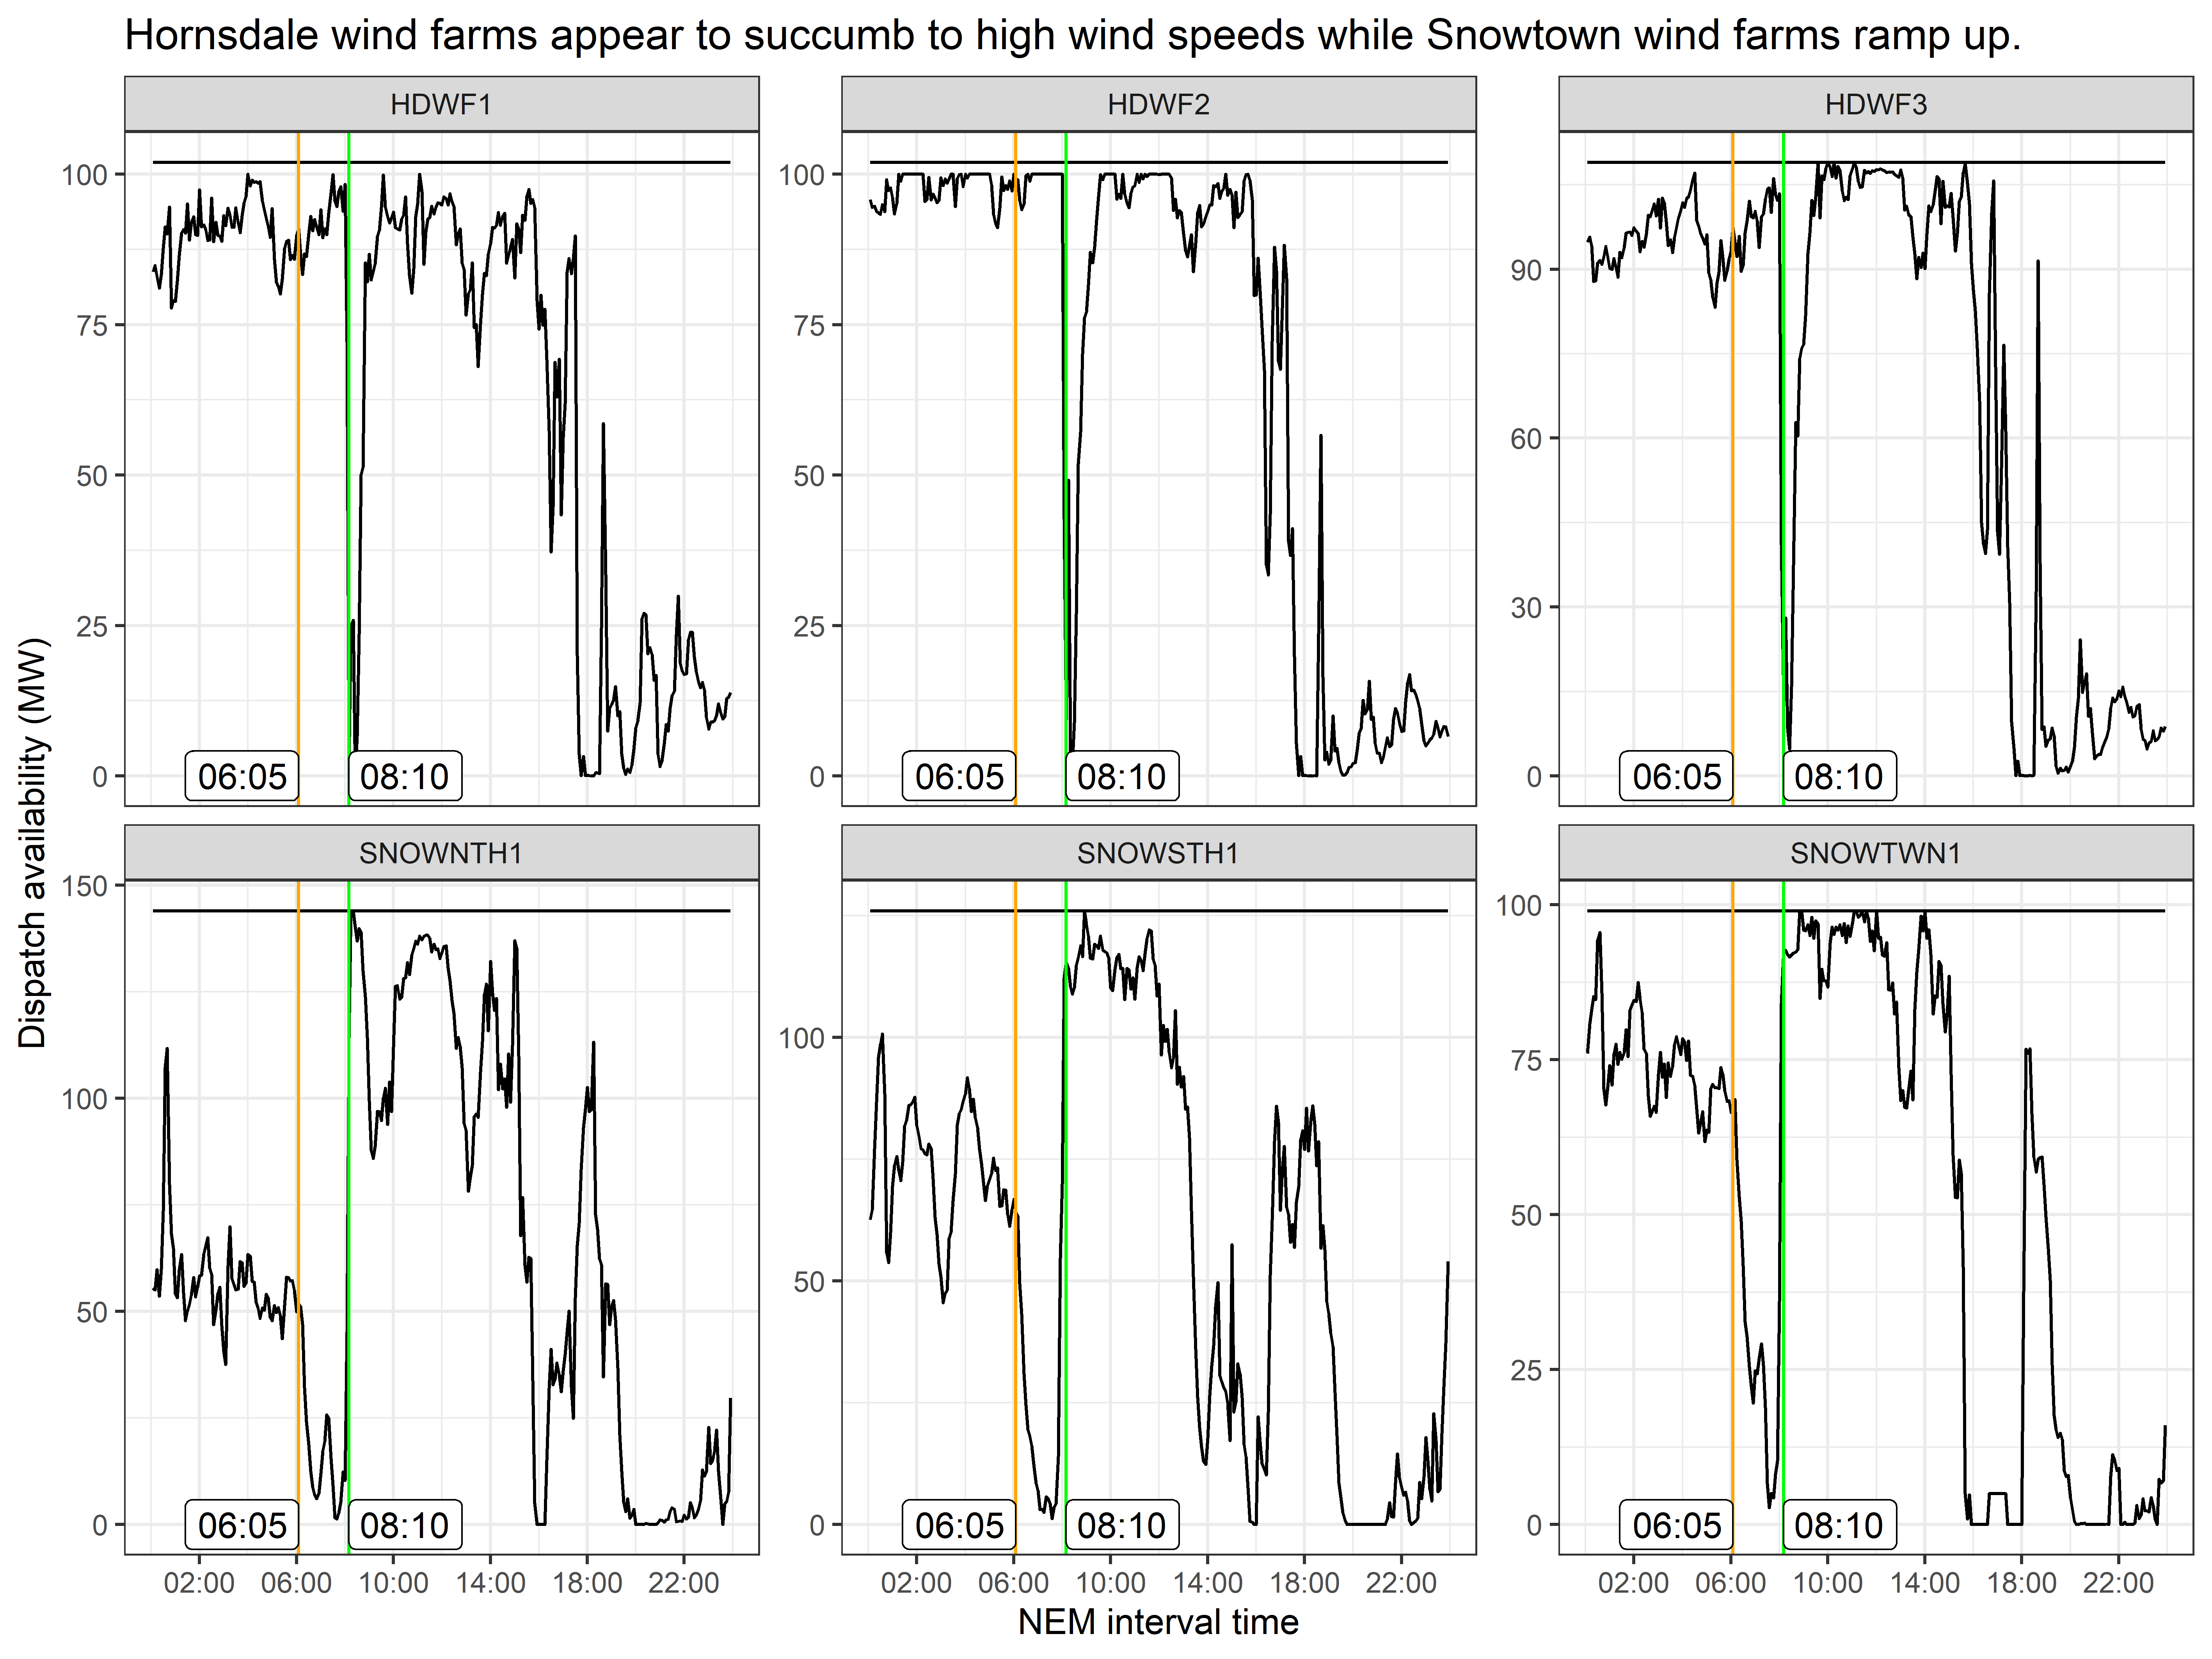
Earlier in the day, Hornsdale wind farm units 1, 2 and 3 all appeared to restrict availability in association with high wind speeds for the 08:10 dispatch interval. Strong winds were still present about 90 km to the south-south-west at Snowtown, which in the 08:10 interval, were supporting rapid increases in dispatch availability at Snowtown North, Snowtown South, and Snowtown. These wind farms all saw availability reach near-maximum capacity. Curiously, we also see a drop-off in availability from the 06:05 dispatch interval at the Snowtown wind farms. This may also have been derating due to high wind speeds as the reductions in dispatch availability were also during unconstrained yet windy conditions.
Other observations
North Brown Hill Wind Farm (NBHWF1) reduced its availability to near-zero for much of the daytime via (we presume) the SCADA Local Limit signal. The reasons for this are not clear but could well have been related network constraints coupled with uncertainty of output during the strong winds, and poor connection point dispatch prices relative to the regional reference price.