We’ve already posted four articles today (three about this year’s islanding of South Australia) and have a number of people delving into other lines of analysis.
To assist in reducing the amount of repetition in these articles, I thought it would be useful to post a sequence of snapshots from ez2view Time-Travelled back to the immediate vicinity of the transmission trip … which you’ll recall AEMO noted:
‘At 1639 hrs 12/11/2022 a significant power system event occurred.
Description of event – Multiple tripping of transmission lines
Transmission element(s) tripped – Tailem Bend – South East 275 kV #1 & #2 Lines’
There are five widgets shown here in the same window, stepped forward five minutes at a time (and time is shown in NEM time), but in reading through the following remember that dispatch intervals are time stamped for the end of the interval, so each snapshot is a combination of:
1) End of interval values (such as Price, and Target Flow, and FinalMW); plus
2) Start of interval considerations (noting Price and Target Flow are produced at the start of the DI by NEMDE).
What this means is that the trip will be seen progressively revealed from 16:39 onwards.
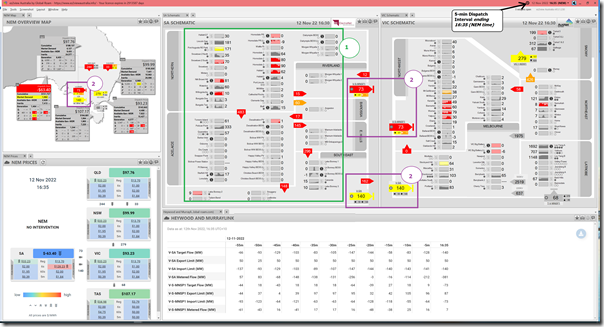
16:35 … 4 minutes before the trip
We’ll start immediately before the trip, with this snapshot for the 16:35 dispatch interval:
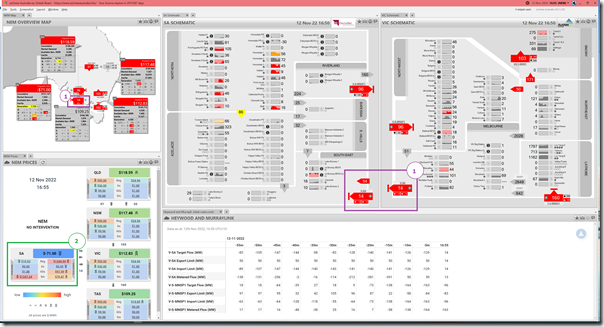
I’ve highlighted two things in particular:
1) In terms of the generation mix*, please note (at a high level) the initial state of the South Australian network:
* remembering that in Time-Travel the Schematic Widgets in ez2view show ‘end of interval’ FinalMW metered readings, so this is what they were producing at 16:35 (four minutes before the transmission trip);
(a) It’s quite patchy wind (given the weather front!) in South Australia:
i. with many wind farms in the Northern Zone particularly spinning strongly;
ii. but wind farms in the South East Zone producing much less;
iii. The performance of individual wind farms, and pattern through the day, is something we might be able to look into specifically in a subsequent article.
(b) In contrast, the Large Solar farms are muted in performance,:
i. Understandable, because of the storm front
ii. But some (like Tailem Bend) will probably have been that way because of ‘no negative price’ clauses in their PPA;
(c) There are only a few thermal units operational:
i. Hallett GT (why this is operating with the price at –$63.40/MWh is a curiosity we might delve into later);
ii. Torrens has a single unit on;
iii. Pelican Point is running, and has been ramped up over the past hour;
iv. Quarantine has 2 units on.
2) At least in part because of all that wind, South Australia is exporting to Victoria :
(a) Remember that the Schematic Widgets in ez2view show Target Flow (i.e. produced by NEMDE);
(b) Whereas the trend widget at the bottom also shows Metered MW Flow (which we’ll think more about in later images).
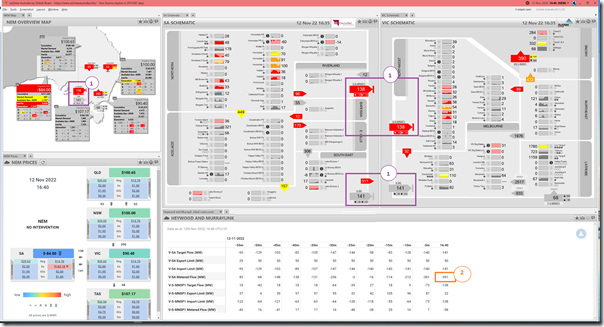
16:40 … straddling the trip
With the trip occurring at 16:39 (according to the AEMO Market Notice) we need to keep in mind that the 16:40 dispatch interval straddles this … and indeed much of the data in the widget will be showing what was anticipated at 16:35 (prior to the trip):
Two quick notes here:
1) The Target Flow for the interconnectors are ‘pre trip’ numbers
2) The Metered MW Flow for the 16:40 dispatch interval is the metered flow at 16:35 (i.e. at the start of the dispatch interval).
… so all of this pre-dates the trip of the interconnection, and we need to step forward another 5 minutes to see the first sign of change…
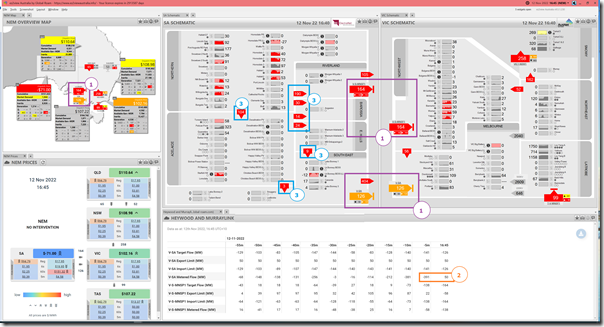
16:45 … showing the trip
It’s in this dispatch interval that we start to see much of the change:
With respect to the numbering:
1) From the Target Flow numbers (which are not much different than 5 minutes ago) we see that the trip (at ~16:39) was too close to the end of the prior dispatch interval for the implications to be successfully captured and processed in NEMDE … so essentially everything from a dispatch point of view is operating as if the line is still intact.
2) However the Metered MW Flow has changed significantly:
(a) from –391MW (i.e. flow to the east) to +50MW (i.e. flow the the west)
(b) that’s a net change of 441MW … in a region where the Market Demand was under 1,000MW … which has got to have sent the Islanded SA System Frequency skyrocketing (more in another article soon)!
3) What’s even more interesting is the big changes in the intra-regional flow numbers captured in the ElectraNet data over the 2 snapshots above:
(a) In particular, pay attention to flows into South East from further west in South Australia
(b) This has changed from 463MW flowing east (i.e. 157MW + 306MW) to only 12MW (i.e. 9MW + 3MW) … which clearly shows where the break in the network was!
(c) This data is metered by ElectraNet at 16:40 NEM time, so just after the break.
(d) Again suggesting a huge jump in SA Island Frequency.
… note that this data is part of an ‘optional extra’ data set available to ez2view clients.
4) Not annotated above, but there are plenty of changes at an individual unit level, each of which would be worth investigating.
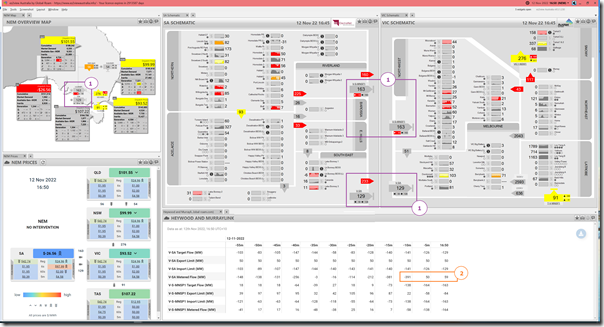
16:50 … the market’s still to catch up
By the 16:50 dispatch interval, the market should be starting to catch up with the physical changes:
Following the trip one might think that some forms of automatic adjustment would be made in order to cater for the different conditions:
1) But we still see Target Flow on the interconnectors as if the Heywood interconnector was still intact
2) With Metered MW Flow supplying a small amount of power west to keep the lights on in places like Mt Gambier and so on.
16:55 … NEMDE has caught up (but not yet the bidding?)
By the 16:55 dispatch interval, NEMDE is recognising that South Australia has islanded:
There’s lots to see, but just flagging two things:
1) Constraints are bound limiting Target Flow on Heywood to small flow west; and
2) There’s some major gyrations in FCAS prices.
… note that Regulation Lower is one of the prices that has spiked in South Australia (the one that has already hit the Cumulative Price Threshold on Monday 14th November 2022).
17:00 … Manual rebids begin
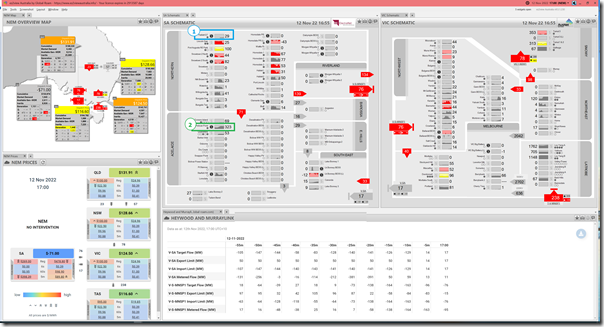
Last snapshot for this sequence is the 17:00 dispatch interval:
With respect to the annotations:
1) There’s a change in bid for Hallett GT (there was actually a change in bid for Hallett GT for the 16:55 dispatch interval as well); and
2) There’s a change in bid for Pelican Point as well.
3) Not specifically highlighted, but the ‘$’ symbols on many Semi-Scheduled units are due to ‘the rise of the autobidder’…. all together the bidding response to the islanding would made for an interesting piece of analysis later…
That’s all for now…


Leave a comment