It’s almost a year to the day that we released the GSD2019, which was based on the earlier GRC2018 – so we’re pleased to have been able to launch the updated Generator Statistical Digest 2020 earlier this week.
Already there have been 5 different analysts all sharing their own stories of what jumped out at them from within the 720 pages.
Now it’s my turn and I’m going to focus on the incidence (i.e. frequency) of constraints binding across all DUIDs in the NEM, using the 10-year trends for every DUID provided in the GSD2020. What follows is a lengthy article, so I thought it best to provide a Summary up-front:
Summary #1) AEMO, via the NEMDE dispatch engine, uses ‘Constraint Equations’ to make the mathematical model that is the market (hopefully*) reflect the underlying reality of the physical system that supports the market, and also some of the rules of the market as well.
* the ‘hopefully’ bit is indirectly explored in some articles linked below.
Summary #2) The library of Constraint Equation that AEMO uses to dispatch the market has 10,000s of constraints, and AEMO continues to create more as the market and system change (and, in particular, as more is learnt of the different challenges of non-synchronous generators) … with perhaps 500-900 typically used (or ‘Invoked’) at any given point in time.
2a) Some constraint equations are ‘System Normal’ – so invoked all the time
2b) Some constraint equations are not invoked all the time, but only invoked in relation to certain network Outages.
2c) Some constraint equations are related to Commissioning (e.g. hold points, for Wind Farms and Solar Farms).
2d) Other constraint equations are related to Directions (e.g. to thermal plant in South Australia).
… so the bunch of Constraint Equations invoked is always changing.
Summary #3) Constraint Equations are NEMDE’s way of taking account of underlying network conditions (things it can’t control) to set Dispatch Targets for things that it can control (i.e. Scheduled Generators and Loads, Semi-Scheduled Generators, and Interconnectors).
… as an aside, the obligations of Semi-Scheduled Generators with respect to Dispatch Targets is significantly different (less onerous) – which is the subject of consideration at AEMC currently … and also more broadly in terms of the energy transition (in terms of its sustainability and scalability).
Summary #4) The ‘forecasting models’ people talk about (including what’s used in the ISP and so on) don’t represent all of the Constraints at the point of dispatch:
4a) It’s just too complex a process with lots of unknowns (e.g. in terms of network outages).
4b) Understanding of historical conditions could be used to ‘sanity check’ the level of materiality in the simplifications used to model forward into the future
Summary #5) When viewed across all Scheduled and Semi-Scheduled assets the incidence of constraints is broadly similar to prior years … but the picture is quite different just for Semi-Scheduled assets, where there is a definite increasing trend of incidence (though there was a drop down from 2019 to 2020).
Summary #6) There are occasions when constraints can have a significant impact on Dispatch without even being Bound:
6a) This happens because participant behaviour is changed to avoid the likelihood (in some cases, certainty) of being constrained
6b) There are two examples of this from 2020 discussed below.
6c) My sense is that this is not well understood, and so could be leading to sub-optimal (or even incorrect) conclusions and decisions.
6d) It is not ideal, from a transparency point of view, that these incidences are not reflected in the underlying data (such as in the GSD2020).
Summary #7) Even apart from these ‘hidden’ instances, there were 43 x Solar Farms and Wind Farms that, in 2020, were subject to a Bound Constraint for more than 1,000 hours in the year:
7a) That’s at least 11.4% of the year, sometimes considerably more
7b) It’s also a fair percentage of the whole fleet of Wind and Solar Farms … and should be suggesting to new entrant developers to understand that it is likely they will face constraints.
7c) These plant are spread across the NEM … so the causes are not all the same
7d) ‘System Strength’ is one of the underlying themes … but there are more general limitations that just come from connecting into ‘skinny’ parts of the network.
7e) Just one example is some particular constraints that limited the output of 5 x Solar Farms in the West Murray area through the Jan-April 2020 scope of the GSD2020 as noted below:
(i) this particular issue was resolved by tuning of SMA Inverters, however the thinking that ‘we’re on top of it now’ is dangerously incorrect.
(ii) much better to think with the paradigm that this was just one example of what can happen in future.
Summary #8) There, unfortunately, seems to persist the tendency of some to refer back to the consultant’s report and exclaim ‘but the consultant said we would not be constrained!’ despite the underlying challenges in forecasting this type of thing in advance, and the mixed (and even conflicted) incentives in the process.
Summary #9) Whilst it is possible (as we have in the GSD2020) to tabular the incidence (i.e. how often it happened) of constraint, it is much more difficult for Semi-Scheduled plant (and next-to-impossible for Scheduled plant) to ascertain the severity of the constraint … especially over time for every unit such as we would like to have done in the GSD2020.
Summary #10) Some simple ‘rules of thumb’ might help:
10a) When a unit is being subject to a bound constraint (hence counted in the GSD2020 tabulated numbers), it might be ‘constrained up’, or it might be ‘constrained down’.
10b) By looking at the specifics of that constraint (i.e. Operator, and Factor), you can work out whether ‘up’ or ‘down’.
10c) What is much more difficult is to ascertain how much it was moved up, or down:
(i) If the constraint only affects one DUID, then it might be easy to ascertain (depending how they bid).
(ii) If there are multiple DUIDs in one region, then the CPD Price and Bids need to be viewed to ascertain relative impacts (in real time the Factor can give some clues).
(iii) Once interconnectors are involved, and DUIDs in multiple regions, it’s very complex to understand:
1. the volume impacts can often fall first on those generators marginal in those regions (to allow NEMDE to vary the interconnector targets) – these DUIDs don’t even have to appear explicitly in the constraints and their identities vary depending on bids and prices
2. there are also significant price effects on a regions on one or either side of the interconnector as well.
Summary #11) Everyone who has a significant investment in the NEM should be watching what’s happening with constraints (and we would like to help with that, via ez2view).
————-
So now, for those who want to read more, it’s on with the story…
(A) Why am I focusing on ‘Constraints’ here?
To understand this, it’s worth first providing this background:
——————-
Quick Note about the (predecessor) GSD2019 …
In conjunction with the release of the GSD2019, on January 28th 2019 I’d posted the article ‘Review of extremes in ‘Raw Off Target’ performance through 2019, with the Generator Statistical Digest 2019’ that explored what was evident in the data for Calendar 2019 with respect to the metric we called ‘Raw Off-Target’ – which both:
(a) Is used by AEMO as the primary input into their Conformance monitoring process; and
(b) Which we separated out, as a discrete metric in its own right, in the GSD2019 and also in the ‘Unit Dashboard’ widget within our ez2view software.
Following from that article, an ongoing amount of feedback received from a range of different parties (plus our own incessant curiosity) drove us to continue exploring how performance in the NEM has been changing specifically with respect to Aggregate Raw Off-Target for Semi-Scheduled plant, in an expanding series of Case Studies linked here.
This proved of interest to a variety of different people and organisations – including the AEMO (in this ‘highlights of our 2020 year’ note, I included the comment that the Case Studies were referenced in AEMO’s presentation (p8-9) on 7th December 2020 to its Intermittent Generator Forum). The insights generated also fed into the ongoing development of ez2view, for the benefit of those clients.
——————-
As a result of this experience in 2020, I thought that (for the release now of the GSD2020) I would adopt a similar approach :
1) I’d focus on one single metric and do a progressive ‘deep dive’ into that one;
2) but just choose a different metric – though certainly still one that’s very important to most generators (indeed, there are certainly at least some generators that would see it as more important).
Specifically in this article (and perhaps others that might follow it) I want to focus on what can be gleaned about the nature of constraints affecting DUID dispatch outcomes.
(B) What are ‘Constraints’?
So it’s logical to start at the start – by explaining something about what we mean when we talk about ‘constraints’ … and why they are so important.
In the expanding Glossary that forms a growing part of the value that WattClarity delivers, we have included this page to that currently provides a starting explanation … but it will continue to be enhanced over time (as time permits).
For now, there’s a bit of an introduction provided below:
(B1) How constraints fit in the dispatch process
Whilst it’s important to remember that the NEM operates with respect to various time scales and horizons (as Stephen Wilson showed clearly in his diagram), from a certain perspective the most important time-step is the Five Minute Dispatch Interval.
Thinking about the processes that are undertaken in dispatching the market, there are several realizations that (we believe) would assist in understanding how constraints fit in, and more generally about dispatch as a whole.
(A1a) ‘The NEM’ as a Mathematical Model
In order to understand how constraints work, in the context of the NEM, it’s important to first recognise that there are two related but different constructs:
| ‘The NEM’ as a physical reality |
‘The NEM’ as a mathematical model |
|
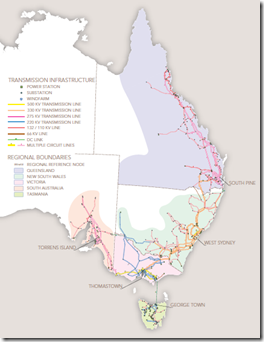
When most people think of ‘the NEM’, it’s fairly likely that they picture something physical – like this map that was published by AEMO some years ago: However thinking about the NEM physically is not the only valid paradigm …. (and perhaps not even the most useful one in this case) … |
… equally important (or perhaps even more important, in terms of understanding constraints) is that the dispatch model that supports the NEM, known as NEMDE or ‘NEM Dispatch Engine’ is a mathematical construct. It should, in theory, represent the underlying physical reality (and the Rules under which the market operates) – but the important thing to understand is that it’s the mathematics that determines the dispatch outcomes. Indeed, we have seen some cases (such as some examples below) where these mathematical equations have led to seemingly perverse outcomes that are only understandable when considering the underlying mathematics … particularly when it comes to constraints!
|
With this in mind, let’s think of the following…
(B1b) Levels of Complexity
One way to understand constraints is to (within the Mathematical Paradigm) understand that there’s a simple model of how dispatch works in the market:
NEMDE takes the bids & offers and finds the optimal least-cost dispatch of generators & interconnectors subject to constraints
… where, it is important to note, that ‘cost’ in this context is not what you might think of as cost directly paid by energy users, but rather input cost (with bids taken as proxy for input costs).
This simple model is complicated in a number of different ways:
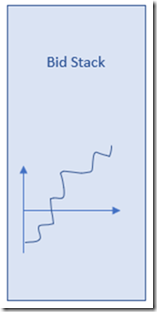
| The ‘Simple Bid-Stack View’ | . | Complication #1 Multi-Region |
Complication #2 Constraints |
Complication #3 Co-Optimisation |
| Scheduled (and Semi-Scheduled) Generators and Loads submit bids into the market in order to participate in the dispatch process…
This Beginner’s Guide walks through how the simple bid-stack model works. |
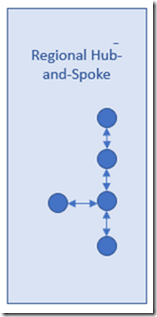
. | … but this ‘Simple Bid-Stack View’ is complicated by the fact that the NEM contains multiple regions, with inter-regional interconnectors (a mathematical construct representing a more complex physical reality) between these regions:
Even at this point, the model assumes that all generators are directly connected to the Regional Reference Node by a ‘hub and spoke’ model… |
Now this ‘hub and spoke model’ (which, incidentally, used to be how many forecasting models worked) is pretty far removed from reality, as it would assume each region is entirely unconstrained within the region boundary.
That’s not the case! From a mathematical point of view, Constraint Equations are used to reflect all of the limitations that act on the ‘NEM Mathematical Model’: Constraint Equations are one of the main reasons why relatively few dispatch intervals have a ‘Very Simple’ price setting outcome . |
… with another reason for pricing outcomes being more complex being that NEMDE co-optimizes each Dispatch Interval across 9 commodities (ENERGY and 8 x FCAS SERVICES):
Indeed, in a typical dispatch interval, there would be 100-200 constraint invoked just to deal with FCAS market considerations. |
The three complications here beyond the ‘Simple Bid-Stack View’ are not the only ones.
——————
For >10 years we’ve been investing $Millions in the ongoing development of our ez2view software, to help wholesale market participants understand the detailed nuances of these types of complications.
We’ve come a long way over that time, and the ez2view client base is growing significantly as a result – but we know we have a long way still to go until everything is crystal clear. That’s why we’re still on the lookout for other great people who can help!
However that’s a story for another day …
——————
In this article, we’re dealing with what’s evident in the recently released GSD2020:
(B1c) About constraints
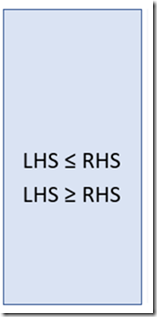
As noted on the Glossary Page, on most occasions (with FCAS constraints being a notable exception, but not the only one) the form of the constraint is as follows:
LHS ≤ RHS
… where the Left-Hand Side (LHS) contains all the terms that NEMDE tries to influence in the co-optimisation process assembled in a linear equation, such as:
LHS = Factor1 x Var1 + Factor2 x Var2 + … FactorN x VarN
… and the Var1, Var2 … VarN are DUIDs and interconnector elements that NEMDE gives Dispatch Targets to (and the LHS must be of linear form, because NEMDE is a linear program (LP)).
—
The Right-Hand Side (RHS) reflects the things that generally NEMDE can’t control, but essentially treats as “Constant” for the given dispatch interval.
(B2) Important terms, with respect to constraints
Keep in mind the following key terms, with respect to constraints
| Term | Explanation |
| Invoked |
‘Invoked’ is the NEM-specific term for ‘being used’. There are 10,000s of constraint equations that have been prepared for use at various points in time (e.g. depending on network configuration, or network outages underway) – and the AEMO, in conjunction with the TNSPs, creates more each month as the market evolves. Typically there might be 500-800 of these invoked in a particular dispatch interval: The specifics of the constraint equations that are invoked changes all the time … |
| Constraint Equations and Constraint Sets |
… but before we get into the specifics of how these change, we need to understand that ‘Constraint Equations‘ are always invoked in ‘Constraint Sets‘ (even if, in rare instances, the Constraint Set only contains one Constraint Equation). More typically, a Constraint Set might contain a couple, a dozen, or even (perhaps – I have not specifically counted!) a hundred Constraint Equations … |
| “System Normal” or “Outage” |
… some Constraint Sets are always invoked, because they are considered ‘System Normal’. These tend to be Constraint Sets with lots of Constraint Equations as members of the set. Other Constraint Sets are only invoked sometimes to deal with different network outages, so are classified as ‘Outage’ constraint sets. |
| Constraint Equations being “Bound” |
Speaking again about Constraint Equations, sometimes NEMDE can’t find an optimal solution without the LHS equalling the RHS of a particular constraint equation. On these occasions (i.e. LHS = RHS) the constraint equation is then known as ‘Bound’. At that point, the constraint equation is having a $ impact on the ‘Objective Function’ solved by the NEMDE Linear Programming engine…. |
| “Marginal Value” (or MV) |
… that $ impact is known as ‘Marginal Value’. However it is not the same as what we might think of as ‘additional cost to the energy user’ – rather a cost to the Objective Function. A larger MV can be interpreted as the constraint being more likely to stay bound under small changes in market conditions. |
| “Constrained Down” or “Constrained Up” |
Keeping in mind that the operator might be ‘<=’ or ‘>=’ and that the LHS terms can be ‘+’ or ‘-‘, it should be understandable that a unit’s Dispatch Target (or an interconnector’s Dispatch Target) might be either:
|
| “Volume (MWh) Constrained” |
… so it’s logical for people to wonder ‘how much volume have I forgone, because I have been constrained down?’ Unfortunately, the answer to that question is not quite as easy as it would otherwise appear: 1) On 5th June 2020, Marcelle wrote how ‘Not as simple as it appears – estimating curtailment of renewable generation’ to address this question for Semi-Scheduled plant. 2) For Scheduled plant (i.e. or plant that don’t bid all their volume at prices well below the RRP) it’s difficult, if not actually next-to-impossible, to even guesstimate the volume of energy curtailed. We certainly can’t just use the ‘Hours Subject to Constraint’ metric in the GSD2020 and multiple by some MW capacity number to come up with anything remotely plausible! |
| Constraint Equations being “Violated” |
Speaking again about Constraint Equations, on (thankfully) much rarer instances, NEMDE can’t find any solution (i.e. not even a case where the constraint is Bound). In cases like these, NEMDE will proceed to consider “Violating” constraint equations to see if a solution can be found … starting with those constraint equations that have the lowest “Weight”. |
Now that we have the basics behind us, let’s move on…
(C) Prior consideration about constraints
… but before we move onto the GSD2020 directly, it’s probably worth highlighting (as background) some prior discussions about some particular constraints that have appeared over the years:
(C1) in WattClarity
In particular, I’d like to highlight a few particular examples of constraints – with links to prior discussion in articles on WattClarity:
| Example | Brief Discussion |
| System Strength in South Australia |
Up until the SA System Black (28 Sept 2016), I don’t recall that system strength was a significant consideration in the dispatch of the NEM … and (as a result) did not feature significantly in the constraint equations used until that point. Indeed, in the GRC2018 we were able to back-calculate the instantaneous level of inertia in the SA grid and highlight that levels had been falling well below what AEMO later determined to be ‘minimum’ levels for many months up until the system black. This was later shared here on WattClarity. Now, System Strength (an electrical property) is not the same physical property as Inertia (a physical property), but has been supplied historically by the same type of plant – i.e. large mass, high-speed and synchronous (which had been the ‘normal’ approach up until recently). It’s only been in the past decade that system planners and operators really had to think about these types of concerns in earnest again. One outcome of the raft of investigations that followed the system black was heightened attention paid to the ‘Keeping the Lights on Services’ (like Inertia and System Strength) that was not been supplied by new non-synchronous plant focused solely on ‘Anytime/Anywhere Energy’. One of the approaches adopted was the adoption of constraints that (in conjunction with AEMO Interventions) would seek to ensure sufficient synchronous units were operational to provide System Strength for the South Australian region. The system strength constraints were put in place to essentially constrain down Wind Farms (and, later, Large Solar Farms as well), as the simulations showed that there was a maximum stable level of wind/solar generation under particular combinations of thermal plant commitment. These particular combinations of thermal plant commitment were represented in very lengthy ‘IF … THEN’ RHS formulations. These essentially took different forms over time: 1) Initially it was a constraint equation “S_WIND_1200_AUTO” 2) But then that morphed into constraints of the form “S_NIL_STRENGTH_1” and “S_NIL_STRENGTH_2”. As some of the linked articles discuss, the AEMO progressively refined its understanding (and so the RHS combinations allowed) of acceptable synchronous plant combinations. 3) Other constraint equations have been seen (such as in the GSD2020), but not as commonly. Because these types of constraint equations were seeking to cap Wind and Solar generation in South Australia and were blind to location within the SA grid, all factors on the LHS have been 1.0. Where sufficient thermal commitment is determined (by the complex RHS permutations) a ‘swamping’ term is added to make the RHS very high. This same approach has been used elsewhere with other System Strength related constraints. Some of the articles posted on WattClarity since their introduction in 2017 have been tagged, and so accessible through the links above. Unfortunately we’ve not been zealously diligent in doing that, so other articles will be buried in the history (perhaps discoverable by search). In the GSD2020 results for Wind Farms and Large Solar Farms in South Australia, therefore, keep an eye out for the constraint equations above. — Now that (in 2021) the first of the synchronous condensers Electranet has been installing will be operational, there are questions about how the System Strength constraint formulations (and their incidence, and severity) will change. We’ll be keen to update more on WattClarity as this space unfolds… (starting with this article by Allan O’Neil on Tue 9th Feb 2021). |
| System Strength in North-West Victoria |
No time to delve into these here currently, other than to note that the first system strength constraints were implemented from 7th January 2019. |
| System Strength in Northern QLD |
The first System Strength constraints for northern QLD were implemented from 27th May 2019 (I’d expected this sort of thing to arrive, along with other limitations). I’m sure there are more examples addressed in other articles on WattClarity but could not find any general examples on a cursory search. BUT there’s one particular example I would like to flag… |
| ‘Q-BCNE_821’ constraint set Northern QLD Tuesday 13th Oct 2020 |
… on Tuesday 13th October 2020 in QLD we did experience a doozy of a morning, where >500MW of Large Solar production was unexpectedly ‘constrained down’ as a result of a particularly sharp coding of a series of constraint equations:
This was analysed in a progressively developed Case Study that helps to illustrate one example of where it was moreso the maths, not particularly the underlying physical condition, that dictated the volatile outcome … and outcome that would have been expensive for some:
In some cases in the GSD2020 you will find the ‘Q_NIL_STRGTH_GENERATOR’ constraints in the ‘Top 5’ list for a particular DUID. When you do, you can use this background linked in here to understand more… |
| ‘West Murray’ limitations |
There’s some discussions below about this, with respect to Broken Hill Solar Farm and Bannerton Solar Farm. |
| The new ‘X5 Constraint’ N^^N_NIL_3… for the ‘Polygon of Pain’ (renamed ‘Rhombus of Regret’) |
There’s another series of articles on WattClarity that provide another opportunity to learn more about the way constraint equations function, and this has to do with the ‘N^^N_NIL_3’ constraint equation (which has a particularly significant effect on Limondale and Sunraysia Solar Farms), which was implemented by AEMO from 20th November 2020:
Though this constraint equation was only present from late November 2020, watch out for this one in the ‘Top 5’ constraints. What’s more the point, keep an eye out for its earlier siblings that (because they have been around for longer) will be further up the list:
The NEM is a complex place! |
| 24th Jan 2021 Price spike to $15,000 in the 16:35 and 16:40 dispatch interval in QLD |
I know it is outside of the (calendar 2020) scope for the GSD2020 … but what happened on Sunday 24th January 2021 in QLD seems, to me, to be another case in which the mathematics (perhaps distinct from the underlying physical reality) might have been a contributor to the market outcomes. You’ll have to stay tuned to follow-on articles on WattClarity (as time permits)
|
Perhaps that’s enough specific examples for you to keep an eye on in the GSD2020?
(C2) in ez2view
I noted above that we’ve been working intensively on the ez2view software since late in 2010 … which was incidentally when 2 rule changes relating to market transparency (one with respect to Constraint Equation and Constraint Set data) came into operation.
Since that time, the value of the software has increased enormously – not least of which is because of the understandability the product provides of constraint data.
In the same way that investing time last year in exploring ‘Raw Off-Target’ on WattClarity also had flow-through benefits to ez2view, we anticipate that doing the same this year will stretch ez2view capability even more in delivering value with respect to constraints.
Do you know of people who can help us?
(D) What does the GSD2020 say about constraints?
(D1) Structure of the GSD2020
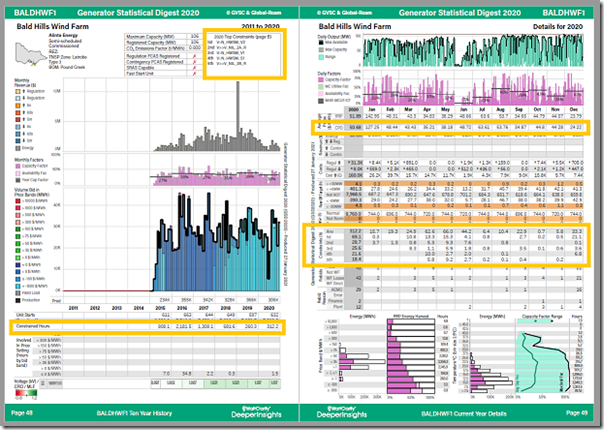
Both the ‘A’ page and the ‘B’ page contain data relevant to understanding the impact of constraints – as illustrated in the marked-up image below:
In particular note that:
1) The ‘A’ Page provides a 10-year trend of ‘Number of Hours Constrained’ for the given DUID, and also (for the 2020 year) a ‘Top 5 Constraints’ list, in terms of numbers of hours.
For clarity, readers should be aware that:
(a) an incidence of constraint can be of varying severity (in terms of volume curtailed due to constraint – or even, on occasions, about volume being ‘constrained up’). The severity of the constraint is not reflected in the ‘Hours Constrained’ statistic, rather it is a statistical that measures incidence (i.e. how often it happens – which is important, but different).
(b) as noted above, calculating the severity of the constraint is quite difficult to do properly for Semi-Scheduled assets (and next-to-impossible to do properly for Scheduled assets).
(c) readers cannot simply multiply the ‘# hours’ stat by some assumed ‘MW constrained down’ figure to derive a severity measure.
2) The ‘B’ Page takes those ‘Top 5’ constraints (and also the total for the year) and breaks down the aggregate numbers into monthly totals.
Again for clarity, readers should understand that:
(a) it is logical to add numbers across columns (i.e. across a selected row); but
(b) it is not logical to try to add down a column as it is entirely possible (and indeed quite common) for multiple constraints to be bound on a given unit at a particular Dispatch Interval.
3) In addition, on the ‘B’ Page, we can also see the monthly average ‘Connection Point Dispatch’ Price (i.e. CPD Price) which will provide a measure of how significantly the constraint has impacted the unit across the month (i.e. the lower the CPD Price compared to the VWA Price, the more significant the impact), but won’t reflect the revenue received per month.
(D2) Looking across all units
(D2a) Just for 2020
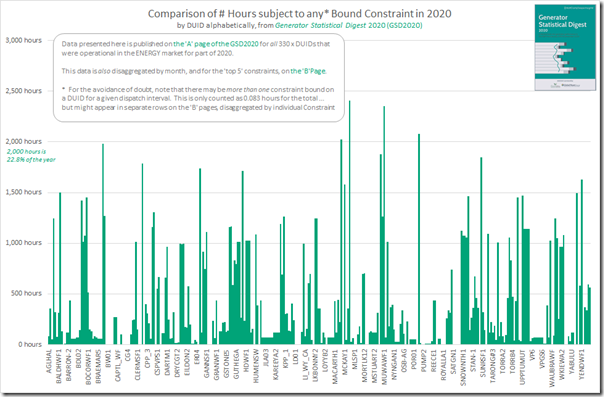
If we extract from the GSD2020 the calculated ‘Number of Hours Bound with any Constraint’ metric for all of the 330 x DUIDs that were operational in 2020, we see the following:
Don’t pay much attention to the DUID labels on the x-axis as (being 330 of them) there are too many to list in total.
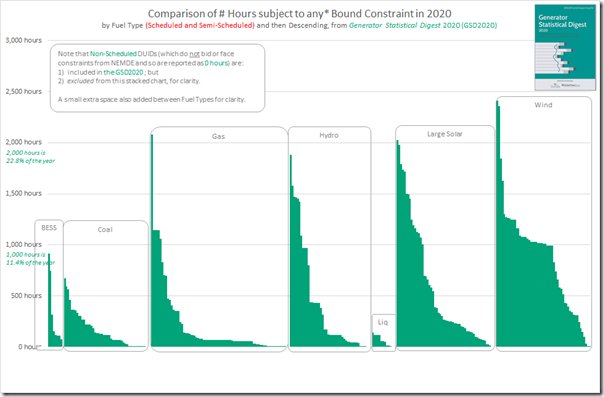
What’s much more important, at this point, is to understand the extreme range of variation. At the high end, we see a significant number of DUIDs subject to bound constraints for more than 1,000 hours in the 2020 calendar year (56 DUIDs in total – or 17% of the total number) – remembering that 1,000 hours represents 11.4% of the year, so an enormous amount of the time.
Not so fast, though!
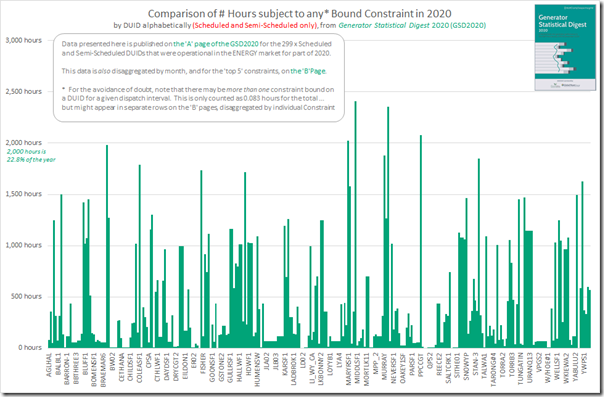
You see, the situation is actually worse than the numbers above might suggest … because a number of DUIDs in the mix above are Non-Scheduled units (which are, by definition, never going to be affected by NEMDE constraints … though perhaps separately by constraints imposed directly by TNSPs or DNSPs). So it is logical to exclude these 31 x DUIDs from the list and re-present the data in alphabetical order as follows:
So having reset the chart to a more ‘realistic’ representation of results, we can revisit the results and make it clear that:
1) At the high end, 56 x DUIDs of 299 in total (i.e. 19% of the total) experience bound constraints for more than 1,000 hours across the year; whilst
2) At the bottom end, only 9 x DUIDs (i.e. 3%) experienced 0 hours
… which brings me to highlight what should be a critical observation for anyone looking to build a new asset in the NEM:
If the consultant you’re using is telling you something like “you won’t be constrained” – then the historical stats would tend to suggest that the reality is unlikely to play out that way, and you should be quite careful in considering what assumptions have been made in the modelling, and how detailed the model is!
One way these results can be re-arranged is to be grouped by Fuel Type – and then re-sorted in descending order. This has been done in the chart below, where DUID names have been obscured to avoid confusion:
In conjunction with the launch of the GSD2020, other analysts have already noted some of the ‘most frequently constrained’ DUIDs (in hours per year). For instance:
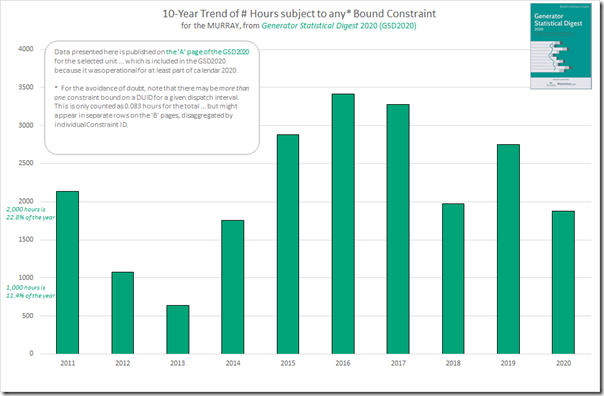
1) David Leitch has already noted that Engie’s Pelican Point CCGT was the ‘most frequently constrained’ gas-fired unit, constrained for 2,078 hours over the year … but we can also see from the above that this total was almost two times the next highest numbers (almost equal totals 1134-1144 hours for Origin’s 4 x Uranquinty open-cycle units in southern NSW).
2) David also noted, that the highest incidence for a coal-fired unit was only 1/3 as high – being Stanwell unit 2 at 675 hours.
3) Snowy Hydro’s Murray unit, on the VIC region boundary, was the ‘most frequently constrained’ hydro unit at 1,880 hours.
4) David highlighted the Brigalow/Maryrorough Solar Farm in QLD was constrained for 2,024 hours … and this is perhaps even more telling, as it was not even operational for the whole of the year!
5) From the wind farm stable it’s probably not a surprise to many who have watched the market (or even just read the energy-sector focused media) that Mt Emerald Wind Farm was ‘most frequently constrained’ wind farm at 2,410 hours in Far North QLD – but this was only slightly higher than Murra Warra Wind Farm in VIC at 2,355 hours (David noted both of these). Indeed, of the ‘10 most frequently constrained’ wind farms in terms of hours constrained, it might surprise that only 2 were in South Australia!
Every DUID has its own story and (beyond a couple samples below) we’d invite those who are interested to explore themselves with their own copies of the GSD2020.
(D2a) Ten Years (2011 to 2020)
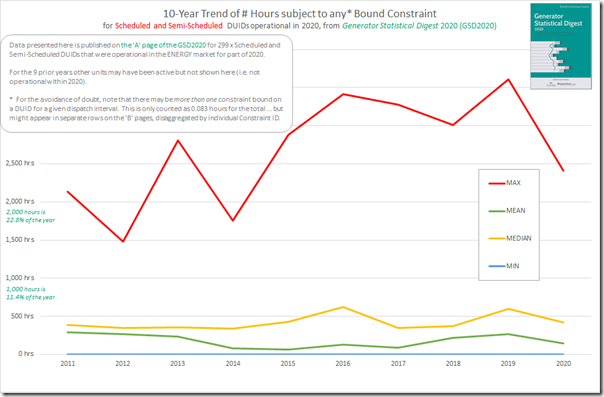
What happened in 2020 is only part of the picture, however – the ‘A’ Page provides direct access to a trend of that aggregated annual total for each of the DUIDs listed in the GSD2020. Using this data, we’ve drawn up the following trend of basic statistics:
In the trend above I have excluded the Non-Scheduled units (which would just pollute the statistics) and so drawn a trend across all of the 299 DUIDs that were Scheduled or Semi-Scheduled and operated through at least part of 2020.
Whilst the eye is drawn to the extremes of the ‘MAX’ (which most likely is a different unit in each of these years), perhaps a better indication of ‘what’s normal’ might be seen in the trends for MEDIAN (hovering around 500 hours for the year – still 5%, so definitely non-trivial). The MEDIAN value is probably more appropriate as a general guide than the AVERAGE (which we see is comparatively lower).
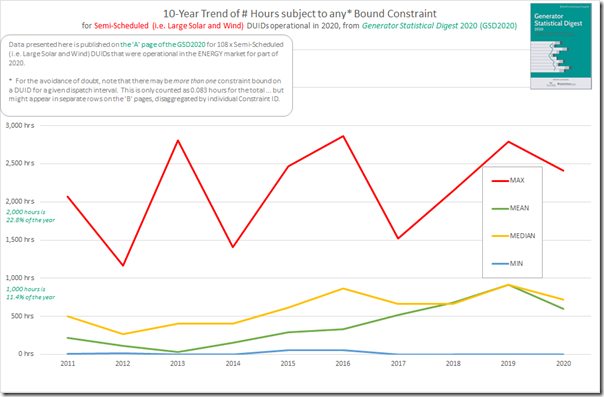
Now, because most of the new units being built for the NEM are non-synchronous and operated as Semi-Scheduled, it seemed of good value to exclude all of the Scheduled plant from the statistics above and focus on the 108 x Semi-Scheduled units operational through at least part of 2020:
In this chart (whilst the MAX still catches the eye as being sky-high) it’s the MEDIAN that is really telling in that it’s been growing over the past 10 years … and is approaching double the MEDIAN in the first chart above (when we also consider Scheduled plant). There are three main reasons why this is the case:
Reason 1) Because these assets are generally being located in remote parts of the grid that are weaker than scheduled plant (in part, we believe, because of the mindset of ‘Anytime/Anywhere Energy’ that’s been encouraged to persist), network limitations are more commonly affecting their output.
Reason 2) By virtue of being non-synchronous, different forms of System Strength constraint are also limiting their output; and
Reason 3) It’s also worth noting that the newly commissioned plant are also seeing their share of commissioning constraints in the early periods.
3a) We debated about whether these should be counted as ‘constraints bound’ in the stats for the GSD2020 … but we determined if we started to exclude some, where would we stop (i.e. it becomes increasingly subjective, so more difficult for readers to interpret the data).
3a) Including them means that, when there are lots more new entrants (and especially if there are lengthy commissioning periods) then there’ll be more units subject to commissioning constraints just based on the maths.
(i) That in itself doesn’t mean the constraints are getting worse.
(ii) The fact that many had long delays in commissioning is a different story.
… so, once again, how is it reasonable that anyone could be believing any advice they receive that ‘you won’t be constrained’ when looking to build a new Semi-Scheduled asset?!
Historical incidences strongly imply that this is just not going to be the way things will unfold …
(D3) Looking at particular units
Somewhat randomly, I’ve selected a couple particular units to have a look at how the GSD2020 helps us understand how they have been affected by constraints through the past 10 years, and in particular in 2020:
(D3a) Engie’s PPCCGT in South Australia
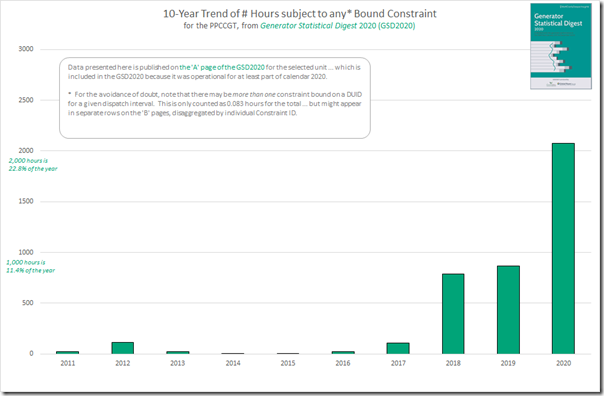
Because it was such an outlier amongst the gas-fired units in 2020, I was interested to have a look at the results specifically for Engie’s Pelican Point CCGT unit – with the trended results here:
We can clearly see that the incidence has grown off quite a low base till 2017, and more than doubled from 2019 to 2020… and we wonder why? Thankfully, the GSD2020 can help …
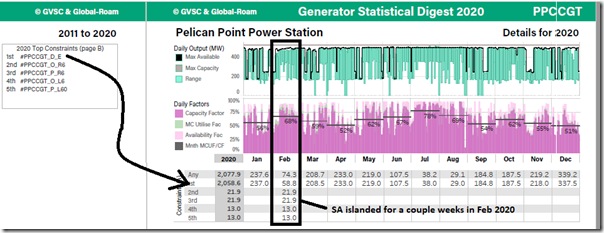
In the above image, I’ve mashed together a couple different elements from the ‘A’ Page and the ‘B’ Page for PPCCGT and it’s clear to see that a single constraint equation was driving the lion’s share of the total.
——————————–
Understanding the constraint #PPCCGT_D_E
Those clients who have access to ez2view can quickly search for the ‘#PPCCGT_D_E’ constraint equation to see that it’s a member of the ‘#PPCCGT_DE’ constraint set – and that this reveals two things of interest:
#1) First point of interest is that the description ‘Direction – Energy – No Intervention Pricing’ indicates that the constraint is invoked when AEMO gives a ‘Direction’ to the unit to perform at a certain level.
#2) Second point of interest is that, even recently, this constraint set has continued to be invoked (as I type it was invoked on 29th January, 30th January, 1st February and is also invoked today (Friday 5th February 2021). In the table above we see it was invoked and bound for many hours in all of the months through 2020.
‘Directions’ to participants are made by AEMO when AEMO requires the unit to perform in a certain way … which most likely is because PPCCGT is providing System Strength in the South Australian region. Because the Direction instruction is effectively made outside of the NEMDE dispatch process (i.e. it’s not an outcome of the NEMDE run), the AEMO needs to invoke a constraint to make it a self fulfilling prophecy … in other words:
Step 1 = AEMO determines a unit needs to perform in a certain way;
Step 2 = NEMDE would not ordinarily dispatch the unit to perform in that way (e.g. because they are not offered to the market);
Step 3 = hence AEMO makes a Direction to the unit (think of this as AEMO calling the Generator up to tell them where to be at such-and-such a time period); and then
Step 4 = invoke a constraint in NEMDE to reflect the direction
Step 5 = so the actual NEMDE outcome reflects the impact of the direction.
Step 6 = the constraint is automatically bound, as the form of the constraint, in this case, is LHS = RHS (or, in other words ‘Dispatch Target = Where I need you to be’).
So what that means, in interpreting the table above is:
Observation 1) Very likely that this constraint is effectively reflecting that the unit has been ‘constrained up’ (not ‘constrained down’); and
Observation 2) The table above effectively shows the number of hours in each month when PPCCGT received this particular direction (i.e. because every time it’s invoked it is bound).
——————————–
It’s worth also noting that:
1) All 5 of these constraints in the ‘Top 5’ would have been ‘Private Constraints’ invisible to the rest of the market in real time (we see this because they start with the ‘#’ character), and we can presume without looking directly that they are all related to different types of direction.
2) The other 4 are also related to various FCAS commodities.
———————
So, keeping all of this in mind, it is worth reflecting on the numbers showing that PPCCGT was subject to bound constraints at almost twice the incidence as the ‘next highest’ gas units (Uranquinty) as shown in the leader board above. I wonder, but not have time to flip the pages of the GSD2020 to check, what the nature of constraints were for Uranquinty?
(D3b) Snowy Hydro’s MURRAY unit in Victoria
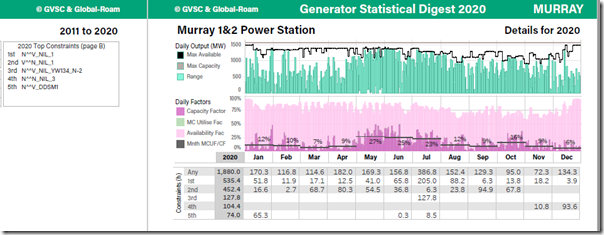
This unit was also mentioned above as the ‘most frequently constrained’ hydro unit – as such, I thought it would be useful to take a look:
It’s clear to see that the incidence of constraints on MURRAY in 2020 (close to 2,000 hours) is typical of the level that Snowy Hydro would be expecting on a year-on-year basis. Not really a surprise.
A couple quick observations:
Observation 1) We can also see with reference to the ‘A’ page for MURRAY in the GSD2020 that the top 4 constraints are all ‘System Normal’ (i.e. they have ‘NIL’ in the constraint name – meaning ‘nil outage’).
1a) of these, we see that 4th on the list (constraint equation ‘N^^V_NIL_3’) is the infamous ‘X5 constraint’ that was discussed above … and made the list at number 4 even though it had only been created by AEMO in November 2020 (i.e. at the end of the year)
1b) Also notable that the 1st on the list (constraint equation ‘N^^V_NIL_1’) was what I termed ‘the earlier sibling’ of the ‘X5 constraint’ … and one that bound for MURRAY 535 hours (or 6% of the year).
Observation 2) Whereas with reference Constraint Search to ez2view again, we see that the 5th constraint in the list ‘N^^V_DDSM1’ is related to an outage on ‘Dederang to South Morang 330 kV line’ … and that the constraint is intended to help to … ‘avoid voltage collapse at Darlington Point for loss of the largest Vic generating unit or Basslink or the parallel Dederang to South Morang 330kV line’. This 5th constraint bound much less frequently (only 74 hours).
(D3c) Infigen Energy’s Lake Bonney 3 Wind Farm in South Australia … now Iberdrola
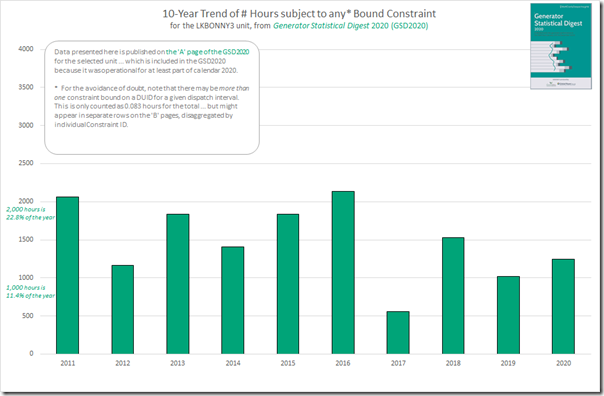
In the ‘league table’ above I’d noted that Mount Emerald Wind Farm (in Far North QLD) had the ‘most frequently constrained’ year of any Wind Farm in terms of constraint performance – however I have chosen to show some stats from Lake Bonney 3 Wind Farm down the other end of the NEM (in south eastern South Australia):
We can see here that the 2020 year was actually an improvement for LKBONNY3 (at least in terms of hours constrained) compared to 6 of the 9 prior years. That said, being subject to 1,248 hours of bound constraint across the year was still a significant amount of time (14% of the year).
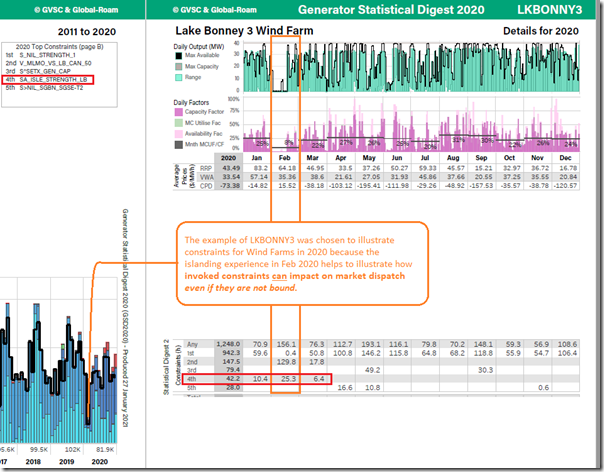
In the excerpt from the GSD2020 below, we can see that February 2020 was a particularly bad month, with output non-existent as a result of the Islanding of South Australia following the Heywood transmission damage on 31st January 2020:
This particular situation is worth noting, in terms of understanding the statistics in the GSD2020 … not just for LKBONNY3 but also potentially for other units as well:
1) As noted in this article at the time, Market Notice 73215 noted that for Friday 31st January 2020, “at 1324 hrs the Moorabool – Mortlake 500 kV Line and the Moorabool – Haunted Gully 500 kV Line tripped resulting in South Australia separating from Victoria.”
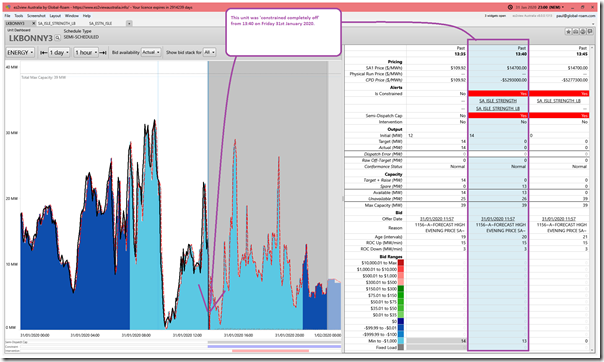
2) One of the steps taken, as a result, was that constraint equation ‘SA_ISLE_STRENGTH_LB’ was invoked in constraint set ‘SA_ESTN_ISLE’ from the 13:40 dispatch interval (all times in NEM time).
NOTE that this is a constraint equation addressing System Strength in South Australia that’s not in the more general listing above!
3) This constraint equation limits the output of Lake Bonney 2 and Lake Bonney 3 Wind Farms to 0MW (i.e. the two Semi-Scheduled ones – not Lake Bonney 1 and Canunda, which are Non-Scheduled) . As such, as shown in the ‘Unit Dashboard’ snapshot from ez2view below Time-Travelled back to 31st Jan 2020, the plant was ‘Constrained down’ to 0MW from 13:40 on the Friday:
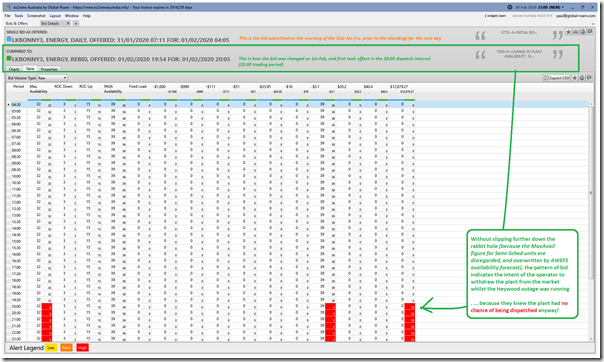
4) At that time, the constraint set was forecast to be invoked out till 17:15 on 17th February 2020… so one could presume that Infigen Energy knew that both Lake Bonney 2 and Lake Bonney 3 would be offline for several weeks. We see that, from 20:05 on Saturday 1st February 2020 volume was effectively withdrawn from the market for this unit – given there was zero chance it would actually be dispatched:
5) I raise this example to highlight that the fact that the unit did not operate through the first half of February 2020 does not show up as significantly in the stats as would be expected, on face value. More specifically, the ‘SA_ISLE_STRENGTH_LB’ constraint equation was only actually bound for a total of 25.3 hours in February, mostly on the 1st February, despite the fact that:
(a) It continued to be invoked for many days afterwards
(b) And would certainly have bound, had any capacity been offered into NEMDE.
… so readers should use this example to remind themselves that there are times where constraints can have an impact on dispatch in the NEM even if they are not bound.
… What about constraints in the ‘West Murray’ area?
Since the release of the GSD2020, whilst I have been trying to find a few hours to complete this article I have seen a couple questions about the constraints that have so perturbed Semi Scheduled plant in the West Murray area . Note that this topic seems to mean different things to different people with:
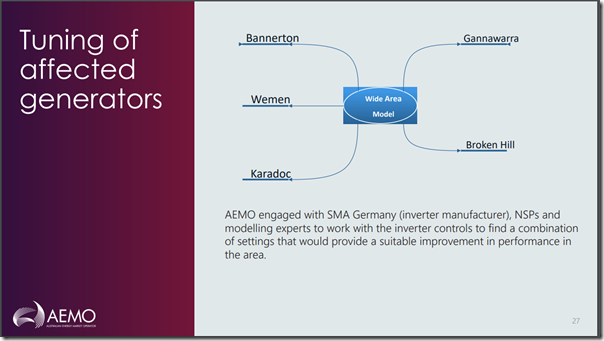
Meaning #1) Some people seeing this as pertaining ‘just’ to the 5 Solar Farms that AEMO spoke about on 24th April 2020 (i.e. Bannerton, Wemen, Karadoc, Gannawarra and Broken Hill Solar Farms) with respect to some specific limitations that were lifted in April 2020 after SMA inverters were tuned:
Incidentally, the way these particular limits were imposed seems to have been another case whereby (like with Lake Bonney 2 WF above) constraints can have an impact on dispatch in the NEM even if they are not bound.
Meaning #2) Whereas others (like me) see that particular drama as just one example of what will be more pain to continue for a growing number of non-synchronous units connected to ‘weak’ parts of the network … hence the discussions about whether the ‘Rhombus of Regret’ should be broadened to a ‘Polygon of Pain’ paradigm with the expansion of the danger area due to constraints like the ‘X5 constraint’.
So let’s look at two of the examples flagged in the AEMO Technical Forum presentation (Feb 2020) above – Broken Hill Solar Farm in NSW, and Bannerton Solar Farm in VIC:
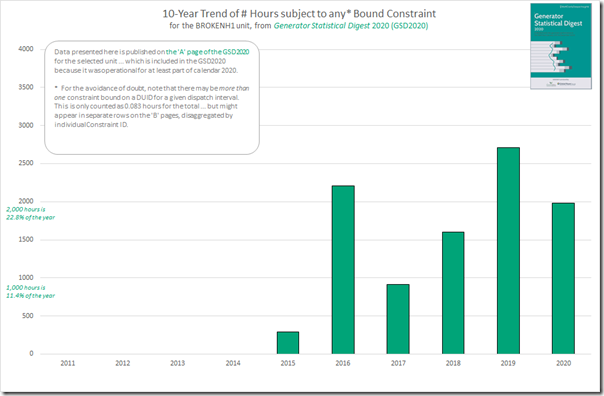
(D3d) AGL PARF’s BROKENH1 in western NSW
I noted above that the Brigalow (Maryrorough) Solar Farm had the ‘most frequently constrained’ experience in 2020 across all solar farms – but have chosen to highlight another unit below that also featured a high total in 2020 (at least in part because this unit has a few more years of history):
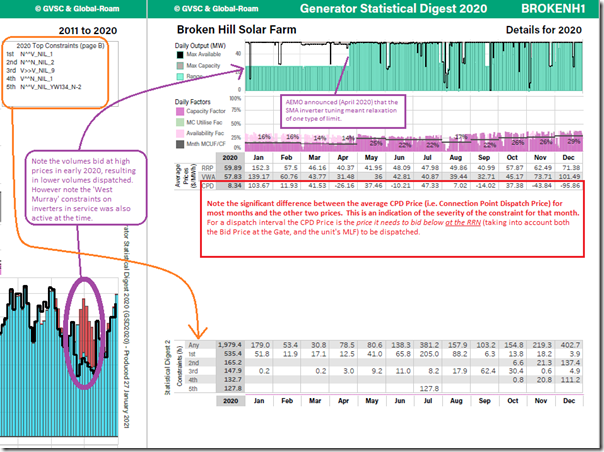
Above is the trend in annual incidence for the Broken Hill Solar Farm* in western NSW – and below is the extract of some of the data from the GSD2020 that can help to understand more of the situation:
* Incidentally, Broken Hill Solar Farm was one of the AGL-related assets commented on in some of the discussions that followed their big Impairment Announcement yesterday – but, to be clear was not one of the projects that were the source of the impairment.
In the image above, I have also included the trended bid stack chart for BROKENH1 from the ‘A Page’ in order to highlight the drop in production in early 2020 appears to be moreso due to bidding volume out of the market (for reasons I have not investigated) moreso than constraints.
However we know that this period (i.e. to late April) was when the other restrictions were in place, which leads me to wonder if the implementation of this particular constraint was one that basically required a restriction on numbers of inverter in service, rather than an aggregate limitation on output.
1) The Constraint Set twas ‘I-NIL_NW_SW_RISK‘.
2) It was a System Normal constraint set, until 21st April 2020 … which you will see from the chart above was when output was able to increase to Max Capacity.
3) The constraint set description was ‘System normal system strength. Limit SFs when 220kV lines in NW VIC and SW NSW at risk of tripping’
4) It contained 10 x Constraint Equation (i.e. 2 for each of the Solar Farms above). A pair constraint equations for each Solar Farm was used to manage output as follows:
4a) The first constraint equation (intended to incentivise the participant to reduce the number of inverters in service) was like, for Broken Hill Solar Farm above in ‘N_BKHSF_40INV’ Constraint Equation, to ‘Limit Broken Hill Solar Farm upper limit to 0 MW if number of inverter available exceed 40. Constraint swamp out otherwise’.
(i) When faced with such a choice, it was logical, therefore, for the generator to reduce the number of inverters in service
(ii) Key point, from the stats in the GSD2020, is that AEMO (via NEMDE) achieved its objective (i.e. fewer inverters = lower risk) without the constraint binding.
4b) With the number of inverters reduced, therefore (hence reducing overall output capability), the other constraint equation comes into play – which was ‘N_BROKENHSF_FLT_26’ for Broken Hill Solar Farm. This one was to ‘Limit Broken Hill Solar Farm upper limit to 26 MW to manage post contingent voltage oscillation’.
4c) So between the two constraints, a different outcome (in terms of MW profile) was achieved than just with one:
(i) The first constraint will have limited the rate of ramp up in the morning, and ramp down in the evening … and also delayed the time the Solar Farm will have hit the 26MW limit
(ii) Whereas the other one will have limited the output to 26MW.
I’m running out of time (and space – and your reader’s patience!) to delve deeper – but perhaps in a specific article, if this was of more interest?
(D3e) Foresight Group’s Bannerton Solar Farm (BANN1) in the West Murray ‘Rhombus of Regret’
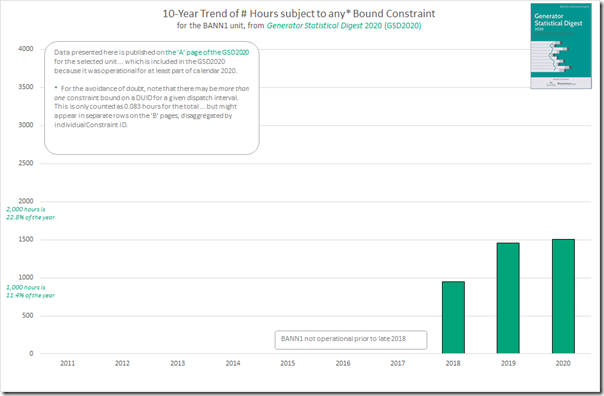
In addition to BROKENH1 above (which readers should note is another of the 5 shown here), i thought it would be useful to pull out some data on BANN1 which is located up in the North-West of Victoria, right up near the Murray River. Here’s the 10-year trend of constraints, noting that the plant only started operating late in 2018:
So we can see that the plant has had a rough start to life (which may well have been not predicted in advance in those infamous consultant’s reports?) with constraints being bound on the unit for roughly 17% of the whole year for 2019 and 2020.
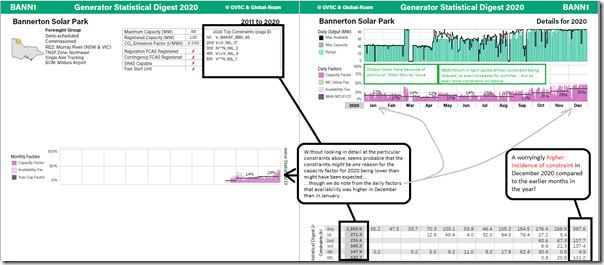
Snipping out some excerpts from both the ‘A’ page and the ‘B’ page from the GSD2020 for BANN1 we see that the incidence of constraint was highest in December 2020 than in the earlier months (but, at the same time, daily availability of the unit was also higher). This combination meant that the annual capacity factor for 2020 (at only 19%) was probably lower than might have been expected when the project was conceived…. which presumably makes the financial return for someone not as great as expected:
In the list of ‘Top 5’ constraint I see that our familiar friend (at least in the context of the discussion above) ‘N^^N_NIL_2’ makes an appearance again as 3rd on the listing… and was increasingly bound across October, November and December 2020 as a sign of (different) pain to come, perhaps?
In this particular chart (as with Broken Hill Solar Farm above) note that the output from January-April 2020 is suppressed, which I suspect is (at least in part) due to the same inverter limitation alluded to above for Broken Hill Solar Farm.
(E) A little beyond the GSD2020
That’s all I have time to cover today in this article (and it’s probably long enough for most readers in any case) … but I do want to flag that we have compiled other data about constraints that extends beyond just the GSD2020 and will look forward to discussing this in subsequent articles here on WattClarity.



Leave a comment