This article pertains to what we’ve labelled Event 3 on 25th May 2021.
In our first retrospective of the events (completed on 26th May) I’d wondered why (it seemed to me at the time) several things:
Q1) Why the constraints did not appear to bind in the 14:15 dispatch interval as I would have expected them to (i.e. as they were ‘System Normal’)?
… and
Q2) Why some solar farms were constrained down before others?
With the benefit of a bit more time, I’ve started to have a look and post this article as the first part of an exploration…
(A) Sequence of Solar & Wind DUIDs being ‘constrained down’
It turns out that the situation is not quite what I had seen it to be on Wednesday last week.
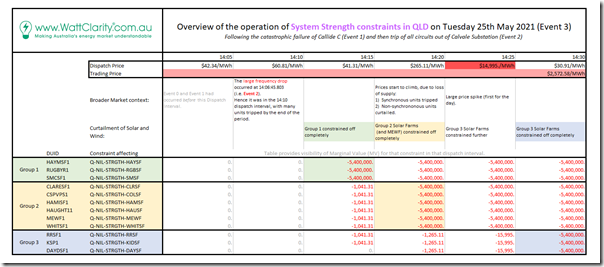
In the following table, I have summarised the sequence of events over the six dispatch intervals in the 14:30 trading period:
As we can see, there were three solar farms constrained off fully in the 14:15 dispatch interval (Group 1), with Group 2 (including the only wind farm in northern QLD) constrained off fully for 14:20 – and then a later Group 3 by 14:30.
This obviously leads to the ‘why the difference?’ question, which I’ll be exploring in the next article (will take more time, and a longer explanation).
Keeping in mind that the trading price for the half hour was $2,572.58/MWh, those 3 units in Group 3 did enjoy higher production across the half hour – relative to Group 1 (or Group 2) – and so a noticeable difference in revenues.
(B) Where are these 12 x DUIDs located
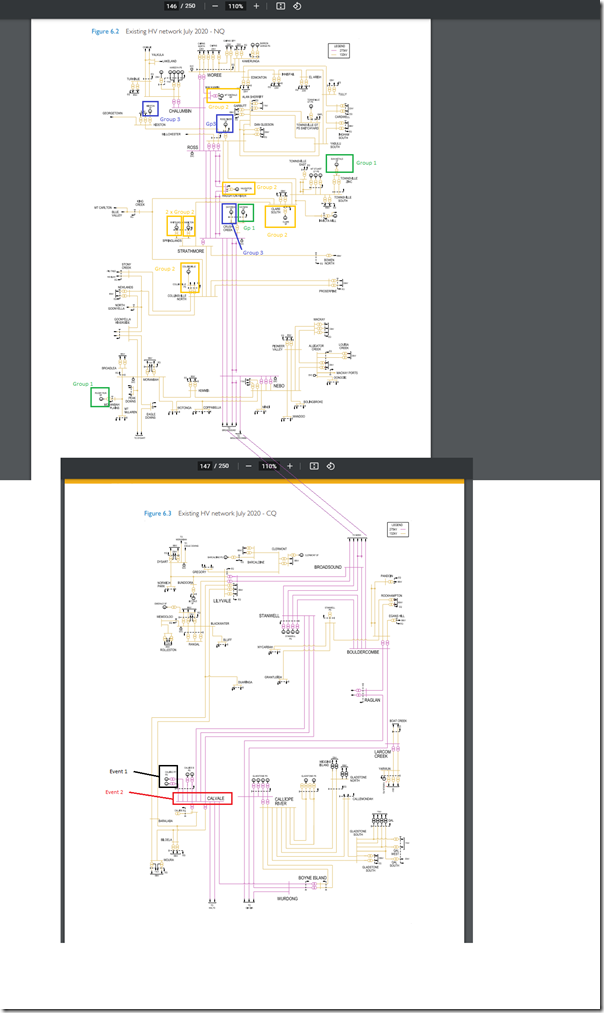
Useful to reach again for Powerlink’s Transmission Annual Planning Report 2020 and grab the images from pages 146 and 147 to illustrate the locations of the 3 groups:
Click on the image to open large size.
I have identified the 12 x Solar and Wind Farms affected on the top half of the image, and annotated them Group 1, Group 2 and Group 3 based on the table above. I’ve done this to help readers understand that the sequence in which they were constrained off does not seem to have been particularly due to their location in the network … other than that they were all in northern QLD (note this caveat from Nov 2018) and so all subject to system strength limitations.
I’ve also highlighted the Callide C power station ( Event 1 on 25th May 2021) and the Calvale substation (which was the focal point for the subsequent Event 2 on 25th May 2021). Remember that Allan also published this visual guide to Event 1 and Event 2 last Thursday.
(C) Similarities to 13th October 2020
For those who want some pre-reading to help understand the answers to these questions, Event 3 on 25th May 2021 has some similarities to what happened on 13th October 2020 as discussed in Case Study Part 5 ‘Why did those constraints bind’ … but also some important differences!
More to come in a subsequent article… but probably not today!


Leave a comment