It’s taken me longer than hoped to get to this part of the evolving Case Study, but (given the ongoing questions and discussions I have seen and heard elsewhere) I suspect it might still be useful. It might help to start by recapping on the various pieces so far:
| Tuesday 13th Oct 2020 (Case Study Part 1) |
The QLD dispatch price spiked to $15,000/MWh at 09:45 on Tuesday 13th October in conjunction with a significant loss of generation from a collection of 9 solar farms in northern Queensland and one in southern Queensland. On the day I’d posted this Case Study Part 1 with what was visible at the time. |
| Wednesday 14th Oct 2020 (Case Study Part 2) |
With the benefit of the information visible the next day in ez2view (i.e. after being published by AEMO at the 04:00 closure of the Tuesday Market Day) we were able to see that the output of all 9 x Solar Farms in northern Queensland were ‘constrained down’ due to a set of constraint equations in the constraint set ‘Q-BCNE_821’. The general sequence of events was described in this Case Study Part 2. |
| Saturday 17th October 2020 (Case Study Part 3) |
With a bit more breathing space, we were able to dig deeper to explore a sequence of events (on holistic level) what had happened earlier in that week, on Tuesday. This was described in this Case Study Part 3. |
| Thursday 22nd October 2020 (Case Study Part 4) |
It took us some days to find the time to piece together, but 9 days after the event we published this lengthy Case Study Part 4, that walked through most of the DUIDs operational across the Queensland region to explore ‘Who did What?’ through the period of the event. |
| Wednesday 28th Oct 2020 (Case Study Part 4b) |
Independent of our analysis, but assisted with our software tools, guest author Andrew Wilson prepared his own analysis of the event focusing on exploring the ‘Batteries vs Peaking Plant’ question. We were happy to be able to publish this on WattClarity as a form of Case Study Part4b. |
| Tuesday 3rd November 2020 (Case Study Part 5) |
Which brings us to Part 5 – this article – 3 weeks after the event. In this article, I’ve been quite keen to unpick why the constraints were of the form to trigger the rapid curtailment of a large amount of generation across 9 separate solar farm sites…. with a view to helping anticipate events that might be similar to these in future. |
| More for a Later Date? (Case Study Part 6, perhaps) |
Not currently sure if there is a need to continue exploring further, into Part 6. Happy to hear your suggestions?
|
So with those 5 articles linked above as context provided to the event, let’s delve into the underlying reason why the solar farms were constrained down – and hence why the price spiked … and why it was not forecast in advance.
(A) Why these Case Studies?
However before we do, it might be worth re-iterating that this is not the first Case Study we’ve prepared on WattClarity. Indeed, it’s a deliberate focus of what we do – taking interesting events and unpicking them (using our software like ez2view where we can) to see what we can see.
(A1) Stretching our (software) capabilities
Part of the reason I have invested so much time in this progressively developed Case Study is because these types of incidents are quite informative in helping us understand how our software can continue be improved, in order to make complex events more clearly and quickly understandable than they would otherwise be.
We’ve come a long way in the 10+ continuous years we’ve been investing a large amount of time and money into the ez2view software – but events like this help to remind us that we have a long way still left to go to ensure if delivers everything that we want it to.
Let us know if you know of others who can help us with that!
In this sense, what happened Tuesday 13th October (whilst quite complex and not completely visible in real time – not to mention expensive for some participants!), is proving a goldmine of information for us to wade through…
(A2) Of value to readers of WattClarity®
Keeping in mind that it’s the above objective that is the primary driver (so sometimes helps to shape the priorities we assign to different pieces of analysis we could pursue) we hope that the insights shared freely here on WattClarity will be of interest to our readers.
Please do feel free to point out where you think we have made mistakes, or misinterpretations. We really do want to hear from you!
(A3) Food for thought for ‘Deeper Insights’ Publications
On 31st May 2019 we released our Generator Report Card 2018 , developed in conjunction with GVSC and with the help of others, following an extensive period of preparation. That 530-page report was very well received across a broad swathe of the National Electricity Market, and many requests have been made for us to continue delivering value like this with periodic updates.
We’re contemplating a Generator Report Card 2020 update.
Hitting ‘pause’ on some other projects to allow enough time to prepare these Case Studies also helps us (including with reflection on the comments and feedback we receive) to think through areas worth deeper analysis and thinking in a focused way through something like the GRC2020.
(B) Why is some form of System Strength constraint required?
In this section, let’s think through the underlying electrical grid, and the reason why ‘System Strength’ is becoming increasingly spoken about.
(B1) What is System Strength?
Asking a mechanical engineer to (understand and) explain electrical engineering concepts is fraught with danger! However, it’s an inherent characteristic of AC electricity grids that is (obviously) having increasing impact on the operations of the market so – like many others – I’m striving to learn more about what it all means at a fundamental level.
In March 2020, the AEMO published this document helpfully titled ‘System strength in the NEM explained’ which starts in the introduction by noting ‘system strength is generally not well understood’, and then proceeds to reference the AEMC when it noted that (system strength) ‘relates to the size of the change in voltage following a fault or disturbance on the power system’.
The report written by GHD Advisory for ARENA, which is linked below regarding northern QLD, describes it as follows (p3/106):
‘System strength is a technical subject and an area in which Australia is on the bleeding edge of international experience. Generally, there is a limited understanding of the topic and it is often confused with other related power system issues such as inertia, adequacy and resilience’.
and follows with (p4/106):
‘System strength is a way of describing how resilient the voltage waveform is to disturbances.
If a transmission network location is said to be ‘strong’ in terms of system strength, the change in voltage at that location will be relatively unaffected by a nearby disturbance. However if a location is said to be ‘weak’ in system strength the voltage at the that location will be relatively sensitive to a system disturbance, resulting in a voltage dip that is deeper and more widespread.
Having pliable voltage waveform is a precondition in which other problems are more likely to emerge. This includes longstanding issues such as power quality and voltage instability, and emerging issues such as unstable interactions between inverter-based generators.
… conventional forms of generation … inherently respond to voltage disturbances on the power system in a manner which resists the disturbance and limits of its size, thereby automatically helping to stabilise network voltages arising from a network disturbance.’
So, without needing to understand the gory details, most people can probably understand the following:
Key Point #1) more System Strength is a good thing for resilience in the grid – the greater the System Strength, the smaller the Voltage fluctuation following a fault or disturbance:
In a similar way, the greater the level of Inertia in the grid, the smaller the Rate of Change of Frequency following what might be the same disturbance (in both cases, the greater the capability of the grid to successfully withstand faults or disturbances without cascading failures).
System Strength is not the same as inertia, but it just so happens that the older synchronous units that have supplied inertia in the grid over prior decades have also been providing system strength as well.
Key Point #2) As the older synchronous plant exit the grid, new approaches need to be established to deliver what was once supplied ‘for free’.
Key Point #3) With reference to Stephen Wilson’s timescales diagram, System Strength speaks to issues of very small time time-steps.
#3a) These time-steps are so small (practically instantaneous) that it’s not possible to increase system strength after a disturbance to prevent cascading problems in the grid.
#3b) The system strength needs to be there beforehand.
Key Point #4) Remembering how Probability and Consequence combine to determine the level of Risk we face at any particular time:
#4a) It’s important to recognise that just because a grid suffers from low system strength (or inertia) it does not automatically mean that the lights will go out … as the System Strength protects in the event of a disturbance. That disturbance might not happen.
#4b) Conversely, just because the lights have not gone out over some period of time does not mean that the level of Risk was acceptable (i.e. because the level of System Strength or Inertia were too low).
(i) It might have been that we just ‘got lucky’ by not experiencing the type of disturbance that would trigger catastrophe.
(ii) See, for instance, the (retrospectively calculated) level of monthly level of inertia in the South Australian grid being consistently below what the AEMO determined as their Minimum Operating Limit following from the SA System Black. Calculation excerpt from the GRC2018.
#4c) To state this another way, be quite careful in drawing conclusions from specific headline events marking high penetration of non-synchronous plant.
(i) Whilst it might have been on that occasion that everything ran well, it might only be after the fact that the relevant bodies (AEMO, or the TNSPs or others) determine that the system was actually operating in a less resilient state than we (belatedly) realise was wise.
(ii) As an example of this, witness what happened belatedly in the ‘rhombus of regret’ in western VIC – or in the constraint equations belatedly added to three particular non-synchronous plant in northern Queensland (Mt Emerald WF, Sun Metals SF and Haughton SF).
Key Point #5) Unfortunately, what this means is that we need to rely heavily to sophisticated software models driven by engineers to determine what the level of risk actually is (across a range of simulated plausible scenarios), as what we observe unfold in real time might be deceptively placid.
—
System Strength was just one of the ‘Keeping the Lights on Services’ we envisaged when we wrote about them in the Generator Report Card 2018 (in Theme 5 within Part 2 of the 180-page analytical component). We did this when we explored the emerging schism between those who have traditionally provided a fuller suite of services and those who’ve been incentivised (wrongly, perhaps?) to focus to more exclusively just on ‘Anytime/Anywhere Energy’.
There are a number of implications of this schism that are still to be worked through in this ongoing energy transition.
All of this is one of the more complex areas of operating in the National Electricity Market – and one of the areas that’s received scant attention until recently in charting this energy transition.
(B1a) AEMO & CIGRE System Strength workshop this Friday
Worth noting this workshop session:
this Fri 6th Nov (09:00-15:30 NEM time (UTC+10)) = AEMO & CIGRE System Strength Workshop
Coincidentally, the AEMO and CIGRE Australia’s Technical Panels announced a virtual workshop exploring Australia’s experience in managing the ‘system strength’ implications from a power system in rapid transition. The seminar will take place 10am to 4:30pm AEDT this Friday 6th November via WebEx.
The workshop builds on learnings from an internationally focused system strength workshop organised by Australian CIGRE members at the CIGRE 2020 e-Session held in August 2020. This session will include speakers from AEMO, market institutions, transmission and distribution networks, the generation sector, equipment manufacturers and power system advisors, who will provide a holistic picture of system strength and related issues.
Registration is FREE and open to all. Further information:
1) Is in this brochure on the CIGRE website; and
2) The brochure contains this link, to register your attendance.
It’s 6 hours long, via WebEx, but will be recorded for later revisiting for those who attend.
.
I’ll be listening in with interest on this workshop this Friday.
(B1b) Materials from the AEMC
The material compiled by AEMC (EPR0076) as part of its ‘Investigation into system strength frameworks in the NEM’, completed 15th October 2020, could also be of value. Particularly the 167-page final report.
(B1c) Materials from GHD Advisory for ARENA
Readers might also find this May 2020 report from GHD Advisory for ARENA ‘Managing system strength during the transition to renewables’ of use in understanding below.
(B2) Why is there a requirement in northern Queensland?
In our article from November 2018 we can see one warning about the level of risk increasing for owners and operators of non-synchronous plant in northern Queensland (which I saw as everything north of Rockhampton).
What unfolded in the week including Tuesday 13th October 2020 was just one manifestation of this risk – I would expect to see more manifestations in the months ahead though they might manifest in different ways.
Readers need to understand that the key difference between the northern QLD arrangements for System Strength and those used in South Australia are that the synchronous units seen to provide system strength in northern Queensland are not actually in northern Queensland (apart from the Kareeya hydro plant).
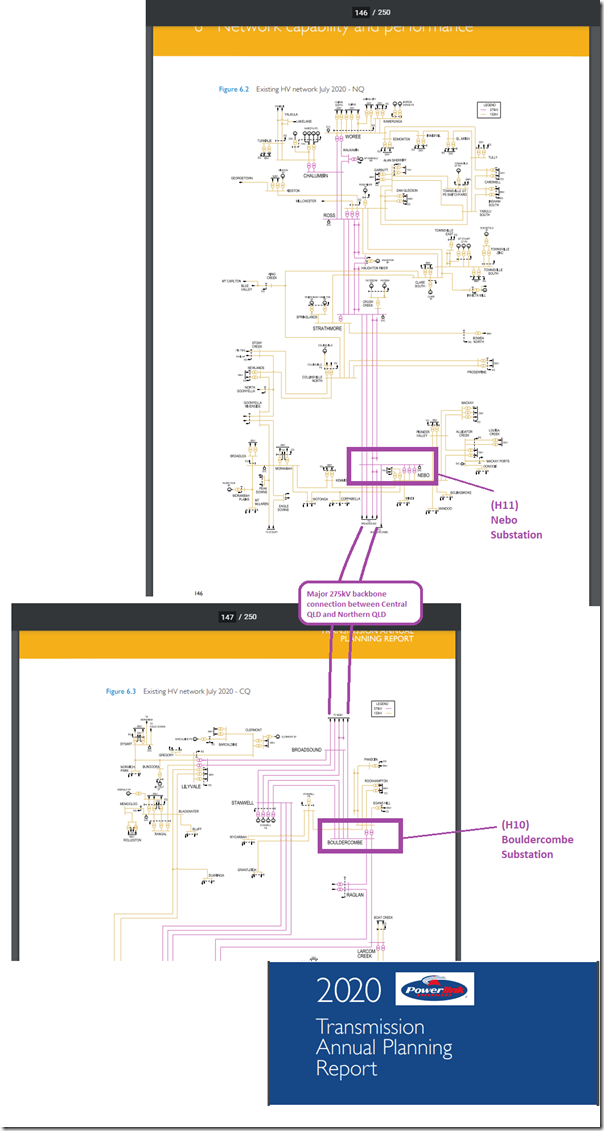
The 14 big units watched for evaluating the RHS on the particular constraint equations (Stanwell, Callide B and Callide C, Gladstone) are all located in central Queensland, which means that transfer capacity from central Queensland to northern Queensland is critical….
It’s been explained to me that the Qld system strength issues are around control system interactions and oscillations, not so much fault level or short-circuit ratio (SCR).
(B3) Why did the transmission outage make this more severe?
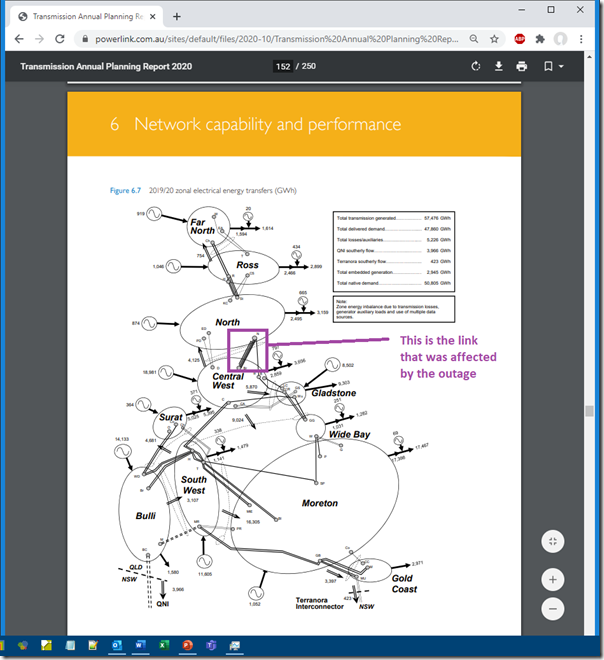
… and it was this transfer capacity that was more limited (via the constraint set ‘Q-BCNE_821’) to reflect the outage of line 821 (a 275kV backbone) – between H10 Bouldercombe (i.e. near Rocky in Central-West Zone) and H11 Nebo (i.e. near Mackay in North Zone). Some readers might understand the significance of this when viewing these two pages from Powerlink’s 2020 Annual Planning Report:
(Click on these images here to open a larger view)
Or, alternatively, here’s more of a geographical-zonal view:
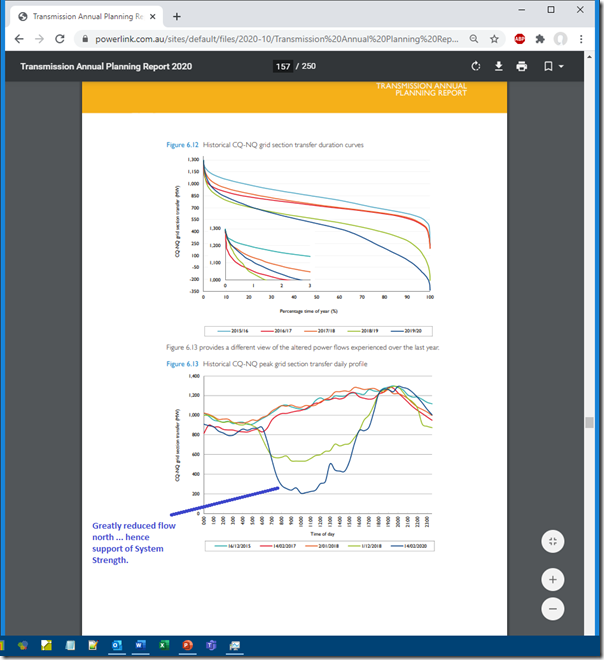
… and a few pages on in the APR, Powerlink provide these charts that illustrate the underlying challenge of ‘rooftop solar making it more difficult for Large-Scale solar to exist’:
We now know that this outage ran from 07:05 dispatch interval on Tuesday 6th October through until 15:45 on Friday 16th October. Over this time-range, the morning of Tuesday 13th October was not the only period in which the constraint equation had the effect of constraining the 12 x Semi-Scheduled plant (11 x Solar Farms and 1 x Wind Farm) down to 0MW – though it was the only time this happened with such a flourish, popping the price to the $15,000/MWh Market Price Cap.
Understanding that the benefit of the system strength supplied by these units needed to be transferred ~300km north from Rockhampton, the outage of one of the lanes on the highway north made the situation more complex… so additional (and stronger) constraint equations were invoked through the constraint set ‘Q-BCNE_821’ for the duration of the outage.
(B4) Other initiatives that might alleviate this … in future
For now, Powerlink and AEMO need to deal with the ‘lay of the land’ as it currently exists.
Directly related to broader challenge of system strength in northern Queensland, for instance, was Powerlink’s announcement on 7th October that it ‘… secures Australian-first system strength support model’.
That article was tagged into our expanding Asset Catalog under the new Synchronous Condenser asset (other references to the asset have also been tagged in there, as well).
That’s one option through which local support of system strength could be achieved.
There was also an Expression of Interest published by Powerlink on 9th April 2020 for non-network solutions to address fault level shortfalls with publication of decision expected by 31 December 2020 (under 2 months away now).
(C) About the specific form of the constraint that bound on 13th October
(C1) Constraint Equations and Constraint Sets
It’s important for readers to understand that the electricity grid that supports the Australian National Electricity Market is a very complex interconnected piece of electrical and mechanical machinery that stretches thousands of kilometres. This is governed by complex sets of engineering principles … of things such as System Strength above.
However , it is just as important to understand that (in the dispatch time horizon, at least, remembering Stephen Wilson’s timescales diagram) the National Electricity Market is actually more correctly viewed as a complex mathematical model represented in the ‘NEMDE’ Dispatch Engine. What happened on Tuesday 13th October is best understood by the maths that was at work … particularly in relation to how there was a different outcome on Friday 16th October despite there being similar underlying grid conditions …. because the form of the maths had changed.
(C1a) NEMDE and the Objective Function
For each individual dispatch interval, NEMDE tries to find the ‘least cost’ approach to supplying what AEMO sees as the assumed level of demand to meet at the end of that dispatch interval and supply the relevant FCAS services … by using generator offers (called ‘bids’ in NEM lingo) as a proxy for input costs.
Progressively over time we’ve been building up materials in WattClarity® to explain how dispatch works, and how prices are set in the NEM via the Glossary. You might find them useful.
(C1b) Constraints on possible solution sets
In resolving the ‘least cost’ resolution of the ‘Objective Function’ that NEMDE tries to solve for, the job for NEMDE is necessarily made more difficult by imposing boundaries on the possible solutions to take account of the diverse range of network (and other) limitations that always act in different ways on the ‘long skinny’ nature of the national electricity grid.
The ez2view software makes it easier to understand which constraints are being used at any given point in time, from a library that the AEMO has assembled of 1,000s of possible Constraint Equations:
1) The ‘Dispatch Constraints’ Widget looks at just those constraint equations invoked (i.e. fancy AEMO term for ‘used’) in the current Dispatch Interval; whereas
2) The ‘Constraints Equations’ Widget also looks forward into predispatch to see what’s currently forecast to be invoked in the P30 predispatch time horizon:
(a) This widget will typically show between 600 and 1,000 constraint equations being used by AEMO at any given point in time (during ‘outage season’ there are more being used).
(b) On 13th October at 09:45 there were 1,032 constraint equations invoked, or forecast to be invoked in predispatch (i.e. one of the busier times in the NEM, not just in northern Queensland).
(C1c) The form of Constraint Equations
In most occasions (with FCAS constraints being a notable exception, but not the only one) the form of the constraint is as follows:
LHS ≤ RHS
… where the Left-Hand Side (LHS) contains all the terms that NEMDE tries to influence in the co-optimisation process assembled in a linear equation, such as:
LHS = Factor1 x Var1 + Factor2 x Var2 + … FactorN x VarN
… and the Var1, Var2 … VarN are DUIDs and interconnector elements that NEMDE gives Dispatch Targets to.
Whereas the Right-Hand Side (RHS) reflects the things that generally NEMDE can’t control, but essentially treats as an constant for the given dispatch interval.
(C1d) Constraints in Constraint Sets
All Constraint Equations are invoked (i.e. fancy AEMO term for ‘used’) in Constraint Sets:
1) Because of the mis-match between the need for constraint equations to be of linear form and the complex realities of the electricity grid
2) Because underlying network conditions (or a change such as removing a flow path) can impose multiple different limitations on dispatch, so each set of constraints essentially represents a related group of limitations jointly imposed by a given network configuration in some part of the NEM.
3) Because it also greatly simplifies AEMO’s task in managing outage-related changes in constraints (i.e. it’s ‘just’ a constraint set that needs to be invoked to address limitations imposed by an outage).
This was the case on Tuesday 13th October, with the ‘Q-BCNE_821’ Constraint Set used to reflect outage of line 821 (i.e. the 275kV feeder from H10 Bouldercombe (i.e. near Rocky in Central-West) to H11 Nebo (i.e. near Mackay in North).
This Constraint Set had 14 Constraint Equations as members of the Set:
1) 12 of the constraints act to limit individual semi-scheduled plant:
(a) They share a common structure outlined below;
(b) There are some non-trivial variations for 3 of the units/constraints (for MEWF1, SMCSF1 and HAUGHT11) … which was not so material at the start of the curtailment, but was moreso at the end (around 12:25, as discussed below).
2) 2 of the constraints act to increase scheduled generation:
(a) The ‘Q^CN_FDR-030’ equation sought to increase the output of synchronous units in northern Queensland (Barron Gorge, Kareeya, Mt Stuart, Yabulu and Mackay GT) to protect against trip of one H29 Stanwell to H20 Broadsound (856 or 8831) 275kV line;
(b) The ‘Q^CN_GT-090’ equation sought to increase the output of 4 stations (Barron Gorge, Kareeya, Mt Stuart and Mackay GT) to protect in the case of trip of the Yabulu GTs.
… however neither had been effective in achieving output, to 09:40, from any of these units
… Out of interest, both of these constraints were of the form LHS ≥ RHS in this case.
(C2) The form of the Right-Hand Side (RHS)?
Inside of our ez2view software there is visibility of the Right-Hand Side (RHS) of a chosen constraint equation that applies at this particular dispatch interval.
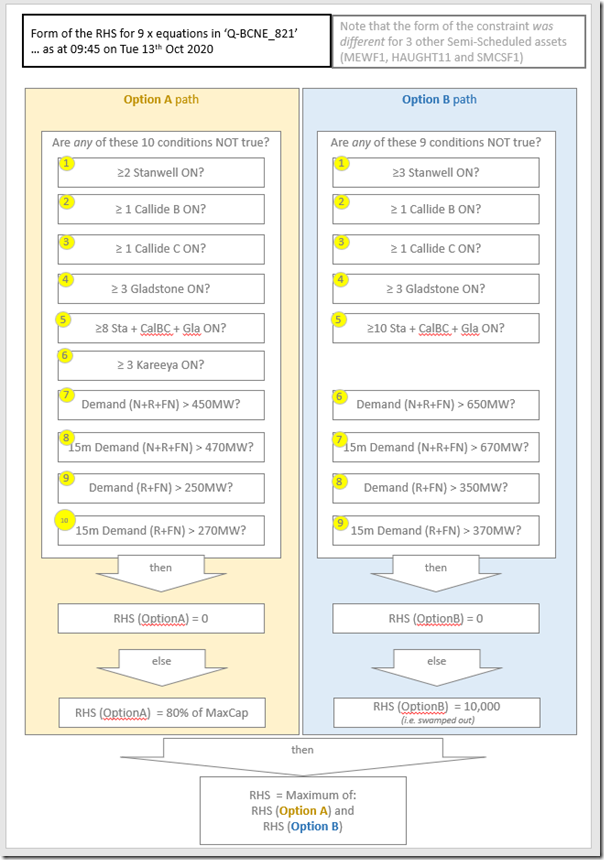
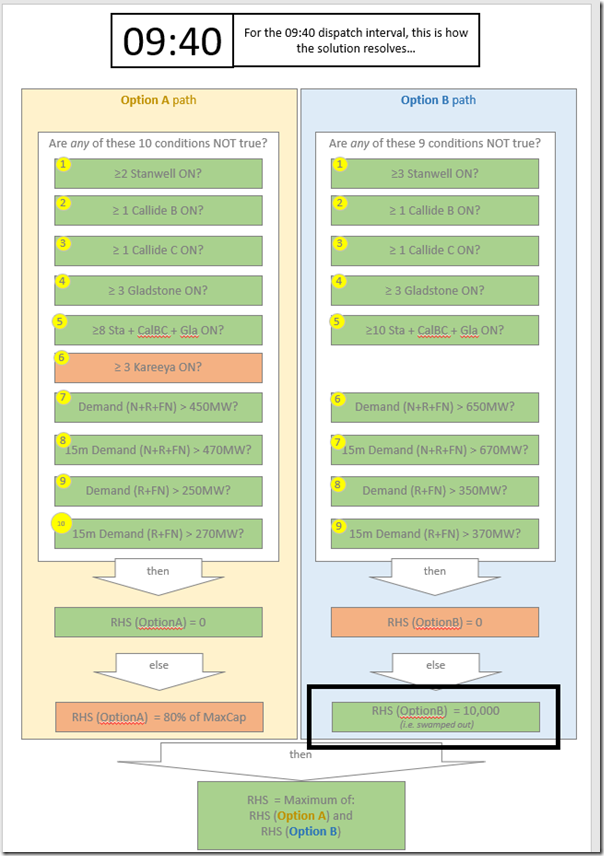
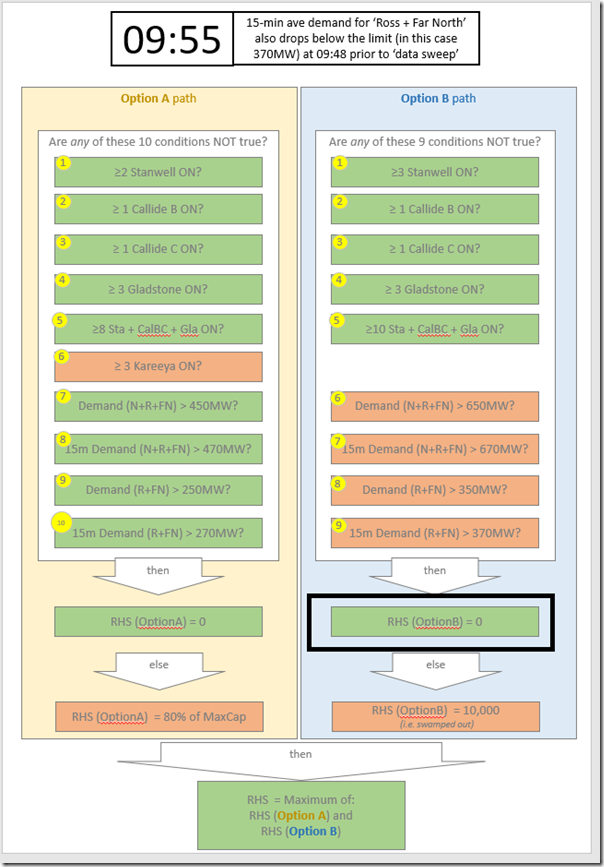
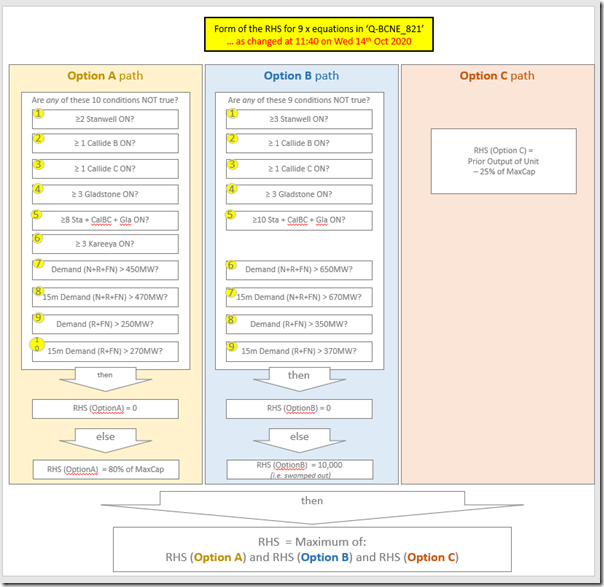
Always on the look-out for better ways of representing things (do you know of people who can help us?), I’ve taken the time to sketch up this basic logic model – which reflects the steps used to evaluate the RHS of each of the 12 x constraint equations applying through the period of the outage … one for each of the 12 x Semi-Scheduled plant affected:
Note that there is one particular point of input I’ve omitted (to do with MVAR output) as it was not material to what was happening through this day, and I ran out of space in the diagram. First thing to highlight is that there are two Option Paths involved in determining the RHS value, which is something that does not frequently occur (at least in the Right Hand Sides I have specifically looked at). This made the need for a diagram like the above more necessary, as it was the source of confusion that (I believe) tripped up some others in trying to understand what went on.
We see that the evaluation logic was very similar with both Options with the key difference being:
Option Path A) includes Kareeya units as a check, and (presumably on the basis of the System Strength support supplied locally by those units) a lower criteria for demand in northern QLD, giving less headroom for support from central QLD to northern QLD.
Option Path B) excludes Kareeya, but lifts the demand threshold for northern QLD … presumably to allow more energy supply in from central QLD and so more support for system strength in that way.
(C3) How the RHS Evaluated for each dispatch interval?
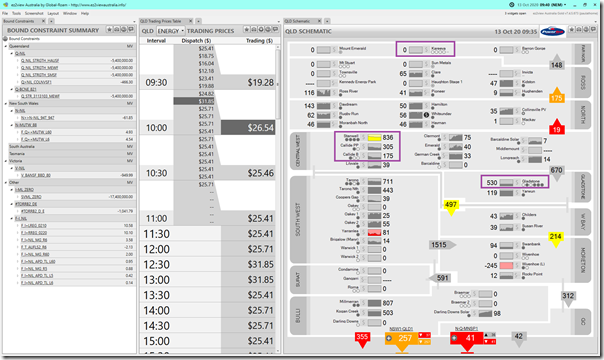
I’ve included a snapshot of the ‘QLD Schematic’ widget from the 09:40 dispatch interval, with 5 stations highlighted where they are the ones referenced in the RHS evaluation above.
Remember that the ‘dots’ signify DUIDs (or units) and that they are coloured if the units is running – hence we can see clearly that the Kareeya units are offline, as is one at Callide C, one at Callide B (A4 is also offline – AEMO allocates this to the Callide B station unhelpfully at present) and that there are two units out at Gladstone.
(C3a) The 09:40 dispatch interval
Using the ez2view snapshot above, we can see that the 09:40 interval was that the RHS resolved as follows:
As such, the RHS value evaluates as 10,000MW.
Each of the 12 x Semi-Scheduled units (each of which are given the same RHS) can produce as much as the sun and wind allows in relation to this particular constraint … though three (MEWF1, SMSF1, HAUGHT1) are already ‘constrained down’ to 0MW through their other System Strength constraints in the ‘Q-NIL’ system normal constraint set.
(C3b) The 09:45 dispatch interval
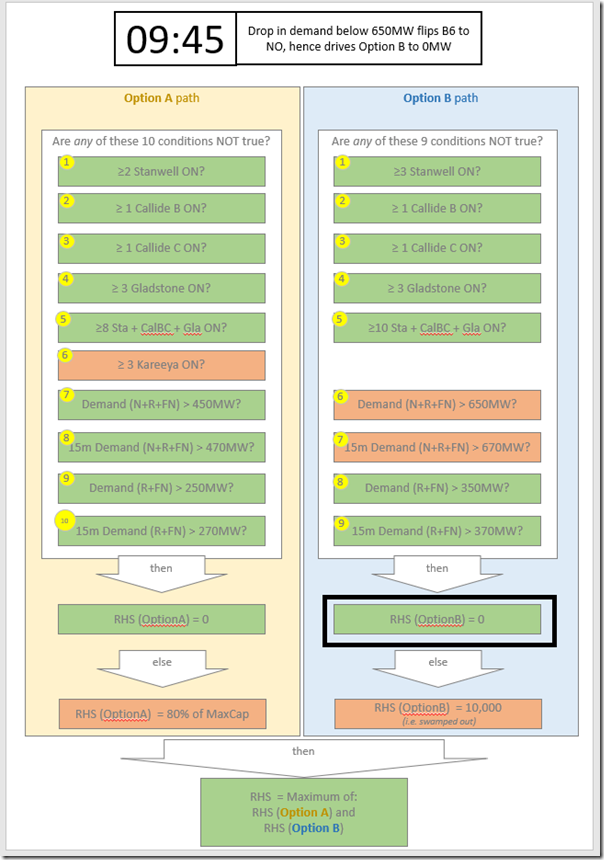
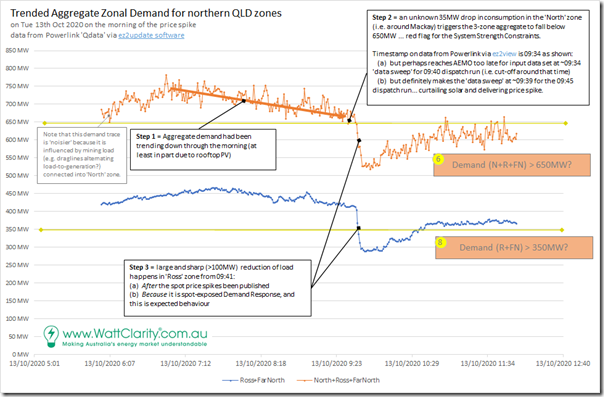
The synchronous units did not change in status at the time of the ‘data sweep’ (around 09:39) for the dispatch run producing prices for the 09:45 dispatch interval. However what did change was the reduction in demand in the ‘North’ zone (i.e. around the Mackay area), as noted in Part 2 of the Case Study. I’ve not learnt any more about the possible cause of this change but, as can be seen in the trend chart below:
(i) The consumption in that zone is ‘noisy’ as a result of the inclusion of mining demand served from that zone; and
(ii) The aggregate demand had already reduced almost 100MW through the morning as a result (at least in part) to solar PV eating away at the grid demand … hence putting Large Solar at risk.
… as such, it was not really a surprise to see the demand fall below the 650MW trigger level set in the constraint equations:
As noted already in Part 2 of the Case Study, evaluation criteria B6 flipped from ‘YES’ to ‘NO’ at 09:34 by the metered time we have on the Powerlink data … just too late for the 09:40 dispatch run. Closer review now also sees that evaluation criteria B7 also flipped from ‘YES’ to ‘NO’ as the 15-minute average demand also dropped below the threshold, this time at 09:37.
As a result, the RHS was reset from 10,000MW down to 0MW … which represented a ‘hard stop’ on the capability of those 9 Solar Farms still operating.
(C3c) The 09:50 dispatch interval
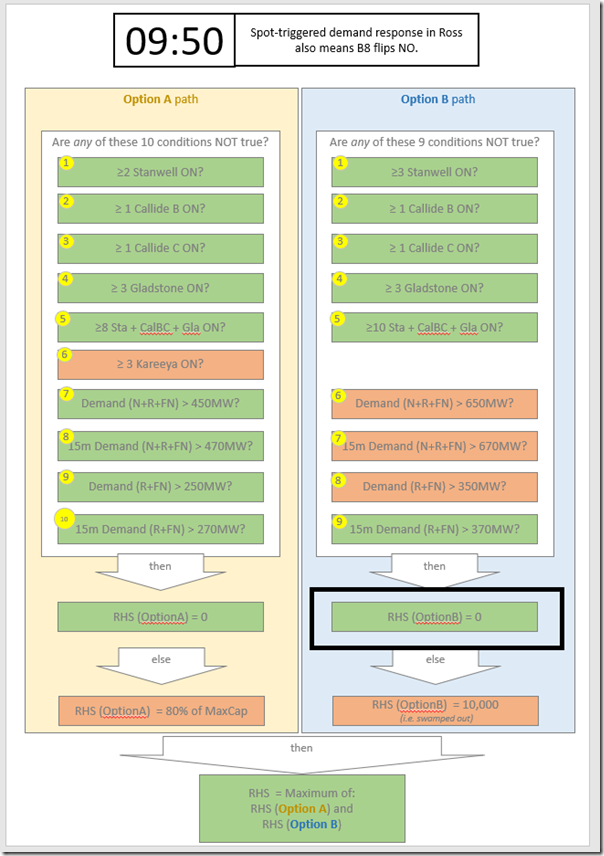
By the time of the ‘data sweep’ for the 09:50 dispatch interval (i.e. around 09:44) the demand in the Ross zone had fallen significantly, meaning that evaluation criteria B8 also flipped from ‘YES’ to ‘NO’:
This particular drop in consumption was as a result of automatically-triggered Demand Response curtailment of consumption at at least one (maybe more) large spot-exposed energy user of the type that we have helped facilitate for as long as 15 years in some cases.
This change made it even less likely that the 9 curtailed solar farms would be able to start back up again.
(C3d) The 09:55 dispatch interval
By the time of the ‘data sweep’ for the 09:55 dispatch interval (i.e. around 09:49) the 15-minute rolling average demand in the Ross zone had also fallen significantly, meaning that evaluation criteria B9 also flipped from ‘YES’ to ‘NO’:
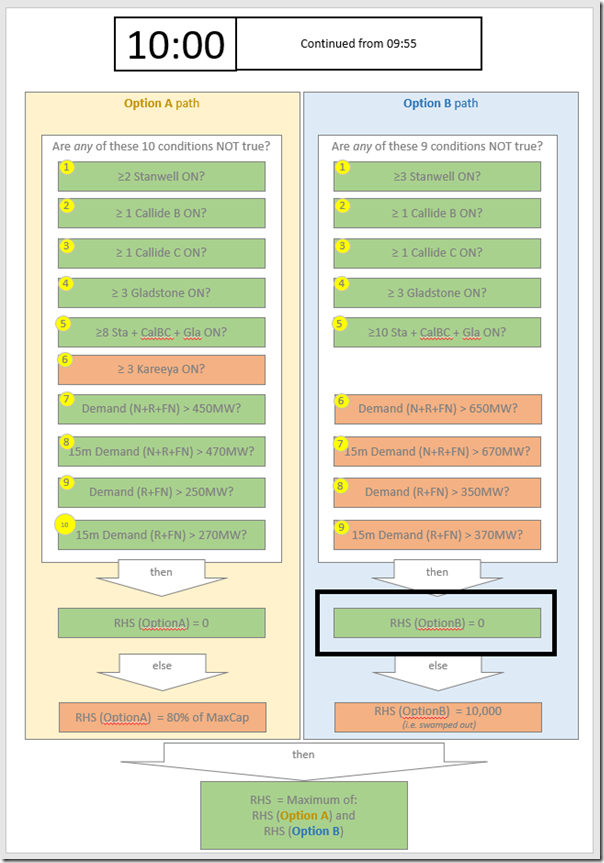
This made it now four criteria, all separately setting the RHS to 0MW, and hence ‘constraining off’ the 9 separate Solar Farms.
(C3e) The 10:00 dispatch interval
This situation continued into the 10:00 dispatch interval:
(C3f) Trended demand over time
The demand data was presented in tabular form in Part 2 of the Case Study already, but I thought it would be useful to include in this chart spanning 06:00 to 12:00 on the day:
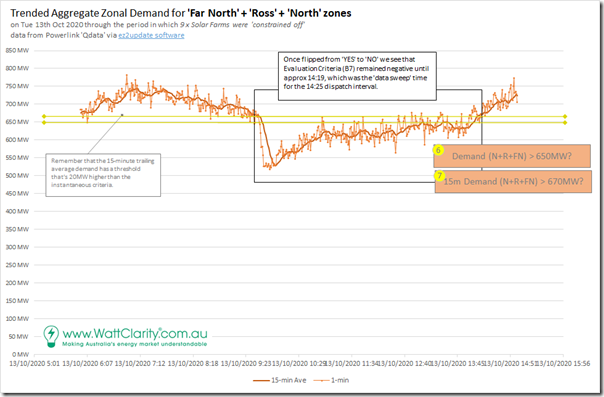
With reference to the evaluation matrix above, I’ve noted the progression in demand through the three steps above. We can see that the aggregate demand trend for ‘Far North’ + ‘Ross’ + ‘North’ zones remained below the 650MW threshold out till at least 12:00, showing why the Solar Farms remained off for the morning – and indeed until around the 14:25 dispatch interval, when evaluation criteria B6 and B7 had finally reset back to ‘YES’ with the ‘data sweep’ leading into the 14:25 dispatch interval:
Aggregate demand for ‘Far North’ + ‘Ross’ had reverted to above its own (350MW) threshold sooner … but evaluation criteria B6 and B7 were enough to keep the solar farms on the ground until the 14:25 dispatch interval.
(C3g) Solar Ramping up in the 14:25 dispatch interval
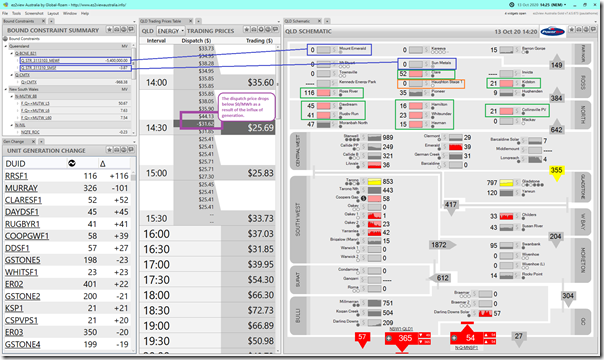
In this snapshot from 14:25, we see a significant collective increase in output across these 9 x Solar Farms:
In particular, it’s worth highlighting a couple things here:
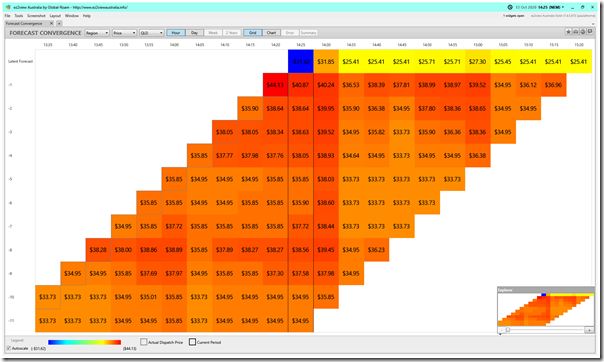
14:25 observation #1) The price drop was unexpected
The ‘Forecast Convergence’ widget shows that the price drop was not forecast immediately before in P5 minute forecasts:
Without looking further, I suspect that is because the unbinding of the constraints (due to the LHS returning to the 10,000MW ‘swamping’ mark) was not forecast in advance, because the 15-min average demand for ‘Far North’ + ‘Ross’ + ‘North’ was not forecast to rise back above 670MW.
Note that I have not looked at the specific form of these constraints in P5 predispatch. This analysis is long enough already!
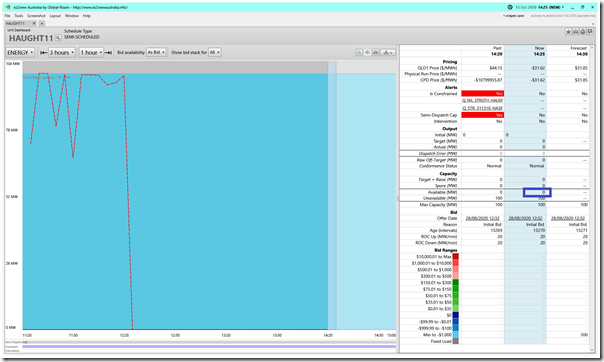
14:25 observation #2) Haughton Solar Farm remained offline
Both system strength constraints on Haughton Solar Farm had lifted, as we see in the Unit Dashboard widget here:
However, for unknown reasons ASEFS (or the Self-Forecast) for the Solar Farm had produced an Availability figure of 0MW, which means that it could not get off the ground.
The form of the RHS for HAUGHT11 was different from the 9 above, and from the other 2 below, in that:
(i) no Evaluation Option Path A.
(ii) Instead of the swamping term in Option Path B (i.e. 10,000) the value was only 25.001MW (or 25% of Maximum Capacity).
… there might have been other differences I missed (and I have not invested time to understand why the differences in the first place).
14:25 observation #3) The Mt Emerald Wind Farm remained constrained (strongly)
We see that the ‘Q_STR_3113103_MEWF’ constraint equation remained bound with a very high Marginal Value (i.e. MV = –5,400,000) – meaning that the plant was significantly still bound.
On inspecting the RHS of this particular constraint equation, we see that it has a different form than that modelled for the 9 x Solar Farms above:
(i) In a reversal of HAUGHT11, in this case there is no Evaluation Option B.
(ii) In other words, 3 x Kareeya units must be running for MEWF to be allowed to generate (which was not happening on this day).
14:25 observation #4) The Sun Metals Solar Farm remained constrained (slightly)
We see that the ‘Q_STR_311310_SMSF’ constraint equation remained bound but with a more modest Marginal Value (i.e. MV = –3.87) – meaning that the plant was significantly still bound.
On inspecting the RHS of this particular constraint equation, we see that it also has a different form than that modelled above for the 9 x Solar Farm:
(i) Like for HAUGHT11, there is no Evaluation Option Path A.
(ii) Instead of the swamping term in Option Path B (i.e. 10,000) the value was only 26.001MW (or 25% of Maximum Capacity).
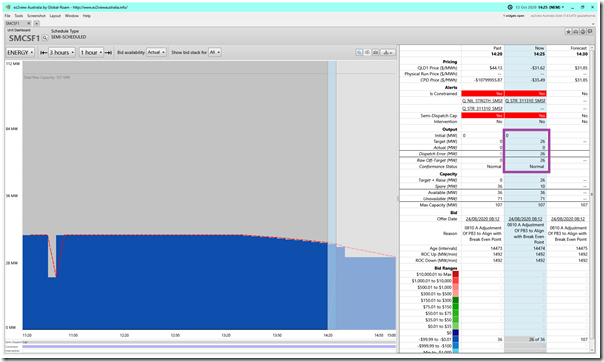
By this equation, the solar farm was allowed to ramp up and was set an output target of 28MW at the same time as ‘Q_STR_311310_SMSF’ being slightly bound. However, as seen in the ‘Unit Dashboard’ widget from ez2view below, the unit was unable to meet its target for reasons that have not been explored:
Hence the ‘Raw Off-Target’ being evaluated as 28MW at the end of the 12:25 Dispatch Interval.
(D) How these particular constraints have been improved since the 13th October
The price spike occurred on the morning of Tuesday 13th October, after which I posted Part1.
(D1) Criticism of the hard ramping of the constraint
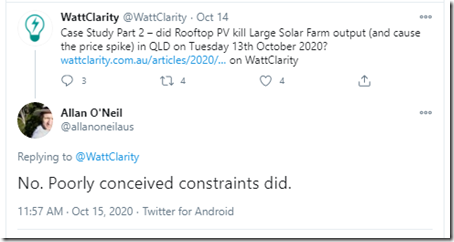
The publication of the ‘next day public’ data set enabled me to post the question ‘did Rooftop PV kill Large Solar Farm output (and cause the price spike) in QLD on Tuesday 13th October 2020?’ as Part 2 in the Case Study. Valued guest author, Allan O’Neil, quickly replied to highlight the hard ramping of the constraints as the culprit:
This was also the point made by others, as the picture became clearer. See, for instance, some of the comments accumulated on this LinkedIn note about Case Study Part 2 from Wednesday 14th October (i.e. the first part published with the benefit of ‘next day’ data – which revealed that 9 x solar farms had been ‘constrained down’ rather dramatically all at the same time when the constraints bit hard).
For instance, Dave Smith noted:
‘If correct (and it sounds plausible) this seems like poor constraint formulation. Rather than the FNQ solar farms suddenly going from unconstrained to shut down, as local demand falls below a threshold, couldn’t a ‘softer’ formulation be used, where the constraint is brought in gradually with falling demand? If I was paying that $14,000/MWh, I would be pretty annoyed about this apparent ineptitude.’
Nick Morley commented:
‘Wow – if you are correct Paul McArdle (and I see nothing to argue with in what you wrote) this is a clear indication that the current system strength constraint equations are leading to some VERY inefficient market outcomes.
The near-term solution appears to be to progressively and proportionally implement the constraint on the solar farms as others on this thread have suggested. Hard to see how this kind of special protection scheme won’t result in other issues in future if it’s set up so bluntly.
Longer term:
– distributed control regulations for rooftop PV like those just implemented in SA need to be made national, and soon.
– reform on provision of system strength services via a market or central planning.
– a plan to coordinate load (not just generation and transmission) to help manage and take advantage of minimum demand. Nodal pricing and demand response can help with this but I don’t think it’s enough on its own to get investment in appropriate industries and locations moving .’
My understanding is that this issue had been raised by others with the AEMO … not just in relation to these constraints, but also with others as well.
(D2) AEMO responded the next day
Following from the price spike on Tuesday 13th October, the AEMO adjusted the form of the RHS in changes that took effect the next day (i.e. in the 11:40 dispatch interval on Wed 14th October). These changes applied to all 9 x Solar Farms, and included a requirement to ramp down to 0MW over a maximum of 4 x Dispatch Intervals:
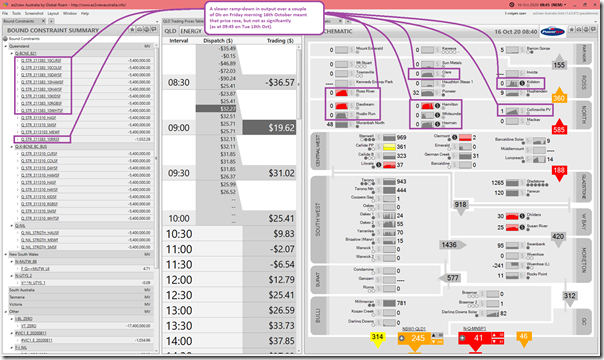
As noted in the illustration above, the slower ramping was achieved by adding into the mathematical formulation of the RHS of these 9 x constraint equations a third leg in the MAX () function…. one that simply reduced the output by at most 25% of the Maximum Capacity in each dispatch interval. This change took effect from 11:40 on Wednesday 14th October – but I have included an ez2view snapshot from 08:45 on Friday morning 16th October here to illustrate the (smaller price effect) of the slower ramp:
(D3) A brief look at the Δ Target over the outage period
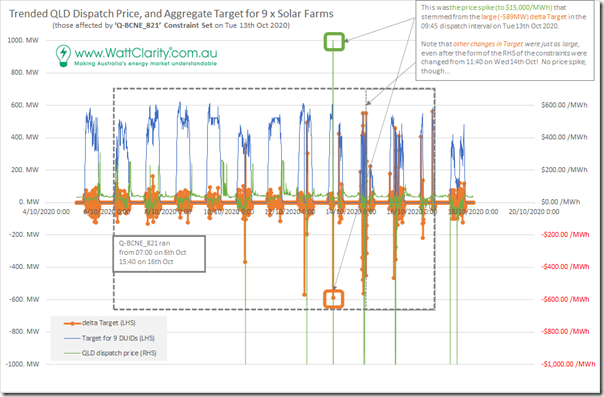
Out of curiosity, I assembled this trended view of the ‘Δ Target’ value (comparing the difference between aggregate Target from one Dispatch Interval to the Next, across those 9 x Solar Farms), and trended at the same time as Dispatch Price:
We can clearly see the large drop in aggregate Target (-589MW) for the 09:45 dispatch interval on Tuesday 13th October.
However, we can also see large ‘Δ Target’ values at other times … both increases in aggregate Target and reductions in aggregate Target – these did not coincide with any price spike anywhere near as great as the Tuesday event. However I have briefly listed them below in order that (time, and inclination, permitting) we might come back to look at them at a later date:
(D3a) Monday 5th October 2020
The network outage had not yet commenced on this day. The largest increase in Aggregate Target noted was 91.7MW and the largest reduction in Aggregate Target noted was –123MW.
(D3b) Tuesday 6th October 2020
The network outage (constraint set ‘Q-BCNE_821’) had commenced on this morning … and the ‘hard ramp’ applied.
The largest increase in Aggregate Target noted was 116.0MW and the largest reduction in Aggregate Target noted was –118MW.
(D3b) Wednesday 7th October 2020
The largest increase in Aggregate Target noted was 161.4MW and the largest reduction in Aggregate Target noted was –131MW.
(D3c) Thursday 8th October 2020
The largest increase in Aggregate Target noted was 74.9MW and the largest reduction in Aggregate Target noted was –124MW.
(D3b) Friday 9th October 2020
The largest increase in Aggregate Target noted was 94.8MW and the largest reduction in Aggregate Target noted was –95.5MW.
(D3b) Saturday 10th October 2020
Something seems to have changed by Sunday morning (but I have not explored, yet, to understand it all). The largest increase in Aggregate Target noted was +352MW at 12:55 (and the largest reduction in Aggregate Target noted was –367MW at 12:25
(i) Both of these (i.e. the reduction at 12:25 and then the increase at 12:55) were considerably larger than the days above, and
(ii) They were associated with curtailment to 0MW in aggregate.
(iii) Whilst the price did not spike at 12:30, it did drop to the –$1,000/MWh Market Price Floor at 12:55 as a result of the increase of 352MW in low-priced supply.
(D3b) Sunday 11th October 2020
The largest increase in Aggregate Target noted was 85.4MW and the largest reduction in Aggregate Target noted was –114MW.
(D3c) Monday 12th October 2020
The largest increase in Aggregate Target noted was +493MW at 13:10 (and +302MW at 13:35 also notable) and the largest reduction in Aggregate Target noted was –570MW at 11:20.
(i) The large increase in generation at 13:10 did drive the dispatch price down to –$1,000/MWh (and down to –$153.76/MWh at 13:55)
(ii) Earlier, the 570MW reduction in aggregate solar generation at 11:20 only shifted the price from $30.90/MWh to $79.00/MWh … so nothing as dramatic as the next day, which saw only a slightly larger reduction in output.
(D3b) Tuesday 13th October 2020
This was the day that’s been the focal point for this evolving Case Study.
The largest increase in Aggregate Target noted was +425MW at 14:25 and the largest reduction in Aggregate Target noted was –589MW at 09:45.
(D3b) Wednesday 14th October 2020
Remember that the ‘soft ramp’ was applied into the RHS of the 9 x Constraint Equations from 11:40 on this day.
Before 11:40 on Wednesday 14th October
Before 11:40, the output had been a bit of a yo-yo, with the following dispatch intervals of particular note:
At 08:50 a –340MW change
At 08:55 a +414MW change
At 09:00 a –414MW change
At 09:05 a +476MW change
At 09:10 a –476MW change
… then 2 DIs respite
At 09:25 a +594MW change
At 09:35 a –563MW change
At 09:55 a +424MW change
At 10:10 a –214MW change
At 10:40 a 418MW change
At 11:40 a –450 MW change
After 11:40 on Wednesday 14th October
Even after the introduction of these ‘soft ramp’ provisions, the yo-yo continued:
At 11:55 a +553MW change
At 12:00 a –314MW change
At 12:05 a +255MW change
At 12:10 a –217MW change
At 14:55 a +222MW change
(D3b) Thursday 15th October 2020
The largest increase in Aggregate Target noted was +459MW at 10:40 (with +214MW at 11:05 and 322MW at 11:35 being notable, as well) and the largest reduction in Aggregate Target noted was –467MW at 09:40 (with –275MW at 10:50 and –353MW at 11:10 being notable, as well).
(D3b) Friday 16th October 2020
The network outage (constraint set ‘Q-BCNE_821’) ended at 15:45 on this day.
In that case, it’s interesting that the largest increase in Aggregate Target noted was +564MW at 15:50. Another notable mentions was +405MW at 06:55 – and the largest reduction in Aggregate Target noted was –219MW at 08:30.
(D3b) Saturday 17th October 2020
The first day back after the outage, and ‘delta Target’ returns to much more modest levels. The largest increase in Aggregate Target noted was +130MW and the largest reduction in Aggregate Target noted was –122MW .
(D4) That’s all for now
That’s all I have time for now, folks…
(E) Do you know of others who can help us?
We’ve appreciated having Marcelle Gannon join our team earlier this year (and perhaps even escape Melbourne to visit the Brisbane office before the end of the year), and also have Linton Corbet join more recently.
As fast as we can find people to join our team, however, the growing demand for our products is continuing to stretch our capabilities.
Hence please do let us know if you know of others who can help us in these two particular ways?


Terrific post, thanks Paul.
Interested readers may also be interested in this working paper: We document the increasing frequency of system strength and transmission constraints binding in the NEM, coincident with increasing VRE penetration in SA and QLD. We also document some evolution to the form and frequency of the the SA system strength constraints binding. https://papers.ssrn.com/sol3/papers.cfm?abstract_id=3501336
Scrutiny on how the constraints in NEMDE are decided upon should be healthy – there are real trade-offs to consider when setting these constraints – while a more risk averse approach should of course improve system resilience, these tighter constraints can only increase system-wide generating costs. Consequently, innovations that allow the loosening constraints without impacting reliability probabilities will provide tangible economic benefits.